
The Plant Cell,
Vol.
2, 323-333, April
1990
O
1990
American Society
of
Plant Physiologists
Alternative Promoters
Are
Used for Genes within Maize
Chloroplast Polycistronic Transcription Units
Jean
Haley
and
Lawrence
Bogorad’
Department of Cellular and Developmental Biology, Harvard University, Cambridge, Massachusetts 021 38
Many chloroplast genes are co-transcribed in polycistronic transcription units that give rise to numerous overlapping
RNAs, but the significance of this pattern of transcript accumulation is not understood. An analysis of the transcripts
of the adjacent and divergent maize psbE-psbF-psbL-ORF40 and ORF31- petE-ORF42 gene clusters indicates that
transcription initiation at alternative promoters contributes to the generation of overlapping RNAs for both clusters.
Furthermore, developmentally varying transcript ratios for the ORF31-petE-ORF42 gene cluster are determined at
least in part by selective promoter usage. During light-induced plastid maturation, increased levels of primarily
monocistronic petE transcripts accumulate from a promoter upstream of the interna1 petE gene. Dark-predominant
and non-light-responsive bi- and tricistronic transcripts result from transcription initiation upstream
of
ORF31, the
proximal gene of the cluster. In addition to the transcriptional overlap within gene clusters, divergent transcription
units for the two gene clusters overlap and reciproca1 antisense RNAs accumulate. The organization of the
transcription units in this region raises the possibility of promoter interdependence or other functional interaction
between transcription units.
INTRODUCTION
Many chloroplast polycistronic transcription units are char-
acterized by the accumulation of numerous heterogeneous
and overlapping RNAs. Gene sequences can be carried
on both mono- and polycistronic transcripts in various
patterns of transcript redundancy that are not understood.
The overlapping RNAs of a polycistronic transcription unit
may accumulate to different steady-state levels, and ratios
of transcripts may vary during light-induced plastid devel-
opment (Rodermel and Bogorad, 1985; Hudson et al.,
1987; Rock et al., 1987; Gamble et al., 1988; Westhoff
and Herrmann, 1988; Woodbury et al., 1988; for review,
see Gruissem, 1989).
The current model used to explain the generation of
complex transcript accumulation patterns for co-tran-
scribed chloroplast genes is largely generalized from anal-
yses of the transcription of thepsbB-psbH-petB-petD gene
cluster. The model assumes that heterogeneous tran-
scripts accumulate as a result of extensive post-transcrip-
tional processing
of
a large primary polycistronic transcript.
A primary precursor transcript for the
psbB
gene cluster
has been identified and mapped by in vitro transcription
(Westhoff and Herrmann, 1988) and in vitro capping (Koh-
chi et al., 1988); multiple mRNA processing events, includ-
ing splicing, endonucleolytic cleavage, and
5’
and 3‘ end-
trimming, have been deduced from transcript accumulation
patterns for the cluster in maize, tobacco, and spinach
’
To
whom correspondence should
be
addressed.
(Rock et al., 1987; Tanaka et al., 1987; Westhoff and
Herrmann, 1988). Transcripts of other complex transcrip-
tion units have been mapped (e.g., Hudson et al., 1987;
Gamble et al., 1988), but the origins of the transcripts have
not been analyzed.
A
corollary to the transcript-processing
model derived from analyses
of
the
psbB
gene cluster is
the proposal (Gruissem et al., 1988) that developmentally
regulated transcript processing or stability, rather than
initiation, accounts for developmental changes in the tran-
script ratios of complex transcription units.
We have analyzed the transcripts of two adjacent and
divergent maize gene clusters. The
psbE-psbF-psbL-
ORF40
cluster encodes three polypeptide subunits of the
photosystem
II
photosynthetic electron transport complex
of the thylakoid membrane (Westhoff et al., 1985; Widger
et al., 1985; lkeuchi et
al.,
1989; Webber et
al.,
1989; for
review of photosystem
II,
see Rochaix and Erickson, 1988)
and one unidentified polypeptide. The divergent ORF31-
petE-ORF42 gene cluster encodes a polypeptide subunit
of the photosynthetic electron transport cytochrome
b6-f
complex (Haley and Bogorad, 1989; for review of the
cytochrome bs-f complex, see Hauska et al., 1983) and
two unidentified polypeptides. We find that the
5’
hetero-
geneity of some of the overlapping transcripts of both gene
clusters results from transcription initiation at more than
one promoter; other
5’
termini probably derive from the
processing
of
precursor transcripts. During light-induced
chloroplast maturation, increased levels of severa1 mono-

324 The Plant Cell
cistronic perE transcripts accumulate from a promoter
interna1 to the transcription unit expressing the entire
ORF31 -perE-ORF42 gene cluster. Thus, developmentally
varying transcript ratios within this polycistronic transcrip-
tion unit are determined in part by selective promoter
usage. The overlap of transcription units for the two gene
clusters in this region raises the possibility of functional
interaction between them, including promoter interactions
that may influence transcription.
R
E
SU
LTS
Transcripts
of
the Divergent psbE-psbF-psbL-ORF40
and
ORF31-petE-ORF42 Gene Clusters
Figure 1 shows the gene organization and the position in
the maize chloroplast genome of the divergent psbE-psbF-
psbL-ORF40 and ORF31 -petE-ORF42 gene clusters.
A
series of DNA probes spanning the 4.0-kb region contain-
ing the divergent, adjacent gene clusters was used for
RNA gel blot analyses of transcript accumulation in maize
seedling leaves. Figure 2 shows RNA gel blots of tran-
scripts complementary to DNA probes
A
to
H,
which
accumulate in leaves
of
dark- and light-grown seedlings
(“D”
and
“L”
lanes, respectively, top panel). The diagram
in Figure 2 (bottom panel) indicates the approximate size,
location, and relative abundance
of
the detected tran-
scripts as well as their relative accumulation in dark- and
light-grown seedling leaves. The transcripts are assigned
to
groups
I
to
VI1
based on the positions of their
5’
termini
as established by RNA gel blot and
S1
nuclease mapping
analyses shown in Figures 2 and 3, respectively. More
than 25 transcripts of varying abundance and varying
ratios of accumulation in the leaves
of
dark- and light-
grown plants hybridize
to
this region. The eight transcripts
in groups
I1
and
111
contain sequences of the psbE-psbF-
psbL-ORF40 gene cluster, whereas the 17 transcripts in
groups
I,
IV,
V,
and
VI
contain sequences of the ORF31-
petE-ORF42 cluster. Two transcripts in group
VI1
map
downstream of ORF42 and are not analyzed here. The
tRNAs are transcribed divergently from the ORF31 gene
cluster.
The 1 .O-kb intergenic sequence between the proximal
genes
of
the divergent clusters,
psbE
and ORF31, is
transcribed from both strands and is carried on severa1
dark-predominant, low-abundance transcripts that trav-
erse the entire region in both directions and proceed
through the flanking coding regions
of
both clusters (Figure
2, probes
B
to
D,
transcript groups
I
and
11).
Thus, the
initial
1
.O-kb leader sequences of the overlapping group
I
and
I/
transcripts are reciproca1 antisense RNAs that ac-
cumulate primarily in the etioplasts of dark-grown leaves.
After dark-grown seedlings have been illuminated for about
72 hr, these transcripts decrease in abundance to levels
y
120
20%
\
”=j-m
Zea
mays
uKb*
80
70
6o
919’
Bam
HI
D
Figure
1.
Location on the Maize Chloroplast Chromosome and
Organization of the Divergent psbE-psbF-psbL-ORF4O and
ORF31 -petE-ORF42 Gene Clusters.
Filled boxes represent coding regions; those above the line are
transcribed to the right, and those below the line are transcribed
to the left, as depicted by arrows. The region analyzed in this
paper cornprises the maize chloroplast BarnHl fragrnent
15’
(2760
bp) and two neighboring BamHl fragments of 835 bp and 320 bp
not previously mapped (nucleotides 43080 to 46995 of the maize
chloroplast map) (Larrinua et al., 1983). The rnaize coding se-
quences are organized similarly to the corresponding chloroplast
genes
of
liverwort (nucleotides 62794
to
65155) (Ohyama
et
al.,
1986), tobacco (nucleotides 66170
to
69418) (Shinozaki et al.,
1986), and rice (nucleotides 61565 to 64756) (Hiratsuka et al.,
1989).
fourfold
to
fivefold lower than those found in dark-grown
leaves and similar to the levels in chloroplasts of light-
grown leaves (Figure 2, probes
B
to
D,
compare “D” and
“L” lanes; greening series not shown).
A
number of more abundant and overlapping (same-
sense) transcripts hybridize to the coding regions of the
two clusters. The six tetracistronic transcripts of group
111
(Figure 2, diagram) contain the entire
psbE
gene cluster
and have
5’
ends that map near the proximal psbE gene
at a position approximately 1 kb downstream of the
5’
termini
of
the group
/I
psbE
cluster transcripts. The major
transcript of group
111,
the 1 .l-kb transcript, accumulates
to about the same leve1 in leaves
of
both dark- and light-
grown plants (probes
A
and
B)
and exhibits only a minor

Alternative
Promoters
for
Plastid Genes
325
A
B C D E F Q H
1
D L " D L' 'D L"D L"D L' '
o
L' ' D L' ' D L '
«.o-|
2.8-
2.3-
z.r
1.7-
'
1.4-,
1.1-l|
0.8-
**
Probes:
B C D E F G H
~u——ii———ii——ii————i
r~
rO
U_
UJ
0=
U
O Q.
/
:
21^
4.0
.
2.6 •
1.7 •
O—
•
0.22
Figure
2. RNA Gel
Blot Analyses
and
Schematic Diagram
of
Transcripts.
Total
leaf
RNA (5 ng)
isolated
from dark-grown
(D) or
light-grown
(L)
maize seedling leaves
was
separated
by gel
electrophoresis
and
analyzed with
a
series
of
double-stranded
DNA
probes
(A to
H)
containing different regions
of the two
gene clusters (shown
at
top and
center).
The
schematic diagram (bottom) shows tran-
scripts organized into groups
/ to VII
based
on the
positions
of
their
5'
termini
and
their direction
of
transcription [determined
by
single-stranded
M13
probes (data
not
shown)
and
designated
by
arrows]. Sizes
of
transcripts
(in
kilobases)
are
shown
at
left
(for
pst>E-ps£>F-pst>L-ORF40
gene cluster transcripts transcribed
to
the
left)
or at
right
(for
ORF31-pefE-ORF42 cluster transcripts
transcribed
to the
right).
The
approximate relative abundance
of
transcripts
is
indicated
by the
thickness
of
arrow lines
and the
size
of
circles representing
5'
transcript termini, both
of
which
increase with increased relative
abundance.
The 5'
circle
also
indicates whether
a
transcript accumulates predominantly
in
dark-
grown leaves
(•),
predominantly
in
light-grown leaves
(O),
or to
similar levels
in
both dark-
and
light-grown leaves
(O).
transient increase
during
chloroplast maturation triggered
by
the
illumination
of
etiolated leaves (Sheen
and
Bogorad,
1988).
The
other group
///
transcripts
are
much less abun-
dant
and
either have
an
accumulation pattern similar
to
that
of the
1.1-kb
transcript
or are
present
primarily
in
etiolated leaves.
Each
of the
three genes
in the
ORF31-pefE-ORF42
cluster
is
carried
on
multiple heterogeneous transcripts,
most
of
which
are
polycistronic. Levels
of
these transcripts
either
decrease, increase,
or do not
change appreciably
(other than
a
slight transient increase) upon illumination
of
dark-grown seedlings (greening series
not
shown; abun-
dance
in
leaves
of
dark-
and
light-grown plants shown
in
"D"
and "L"
lanes, probes
B to H). In
addition
to the
four
low-abundance, dark-predominant group
/
transcripts that
contain
the
coding regions
of the
gene cluster, there
are
three groups
of
ORF31 cluster transcripts:
(1)
group
IV
transcripts
have
5'
ends
that
map at
several
sites near
the
proximal ORF31 gene
and are
either more abundant
in
dark-grown
leaves
than
in
light-grown
leaves
or
accumu-
late
to
similar levels
in
both types
of
leaves,
(2)
group
V
transcripts have
5'
ends that
map to a
region
in
front
of
the
internal pefE gene
and
share
a
pattern
of an
approxi-
mately
fourfold
to
fivefold relative increase
in
abundance
upon
the
illumination
of
dark-grown plants
for 48 hr and
longer (greening series
not
shown; relative levels
in
dark-
and
light-grown leaves shown
in
Figure
2,
probes
E to H),
(3)
group
VI
transcripts
have
5'
ends that
map
upstream
of
the
distal ORF42 gene
and
accumulate similarly
in
dark-
and
light-grown
leaves
(probe
H).
Whereas transcripts
of
the
psbE
gene
cluster
accumulate
to
much
higher
levels
in
mesophyll than
in
bundle sheath cells
of
maize (Sheen
and
Bogorad, 1988), members
of all
four groups
of
ORF31
cluster transcripts accumulate
to
approximately
the
same
level
in
both
leaf
cell types (data
not
shown).
Transcripts
of
Both Gene Clusters
Are
Initiated
at
More
than
One
Promoter
Figures
3, 4, and 5
show
the S1
nuclease protection
mapping
of 5'
transcript termini
and
"Northern-Cross"
hybridization analyses
of in
vitro capped plastid RNA.
These approaches were used
to
determine
the
origins
of
the
overlapping transcripts
of the two
gene clusters. Taken
together, data from
RNA gel
blot analyses,
S1
nuclease
protection mapping
of
transcript
5'
termini,
and the
analy-
sis
of
capped
RNAs
indicate that transcripts
of
both gene
clusters
are
initiated
at
more
than
one
promoter.
A
Group
III
psbE Gene Cluster Transcript Arises
by
Transcription Initiation
The
major 1.1-kb
group
///
transcript
of the
psbE
gene
cluster
has
been observed
in
spinach (Westhoff
et
al.,

326
The
Plant Cell
B
5'probe
•—
mRNA
—---
-• le)
—•
(ci
Figure
3. S1
Nuclease Protection Fine-Mapping Analysis
of the 5'
Termini
of
Transcripts.
Total
leaf
RNA (50 ng)
isolated from either dark-grown
(DARK)
or
light-grown (LIGHT) maize seedling
leaves
was
hybridized with
excess
5'
end-labeled
DMA
probe
as
shown. Protected fragments were mapped against sequencing ladders; 5'-terminal bases
of
mapped
transcripts
are
aligned with
the
complementary ladder sequences.
(A)
1.1 -kb
psbE
gene cluster transcript.
(B)
Light-induced group
V
transcripts.
(C)
1.35-kb group
IV
transcript
(?).
(D)
Dark-predominant
group
/
transcripts.
(E)
0.53-kb
and
1.35-kb group
IV
transcripts.
(F)
0.26-kb group
VI
transcript.
1985),
Oenothera
(Carrillo
et
al., 1986),
and
wheat (Webber
et
al., 1989). Figures
3A and 4A
show that
the 5'
terminus
of
the
maize 1.1-kb transcript maps
to a
position
138
nucleotides
(nt)
upstream
of the
psbE
initiation
codon
near
sequences resembling chloroplast promoter elements.
A
similar
5'
terminus
has
been established
for the
wheat 1.1-
kb
transcript (Webber
et
al., 1989).
The
proximity
of
pro-
moter-like sequences suggests that
the
mapped
5'
termi-
nus
represents
the
transcription initiation site
of the
1.1-
kb
transcript.
Northern-Cross hybridization analysis (Graham
et
al.,
1986)
of in
vitro capped chloroplast
and
etioplast
RNA
was
used
to
identify
and map
primary
transcripts.
The
hybridization
of in
vitro capped (
32
P-GTP-labeled), electro-
phoretically separated transcripts
to
unlabeled
DNA
probes permitted
the
identification
of
cappable transcripts
by
the
simultaneous determination
of
their sizes,
map
positions,
and
approximate locations
of
their capped
5'
termini. Figure
5A
shows that
the
major
1.1-kbpsbE gene
cluster transcript
can be
capped
in
vitro
and is,
therefore,
a
primary
transcript
initiated
at the
site
of its
mapped
5'
terminus:
an
abundant, capped 1.1-kb chloroplast tran-
script hybridizes uniquely
to
chloroplast
DNA
probes
1 and
2,
which contain
thepsbE
gene cluster (Figure
5A,
-RNase
panel; probes shown
in
5D);
the
capped 1.1-kb transcript
co-migrates
with
the
1.1-kb
psbE
cluster transcript
de-
tected
by
probe
1 in a
standard
RNA gel
blot
assay
(at
left).
In the
second part
of the
experiment (shown
in
Figure
5A,
+RNase panel),
the
5'-labeled capped terminus
of the
1.1-kb
transcript
is
seen
to be
protected
from RNase
digestion
by
hybridization with
DNA
probe
2,
which
ex-
tends upstream
of
probe
1 and
contains
the
region
of the
S1-mapped
5'
terminus
of the
1.1-kb group
///
transcript,
but
not by
hybridization
with
DNA
probe
1
lacking this
5'

Alternative Promoters for Plastid Genes
327
group
111
71.1 kb
.
-35
.
-10
+1
40
A
5
I
. .
.
AAAACTGGATTGCTGTGCCATAGGAAGGATAGCTATACTAATTCGGTATACT~-TACAC~~TGGTA~TTGA~TCTCACAAGG~TGAAATA
80
120
mbE
TCAGTAATTTTCTATTTACTGCTGCATCCCATCTTTTTACGGAATCAATTCCTTTTTTGAAT~TTTTGGGAGCTCAGC
ATG TCT GGA
...
3'
BamHI
Met Ser Gly
group
IV
B
5
'
.
.
.
GTATTATCT
"-35"
VI
-
10
VI
ORF31
,,I/
CCCTTC ATG CTT ACT...TGA
MTGMTTGAATAGAAGAATCTTTCPTTTTGGATTCTTGGTATTCTAGACTCTTTTCCACACTMTTACCAATTCTTT
Met Leu Thr
group
v
1.35 kb
1?1
"-35"
11 -
10
*I
1
1°122kb
@E
TCTTGGTCATTGAGATTCGTGGGTAGACTATTATTTAT~AGAGATAGATCGTACCTCTTTTTTTATCCCCTCG~CAAATCGM
ATG ATT GAA...)'
"light-induced"
Met Ile Glu
group
I
I
I
1.1 kb
7
(OPPOSITE STWD)
3'...AAACATGGmCCACATAAAACTCATATGGCTTMTCATATCGATAGG~GGATACCGTGTCGTTAGGTC...5'
-33
-10
+l
40
t
group
I
"dark"
+1
-10
-35
c
5
'
.
.
.
TTCATCCTTGTGAGATTGTCM~TGTAC~GGTGTAT~TGAGTATACCGMTTAGTATAGCTATCCTTCCTATGGCACAGCMTCCAGTTTTGCTT
80
120
GGTCCCGAAACAGAATTCCT~CT~~G~CCTTGTCTATAGG-~ACATGTTATTCAAGGCATCAATAGMCCCCACAATTTTTTGGGTCCTA
160 200
ORF31
CTTATTTTCATTGTCTTCGGAATAGTAGMTM~AATTT~MTAGCGGCCAAGATCTTGGGAAAATCTA...875
nt... ATG CTT ACT
... 3'
BglII
Met Leu Thr
grovp
VI
n
o.26
kb
ORF
42
D
5
'
. . .
AAATACAAAGGATCTTGGGCMGAGTATCTGATCATATATGTATTCCMTACGGAAGGAGGATTTTCA
ATG CGG GAT
. .
.3
'
Met Arg Asp
Figure
4.
Nucleotide Sequences (RNA-Like Strand) Containing S1 Nuclease Protection Mapped 5' Transcript Termini
of
the Two Gene
Clusters.
Arrows above the sequence indicate the mapped termini shown in Figure
3.
Sequences resembling "-35" and "-10" chloroplast promoter
elements (Hanley-Bowdoin and Chua, 1987) are underlined. The heptanucleotide sequence ATGA/TATT located near processed 5' termini
is doubly underlined. Nucleotides are numbered in
(A)
and
(C)
beginning with the first base
of
the group
///
and group
/
transcripts,
respectively.
(A)
Sequence upstream of the psbE gene containing the 5' terminus of the major
1
.I
-kb group
///
transcript; the BamHl site used for S1
mapping (Figure 3A) is shown.
(E)
Sequences in the region of the adjacent ORF31 and petE genes containing
5'
termini of group
/V
and the group
V
light-induced
transcripts.
(C)
Sequence containing the
5'
terminus of dark-predominant group
/
transcripts; the Bglll site used for
SI
mapping (Figure
3D)
is shown.
At top is shown the sequence
of
the opposite strand containing the
5'
terminus
of
the divergent 1 .I-kb group
///
transcript for the
psbE
gene cluster
[(A)].
(D)
Sequence upstream of the ORF42 gene containing the
5'
terminus
of
the 0.26-kb group
VI
transcript.
region. The other, less abundant,
psbE
gene cluster tran-
scripts of groups
11
and
111
are not detected as cappable
chloroplast transcripts in vitro and may arise by the post-
transcriptional processing of either a primary group
11
transcript (unidentified here) or the cappable group
111
1
.l-
kb primary transcript. We conclude that transcripts
of
the
psbE
gene cluster are initiated at two different promoters
because: (1) in vitro capping of the major
1
.l-kb group
111
transcript indicates the existence of a functional promoter
(PIII)
upstream of its
5'
terminus (shown in Figure
6),
and
(2)
the approximate position of
5'
termini for group
11
transcripts mapped by
RNA
gel blot analysis implies the

328 The
Plant Cell
RNA
Capped
gel
blot
Chloroplast
RNA
D
L
-RNase
+
RNase
RNA
gel
blot
Chloroplast
RNA
RNase"
Capped
Etioplast
RNA
kb
3)
Z
kb
m
1.35*
0.95*
055*.
0.22*
1 2
DNA
—
Probes
1 2
kb
DNA
—
Probes
f«
t t
256256
DNA ———
Probes
2
————————
i
r~-*
5
6
3
4
o
a
Figure
5.
Northern-Cross Hybridization Analysis
of in
Vitro Capped Chloroplast
and
Etioplast RNA.
Capped,
32
P-GTP-labeled
RNA
(75//g)
was
fractionated
by gel
electrophoresis
and
blotted without fixing onto
a
GeneScreen membrane;
uncapped (unlabeled) total leaf
RNA
from dark-grown
(D) or
light-grown
(L)
seedlings
was
separated simultaneously
in a
companion lane
and
analyzed with labeled
DNA
probes
as for
standard
RNA gel
blots.
(RNA
gel
blots
are
shown aligned
at the
left
of
each
hybridization
analysis
above.) Unlabeled
DNA
probes
1 to 6,
containing regions
of the two
gene clusters, were separated
on a
second gel, blotted,
and
fixed
to
Zeta-Probe membranes. Contact hybridization
of the two
membranes, oriented
at
right angles
to
each other, permitted
the
diffusion
of
labeled, capped
RNAs
and
their hybridization
to the
fixed
DNA
probes.
After
autoradiography
of the
"cross-hybridized" blot,
the
membrane
was
treated with
RNase
A to
digest
the
capped
5'
termini
of
transcripts that were
not
protected because
the
hybridizing
DNA
probes lacked sequences complementary with
the
termini;
cap
signals remaining after
RNase
treatment
are
considered indicative
of
hybridization-protected
5'
caps.
(A)
Autoradiogram
of
capped Chloroplast
RNA
"cross-hybridized"
to DNA
probes
1 and 2
before
(—RNase)
and
after (+RNase) RNase
A
treatment
of the
membrane;
RNA gel
blot aligned
at
left
is
assayed with labeled
DNA
probe
1.
(B)
Autoradiogram
of
capped Chloroplast
RNA
"cross-hybridized"
to DNA
probes
3 and 4
before (-RNase)
and
after (+RNase)
RNase
A
treatment
of the
membrane;
RNA gel
blot aligned
at
left
is
assayed with labeled
DNA
probe
4.
(C)
Autoradiogram
of
capped etioplast
RNA
"cross-hybridized"
to DNA
probes
2, 5, and 6
before (-RNase)
and
after (+RNase)
RNase
A
treatment
of the
membrane;
RNA gel
blot aligned
at
left
is
assayed with labeled
DNA
probe containing
the
psbE-ORF31 intergenic region
(corresponding
to
probes
B to D,
Figure
2).
(D) Map of
gene
organization,
indicating
subregions
contained
in DNA
probes
1 to 6
used
in the
"cross-hybridization"
analyses shown
in
(A)
to
(C).
The S1
-mapped origins
of
group
/,
group ///,
and
group
V
transcripts
are
shown (see Figures
3 and 4).
Probes
1 and 2
contain
thepsbE
gene cluster; they differ
in
length
by a
region containing
the
mapped
5'
termini
of
group
/ and
group
///
transcripts
(A = 360
bp).
Alternative Promoters for Plastid Genes
329
PI
I-
PP
t-
c
*
implied
by
existence
of
transcripts
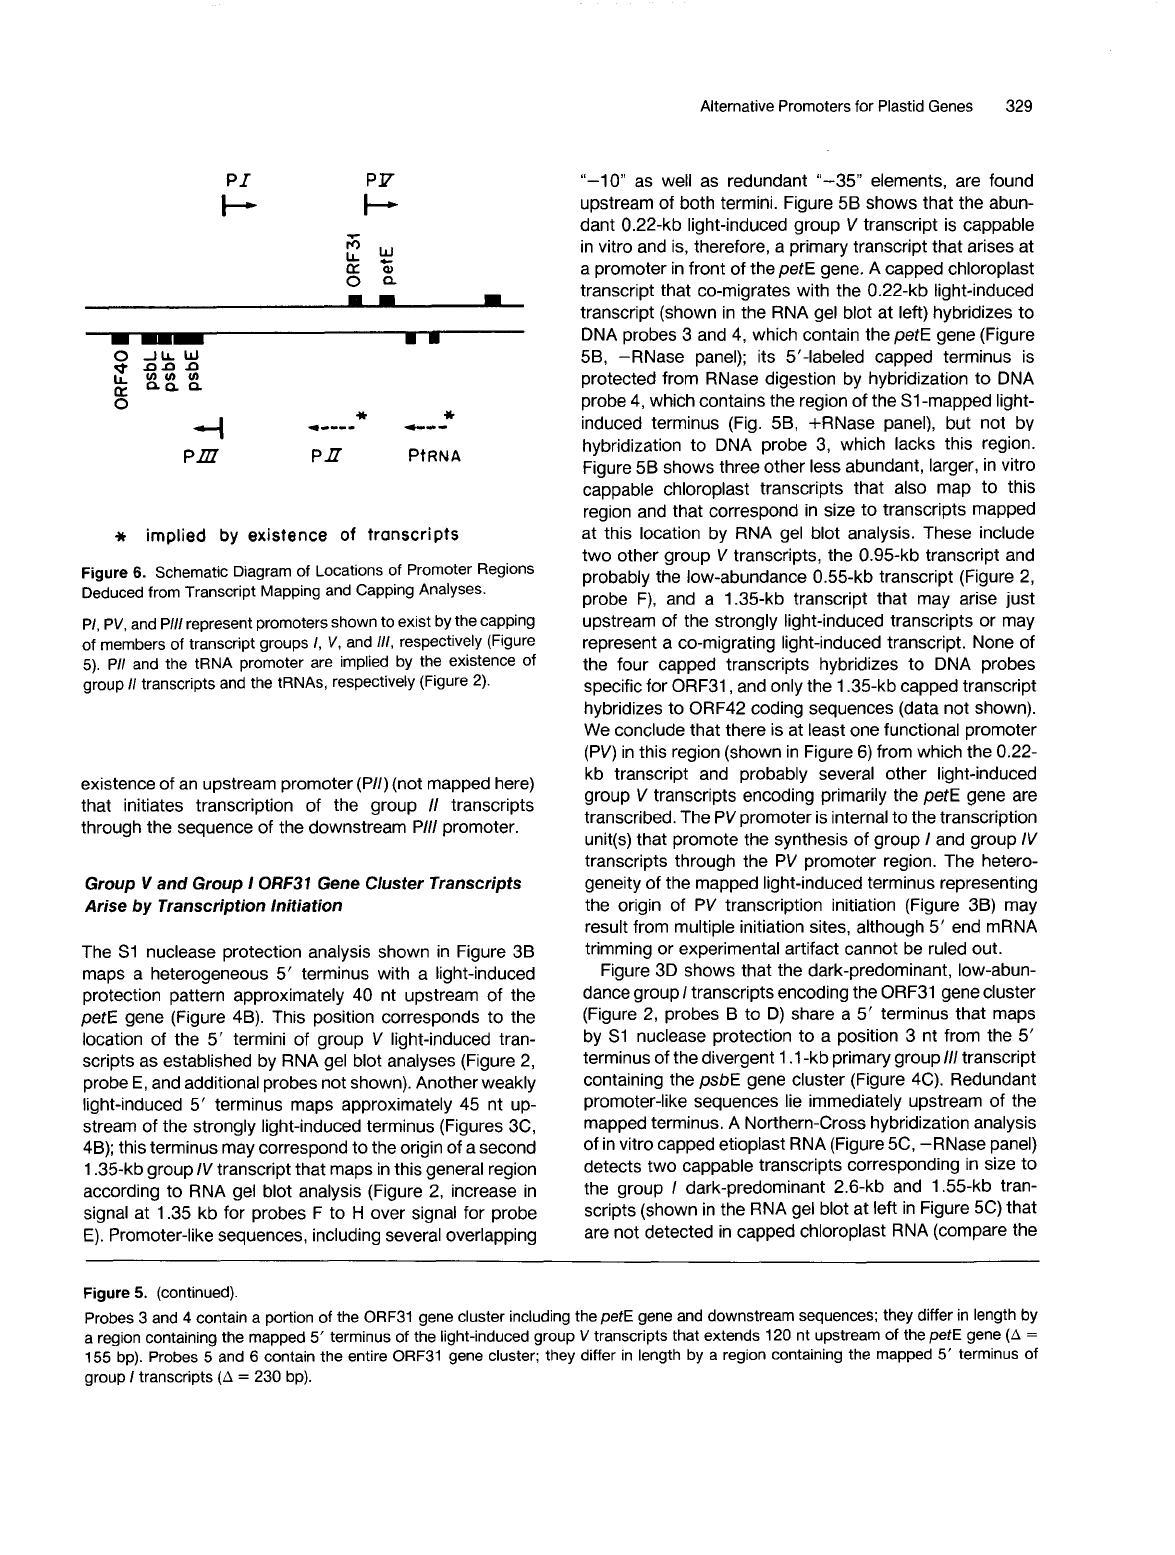
Figure
6.
Schematic Diagram of Locations
of
Promoter Regions
Deduced from Transcript Mapping and Capping Analyses.
PI,
PV,
and
PIII
represent promoters shown
to
exist
by
the
capping
of
members of transcript groups
I,
V,
and
/I/,
respectively (Figure
5).
PII
and
the
tRNA promoter are implied
by
the
existence
of
group
I/
transcripts and the
tRNAs,
respectively (Figure
2).
existence
of
an upstream promoter (PII) (not mapped here)
that initiates transcription of the group
/I
transcripts
through the sequence of the downstream PIII promoter.
Group
V
and Group I
ORF31
Gene Cluster Transcripts
Arise
by
Transcription lnitiation
The S1 nuclease protection analysis shown in Figure 3B
maps a heterogeneous
5’
terminus with a light-induced
protection pattern approximately 40 nt upstream of the
petE gene (Figure 48). This position corresponds to the
location of the
5’
termini of group
V
light-induced tran-
scripts as established by RNA gel blot analyses (Figure 2,
probe E, and additional probes not shown). Anotherweakly
light-induced
5’
terminus maps approximately 45 nt up-
stream of the strongly light-induced terminus (Figures 3C,
4B); this terminus may correspond to the origin of a second
1.35-kb group
IV
transcript that maps in this general region
according to RNA gel blot analysis (Figure 2, increase in
signal at 1.35 kb for probes F to
H
over signal for probe
E).
Promoter-like sequences, including several overlapping
“-10” as well as redundant “-35” elements, are found
upstream
of
both termini. Figure 58 shows that the abun-
dant 0.22-kb light-induced group
V
transcript is cappable
in vitro and is, therefore, a primary transcript that arises at
a promoter in front of thepetE gene. A capped chloroplast
transcript that co-migrates with the 0.22-kb light-induced
transcript (shown in the RNA gel blot at left) hybridizes to
DNA probes 3 and 4, which contain the petE gene (Figure
5B, -RNase panel); its 5’4abeled capped terminus is
protected from RNase digestion by hybridization to DNA
probe 4, which contains the region
of
the S1-mapped light-
induced terminus (Fig. 5B, +RNase panel), but not by
hybridization to DNA probe 3, which lacks this region.
Figure
58
shows three other less abundant, larger, in vitro
cappable chloroplast transcripts that also map to this
region and that correspond in size to transcripts mapped
at this location by
RNA
gel blot analysis. These include
two other group
V
transcripts, the 0.95-kb transcript and
probably the low-abundance 0.55-kb transcript (Figure
2,
probe F), and a 1.35-kb transcript that may arise just
upstream of the strongly light-induced transcripts or may
represent a co-migrating light-induced transcript. None of
the four capped transcripts hybridizes to DNA probes
specific for ORF31, and only the 1.35-kb capped transcript
hybridizes to ORF42 coding sequences (data not shown).
We conclude that there is at least one functional promoter
(PV) in this region (shown in Figure
6)
from which the 0.22-
kb transcript and probably several other light-induced
group
V
transcripts encoding primarily the petE gene are
transcribed. The PV promoter is interna1 to the transcription
unit(s) that promote the synthesis of group
I
and group
IV
transcripts through the PV promoter region. The hetero-
geneity of the mapped light-induced terminus representing
the origin of PV transcription initiation (Figure 38) may
result from multiple initiation sites, although
5’
end mRNA
trimming or experimental artifact cannot be ruled out.
Figure 3D shows that the dark-predominant, low-abun-
dance group
I
transcripts encoding the ORF31 gene cluster
(Figure 2, probes B to
D)
share a
5’
terminus that maps
by S1 nuclease protection to a position 3 nt from the
5’
terminus of the divergent 1.1 -kb primary group
111
transcript
containing the
psbE
gene cluster (Figure 4C). Redundant
promoter-like sequences lie immediately upstream of the
mapped terminus. A Northern-Cross hybridization analysis
of in vitro capped etioplast RNA (Figure 5C, -RNase panel)
detects two cappable transcripts corresponding in Size to
the group
I
dark-predominant 2.6-kb and 1.55-kb tran-
scripts (shown in the RNA gel blot at left in Figure 5C) that
are not detected in capped chloroplast RNA (compare the
Figure
5.
(continued).
Probes
3
and
4
contain a portion of
the
ORF31 gene cluster including
the
petE gene and downstream sequences; they differ in length
by
a region containing
the
mapped
5’
terminus
of
the
light-induced group
V
transcripts that extends
120
nt upstream
of
the
petE
gene
(A
=
155
bp). Probes
5
and
6
contain
the
entire
ORF31
gene
cluster;
they
differ
in length
by
a
region containing
the
mapped
5’
terminus
of
group
I
transcripts
(A
=
230
bp).

330
The
Plant
Cell
hybridization of capped etioplast RNA to DNA probe 2 in
Figure 5C with that of capped chloroplast RNA to the
same probe 2 in Figure 5A). The 5‘4abeled cap of the 2.6-
kb etioplast transcript is largely protected from RNase
digestion by hybridization with DNA probes 2 and
5,
which
contain the region of the mapped dark-predominant ter-
minus of the group
/
transcripts, but is unprotected by
hybridization with DNA probe 6 lacking this sequence
(Figure 5C, +RNase panel). The cap signal of the 1.55-kb
transcript hybridized to probe 6 is not abolished by RNase
treatment, but it is somewhat diminished by comparison
to the 1.55-kb signal protected by hybridization with
probes 2 and
5;
secondary RNA structure may protect the
cap from RNase digestion or there may be more than one
co-migrating primary 1.55-kb transcript. We conclude that
at least one dark-predominant group
I
transcript (2.6 kb)
is initiated at a promoter
(PI)
(Figure 6). Figure 4C shows
that the
PI
promoter may be located in the region of DNA
transcribed from the divergent
PlII
promoter to yield the
initial bases of the 1 .l-kb psbE cluster primary transcript.
Thus, adjacent and divergent
PI
and
PIII
promoters for the
two gene clusters may each initiate transcription within a
region complementary to the promoter sequence of the
other.
5’
Processing
of
Transcripts Encoding the
ORF31-
petE-ORF42 Gene Cluster
Severa1 major non-light-responsive or dark-predominant
ORF31 cluster transcripts are not capped in vitro, and
their
5’
termini, therefore, may well be determined by post-
or co-transcriptional processing. Transcripts in groups
IV
and
VI,
whose
5’
termini map upstream of the ORF31 and
ORF42 genes, respectively, fall into this category. Figures
3E and 3F show the major
5’
termini mapped in these
regions of the gene cluster by S1 nuclease protection.
RNA gel blot analyses with probes extending upstream
from within the ORF31 gene (data not shown) allow the
termini mapped in Figure 3E to be assigned to the 0.53-
kb and one of the 1.35-kb group
IV
transcripts (Figure 48).
The terminus mapped in Figure 3F corresponds to the
0.26-kb group
VI
transcript encoding ORF42 (Figure 4D).
Upstream promoter-like sequences are not found near the
5’
termini of these transcripts. Although RNA gel blot
analyses clearly indicate that a 1.55-kb dark-predominant
transcript must also originate in the region just upstream
of the ORF31 gene (Figure 2, increase in signal at 1.55 kb
for probes E to H over that for probes
B
to D), no dark-
predominant terminus was identified by S1 nuclease or
primer extension mapping. RNA secondary structure may
interfere with the mapping of this terminus.
The heptanucleotide sequence ATGA/TATT is found in
the DNA sequence near the mapped locations of the
5‘
termini of major noncappable transcripts as well as near
other minor S1 -mapped termini (double-underlined se-
quences in Figures 48 and 4D). The heptanucleotide is not
found elsewhere in the 4.0-kb DNA region, and its corre-
lation with the position of 5’-processed transcript termini
suggests that it may have a role in their processing. This
sequence has some resemblance to the hexanucleotide
YGGAA/TY associated with the
5‘
termini of psbB gene
cluster transcripts thought to be generated by endonucleo-
lytic cleavage (Westhoff and Herrmann, 1988).
DISCUSSION
The results presented here indicate that the multiple het-
erogeneous transcripts that encode chloroplast gene clus-
ters can arise by transcription initiation from more than
one promoter. This is a new finding for chloroplast gene
transcription and it not only has interesting implications for
the expression of the genes analyzed here but also permits
a refinement of the operative concept of the chloroplast
polycistronic transcription unit. Each of the gene clusters
we describe is not transcribed solely as one large tran-
scription unit defined by a single proximal promoter but
rather as overlapping units defined by tandem promoters.
The use of more than one promoter for the transcription
of chloroplast genes may be unique to the expression of
the two gene clusters analyzed here but it seems likely to
occur more generally. Thus, it may be instructive to analyze
the transcript families within other polycistronic transcrip-
tion units. This would include, for example, such transcripts
as the internal light-induced transcripts of the psbD-psbC
cluster (Gamble et al., 1988) and the families of transcripts
arising upstream of
atpl
and atpH in the rps2-atpl-atpH-
atpF-atpA cluster (Rodermel and Bogorad, 1985; Hudson
et al., 1987).
For the ORF31-pefE-ORF42 gene cluster, where tran-
script ratios vary during the maturation of chloroplasts
induced by the illumination of dark-grown seedling leaves,
there is a general correlation between promoter usage and
the developmental pattern of accumulation of the tran-
scripts. That is, transcripts that accumulate predominantly
in the etioplasts of dark-grown leaves arise from proximal
promoters, whereas at least one major transcript that
becomes more abundant during light-induced chloroplast
maturation originates at a dista1 promoter. The major light-
induced transcript encodes the internal petE gene, and-
although we have no direct evidence on this point-its
accumulation may serve to uncouple the expression of
petE from that of ORF31 and ORF42 during and following
plastid maturation. It has been suggested that the light-
induced accumulation of barley chloroplast psbD-psbC
transcripts during plastid maturation is required to maintain
translation of the psbD and
psbC
gene products in mature
chloroplasts (Gamble et al., 1988).
A
similar case may
obtain for the expression of the 4-kD cytochrome-bs-f
polypeptide encoded by petE.

Alternative Promoters for Plastid Genes
331
It
is less clear how dual promoter usage may influence
the expression of genes in the psbE-psbF-psbL-ORF40
cluster. However, an intriguing characteristic of the tran-
scripts that accumulate from the upstream PII promoter is
their complementarity, over their initial
1
kb, to transcripts
initiated at the divergent PI promoter of the ORF31 cluster.
It is not known whether double-stranded RNAs of the
complementary transcript sequences form in vivo;
if
so,
they may provide a functional link between the two over-
lapping transcription units that is in some way involved in
their regulation.
The light-induced increase in accumulation of primary
transcripts from the interna1 promoter of the ORF31 gene
cluster may result from developmental regulation of either
transcript initiation or transcript stability. Currently, it is not
known how chloroplast promoters are regulated or to what
extent the specific regulation
of
initiation at a promoter
determines the levels and patterns of transcript accumu-
lation. It has been proposed that the differential develop-
mental accumulation of chloroplast transcripts can be ac-
counted for entirely by changes in transcript stabilities due
to
the interaction of developmentally regulated proteins
with stem-loop structures at the
3’
transcript termini
(Gruissem et al., 1988). The shortest and most abundant
of the light-induced family of petE transcripts, the 0.22-kb
transcript, may contain a predicted stem-loop structure at
its 3‘ end
(A
G
=
-20.9 kcal) that could function in such
a regulatory scenario for differential stability. However,
other light-induced transcripts do not contain stable pre-
dicted stem-loop structures near their
3’
termini. If differ-
ential stability accounts for the light-induced increase in
accumulation of group
V
transcripts, the mechanism for
conferring this stability might be more likely
to
involve the
5’
sequences (or secondary RNA structures) that are
common
to
all the transcripts. There are, in fact, data from
other systems that indicate that
5’
transcript sequences
may influence transcript stability (for review, see Brawer-
man, 1989).
The accumulation of the petE gene-encoded 4-kD poly-
peptide during greening (Haley and Bogorad, 1989) paral-
lels rather closely the accumulation of the light-induced
family of primary petE transcripts. There is a relatively low
level of the
petE
polypeptide in etioplasts, despite the
association of many petE-encoding transcripts with poly-
somes (data not shown). The petE gene is distal to the
ORF31 gene on all the transcripts that accumulate in
etioplasts except the relatively scarce group
V
monocis-
tronic transcripts. Assuming that the 4-kD polypeptide is
not turned over rapidly in etioplasts, the low level of its
accumulation may be due to inefficient translation from
transcripts on which it is not the proximal gene.
The extensive overlapping
of
transcription units in the
region of the two chloroplast gene clusters analyzed here
raises severa1 possibilities of promoter-promoter interac-
tions that may regulate transcription initiation. In both
prokaryotic and eukaryotic systems, interactions between
tandem or adjacent divergent promoters have been shown
to
regulate transcription initiation and affect transcript
abundance (Adhya and Gottesman, 1982; Proudfoot,
1986; Biswas and Getz, 1988). These interactions include
the steric hindrance of RNA polymerase binding at a
promoter by its binding at a closely situated promoter and
the inhibition of a promoter by transcription through it. In
the region analyzed here, the adjacent promoters for group
I
and group
111
transcripts (PI and PIII, Figure 6) appear to
have mutually exclusive RNA polymerase binding sites
that might preclude the simultaneous use of both pro-
moters on the same individual template. Furthermore,
transcription through the distal promoters of both gene
clusters (PIII and PV) might be expected
to
interfere with
initiation at these promoters. Simultaneous convergent
transcription of group
I
and group
I/
transcripts and of the
tRNAs and ORF31 cluster transcripts might also be ex-
pected to be incompatible.
It
is possible, however, that
if
promoter-promoter interactions do occur, they may oper-
ate differently in plastids containing many copies of a
genome than in cells having unicopy genomes. For exam-
ple, interference between plastid promoters may play a
role in determining how many individual chloroplast DNA
templates in the total multicopy population are used for
transcription at each promoter. It is not known whether all
chloroplast chromosomes are functionally equivalent with
respect to the transcription
of
any one gene or cluster at
any one time.
METHODS
DNA
Sequence
The DNA sequence of both strands of the maize chloroplast
DNA
fragment BamHl 15’ (Larrinua
et
al.,
1983;
derived
from plasmid
pZmc503) and two neighboring BamHl fragments of 320 bp and
835
bp
(Figure
1)
was
determined
by
chemical cleavage (Maxam
and
Gilbert, 1980) and dideoxy chain termination (Sanger
et
al.,
1977). The full sequence has been deposited in
the
GenBank@
EMBL
Data Bank (accession no. J04502); partia1 sequences are
shown in Figure
4.
The
tmP,
tmW, and
petE
sequences have
been
published
elsewhere
(Lukens
and Bogorad, 1988; Haley and
Bogorad, 1989).
RNA
Preparation and Gel Blot Analysis
Total leaf RNA was prepared from leaves of maize
[Zea
mays
(FR9
cms
x
FR37) lllinois Foundation Seed] seedlings grown for
7
days
in
darkness
or
in
the
greenhouse.
The
apical
5
cm of
leaves were harvested into liquid nitrogen and extracted
with
4
M
guanidinium thiocyanate (Maniatis
et
al., 1982).
RNA
was sepa-
rated on 1.2% agarose Mops-formaldehyde gels and transferred
to Zeta-Probe membranes
in
50
mM NaOH.
RNA
gel blots
were
hybridized
with
DNA
probes labeled
by
random hexamer priming
(Pharmacia
LKB
Biotechnology Inc.) in 250 mM sodium phosphate
(pH
7.2),
7%
SDS,
and
1
mM
EDTA
at
65°C
for
16
hr
to
30
hr.

332 The Plant Cell
S1
Nuclease Protection Assays
S1 nuclease protection of the 5' transcript termini was performed
using kinased double-stranded (ds) DNA probes. Total leaf RNA
was hybridized with excess denatured dsDNA probe in
80%
formamide hybridization buffer (Favoloro et al., 1980). The RNA-
DNA hybrids were treated with S1 nuclease, and protected DNA
fragments were sized on denaturing acrylamide gels next to
chemical cleavage sequencing ladders of the 5' end-labeled pro-
tecting probes.
In Vitro Capping
of
FINA and Norihern-Cross Hybridization
Analysis
Etioplast or chloroplast RNA (75 pg) was capped in vitro in a 40-
pL
reaction mixture containing
50
mM Tris-HCI (pH 7.9), 1.25 mM
MgC12, 6 mM KCI, 2.5 mM DTT, 80 units of RNasin, 350 pCi
of
~u-~~P-GTP (3000 Ci/mmol, Du Pont-New England Nuclear), and
1
O
units of guanylyltransferase (Bethesda Research Laboratories)
for 60 min at 37OC. A Northern-Cross hybridization method
(adapted from that of Graham et al., 1986) was used to analyze
the capped RNA. Capped, labeled RNA was separated electro-
phoretically across a 1.2% Mops-formaldehyde gel and trans-
ferred overnight in 10
x
SSC to a GeneScreen membrane without
subsequent immobilization. Unlabeled DNA fragments represent-
ing various subregions of the two gene clusters were separated
electrophoretically across the width of an agarose gel and trans-
ferred (and fixed) in 0.4 M NaOH to a Zeta-Probe membrane.
Contact-hybridization of the two membranes oriented at right
angles to each other was performed for 16 hr to 20 hr at 42OC in
50% formamide, 5
x
SSC, 50 mM NaP04 (pH 7.0), 0.2% SDS,
and 250 pg/mL salmon sperm DNA. Following autoradiography
of the "cross-hybridized membrane, the membrane was treated
with RNase
[250
pg
of
RNase
A
in
16.7
mL
of
incubation
buffer
containing 10 mM Tris-HCI (pH 7.5), 5 mM EDTA, and 300 mM
NaCI] for 30 min at
37OC
to digest labeled caps that were not
protected by hybridization to the DNA probe sequences.
ACKNOWLEDGMENTS
We thank Drs. Alan D. Blowers, Alice Cheung, Steven
R.
Roder-
mel, and Robert Troxler for helpful discussions. This work was
supported in part by a research grant from the National lnstitute
of General Medical Sciences.
Received August 7, 1989; revised February 4, 1990.
NOTE ADDED IN PROOF
Yao et al. [Nucl. Acids Res. (1989). 17,9583-95911 have recently
reported finding two transcription initation sites in the psbD-psbC
gene cluster of the tobacco chloroplast chromosome, and Wood-
bury et al. [Curr. Genet. (1989). 16, 433-4451 have found that
this is also the case for the same cluster in the pea chloroplast
genome. Data in the latter paper also indicate that there may be
more than one transcription initiation site for the rps2-atpl-atpH-
atpF-atpA cluster in pea.
REFERENCES
Adhya,
S.,
and Gottesman, M.
(1982). Promoter occlusion: Tran-
scription through a promoter may inhibit its activity. Cell 29,
939-944.
Biswas, T.K., and Getz, G.S.
(1
988). Promoter-promoter inter-
actions influencing transcription of the yeast mitochondrial
gene, Oli 1, coding for ATPase subunit 9:Cis and trans effects.
J.
Biol. Chem. 263,4844-4851.
Brawerman, G.
(1989). mRNA decay: Finding the right targets.
Cell 57, 9-10,
Carrillo, N., Seyer, P., Tyagi, A., and Herrmann, R.G.
(1986).
Cytochrome b-559 genes from Oenothera hookeri and Nicotiana
tabacum show a remarkably high degree of conservation as
compared to spinach. The enigma of cytochrome b-559: Highly
conserved genes and proteins but no known function. Curr.
Genet.
10,
619-624.
Favaloro, J., Treisman,
R.,
and Kamen,
R.
(1980). Transcription
maps of polyoma virus-specific RNA: Analysis by two-dimen-
Sional nuclease S1 gel mapping. Methods Enzymol. 65,
Gamble, P.E., Sexton, T.B., and Mullet, J.E.
(1988). Light-de-
pendent changes in psbD and psbC transcripts of barley chlo-
roplasts: Accumulation of two transcripts maintains psbD and
psbC translation capability in mature chloroplasts.
EMBO
J.
7,
Graham, D.E., Xu, Y.-H., Ishii,
S.,
and Merlino, G.T.
(1986).
Northern Cross hybridization for rapid identification of exon-
containing restriction fragments. Gene
48,
241 -249.
Gruissem,
W.
(1 989). Chloroplast gene expression: How plants
turn their plastids on. Cell 56, 161 -1 70.
Gruissem, W., Barkan, A., Deng, X.-W., and Stern, D.
(1988).
Transcriptional and post-transcriptional control of plastid mRNA
levels in higher plants. Trends Genet.
4,
258-263.
Haley, J., and Bogorad, L.
(1989). A 4-kDa maize chloroplast
polypeptide associated with the cytochrome b6-f complex: Sub-
unit 5, encoded by the chloroplast petE gene. Proc. Natl. Acad.
Sci. USA 96,1534-1538.
Hanley-Bowdoin, L., and Chua, N.-H.
(1 987). Chloroplast pro-
moters. Trends Biochem. Sci. 12, 67-70.
Hauska, G., Huri, E., Gabellini, N., and Lockau, W.
(1983).
Comparative aspects of quinol-cytochrome c/plastocyanin oxi-
doreductases. Biochim. Biophys. Acta 726, 97-1 33.
Hiratsuka, J., Shimada, H., Whittier,
R.,
Ishibashi, T., Saka-
moto, M., Mori, M., Kondo, C., Honji, Y., Sun, C.-R., Meng,
B.-Y.,
Li, Y.-Q., Kanno,
A.,
Nishizawa,
Y.,
Hirai, A., Shinozaki,
K., and Sugiura, M.
(1989). The complete sequence of the rice
(Oryza sativa) chloroplast genome: lntermolecular recombina-
tion between distinct tRNA genes accounts for a major plastid
DNA inversion during the evolution of the cereals. MOI. Gen.
Genet. 217,185-1 94.
Hudson, G.S., Mason, J.G., Holton, T.A., Koller, B., Cox, G.B.,
71 8-749.
1289-1 297.

Alternative Promoters for Plastid Genes
333
Whitfeld, P.R., and Bottomley, W. (1987).
A
gene cluster in
the spinach and pea chloroplast genomes encoding one CF,
and three
CFo
subunits of the H+-ATP synthase complex and
the ribosomal protein S2.
J.
MOI. Biol. 196, 283-298.
Ikeuchi,
M.,
Takio, K., and Inoue,
Y.
(1989). N-terminal sequenc-
ing
of
photosystem
II
low-molecular-mass proteins:
5
and 4.1
kDa components of the 02-evolving core complex from higher
plants. FEBS Lett. 242, 263-269.
Kohchi, T., Yoshida, T., Komano, T., and Ohyama,
K.
(1988).
Divergent mRNA transcription in the chloroplast psbB operon.
Larrinua,
L.,
Muskavitch, K.M.T., Gubbins,
E.,
and Bogorad,
L.
(1983). A detailed restriction endonuclease site map of the Zea
mays plastid genome. Plant
MOI.
Biol. 2, 129-140.
Lukens, J.H., and Bogorad, L. (1 988). Nucleotide sequence
containing the maize chloroplast proline (UGG) and tryptophan
(CCA) tRNA genes. Nucl. Acids Res. 16,5192.
Maniatis, T., Fritsch,
E.F.,
and Sambrook, J.
(1
982). Molecular
Cloning: A Laboratory Manual. (Cold Spring Harbor, New York:
Cold Spring Harbor Laboratory).
Maxam, A.M., and Gilbert, W.
(1
980). Sequencing end-labeled
DNA with base-specific chemical cleavages. Methods Enzymol.
Ohyama, K., Fukuzawa, H., Kohchi, T., Shirai, H., Sano, T.,
Sano,
S.,
Umesono, K., Shiki,
Y.,
Takeuchi, M., Chang,
Z.,
Aota,
S.,
Inokuchi, H., and Ozeki, H. (1986). Chloroplast gene
sequence deduced from the complete sequence
of
liverwort
Marchantia polymorpha chloroplast DNA. Nature 322,
Proudfoot, N.J. (1 986). Transcriptional interference and termina-
tion between duplicated m-globin gene constructs suggests a
nove1 mechanism for gene regulation. Nature 322, 562-565.
Rochaix, J.-D., and Erickson,
J.
(1 988). Function and assembly
of photosystem
II:
Genetic and molecular analysis. Trends
Biochem. Sci. 13, 56-59.
Rock, C.D., Barkan,
A.,
and Taylor, W.C. (1987). The maize
plastid psbB-psbF-petB-petD gene cluster: Spliced and un-
spliced petB and petD RNAs encode alternative products. Curr.
EM60
J.
7,885-891.
65,499-560.
572-574.
Genet. 12, 69-77.
Rodermel,
S.R.,
and Bogorad,
L.
(1985). Maize plastid photo-
genes: Mapping and photoregulation
of
transcript levels during
light-induced development.
J.
Cell Biol. 100, 463-476.
Sanger,
F.,
Nicklen,
S.,
and Coulson,
A.R.
(1977). DNA sequenc-
ing with chain-termination inhibitors. Proc. Natl. Acad. Sci. USA
Sheen,
J.-Y.,
and Bogorad,
L.
(1988). Differential expression in
bundle sheath and mesophyll cells of maize
of
genes for pho-
tosystem
I1
components encoded by the plastid genome. Plant
Physiol. 86, 1020-1 026.
Shinozaki, K., Deno, H., Sugita,
M.,
Kuramitsu,
S.,
and Sugiura,
M.
(1986). lntron in the gene for the ribosomal protein S16
of
tobacco chloroplast and its conserved boundary sequences.
MOI. Gen. Genet. 202, 1-5.
Tanaka,
M.,
Obokata, J., Chunwongse, J., Shinozaki, K., and
Sugiura,
M.
(1987). Rapid splicing and stepwise processing of
a transcript from the psbB operon in tobacco chloroplasts:
Determination of the intron sites in petB and petD. MOI. Gen.
Genet. 209,427-431.
Webber, A.N., Packman, L., Chapman, D.J., Barber, J., and
Gray, J.C. (1 989). A fifth chloroplast-encoded polypeptide
is
present in the photosystem
I1
reaction centre complex.
FEBS
Lett. 242, 259-262.
Westhoff, P., and Herrmann, R.G. (1988). Complex RNA matu-
ration in chloroplasts: The psbB operon from spinach. Eur.
J.
Biochem. 171,551-564.
Westhoff, P., Alt, J., Widger, W.R., Cramer, W.A., and Herr-
mann, R.G.
(1985).
Localization of
the
gene for apocytochrome
b-559 on the plastid chromosome
of
spinach. Plant MOI. Biol.
Widger, W.R., Cramer, W.A., Hermodson,
M.,
and Herrmann,
R.G. (1985). Evidence for a hetero-oligomeric structure of the
chloroplast cytochrome b-559.
FEBS
Lett. 191, 186-1 90.
Woodbury, N.W., Roberts, L.L., Palmer,
J.D.,
and Thompson,
W.F.
(1
988).
A
transcription map of the pea chloroplast genome.
Curr. Gen. 14, 75-89.
74,5463-5467.
4, 103-1 1
O.
