
Proceq GPR
Ground Penetrating Radar
User Manual

7. June 2024 © Copyright 2024, PROCEQ SA 2
Document Information
Document Revision: 1.0
Revision Date: June 01, 2024
Document State: Released
Company: Proceq SA
Ringstrasse 2
CH-8603 Schwerzenbach
Switzerland
Classification: Technical Manual
Revision History
Rev
Date
Author, Comments
1.0 June 01, 2024 HELG
7. June 2024 © Copyright 2024, PROCEQ SA 3
Content
1 Introduction ................................................................................................................... 6
1.1 Scope of this document ........................................................................................................6
1.2 Product versions ...................................................................................................................6
1.3 Product applications .............................................................................................................8
2 Scope of Delivery .......................................................................................................... 9
3 Measurement Principle ............................................................................................... 10
4 Sensor Overview ......................................................................................................... 11
4.1 Getting Started ................................................................................................................... 11
4.2 Buttons’ function ................................................................................................................ 11
4.2.1 Switch on/off ................................................................................................................ 11
4.2.2 Start/Stop measurement .............................................................................................. 12
4.2.3 Set marker ................................................................................................................... 13
4.3 Laser functions (GP8000 & GP8100) ................................................................................ 14
4.4 Flexible wheel mounting (GP8800) ................................................................................... 14
4.5 Multiline (GP8100) ............................................................................................................. 15
5 Software overview ....................................................................................................... 16
5.1 Line scan ........................................................................................................................... 16
5.2 Cross polarized line scan (GP8800) .................................................................................. 18
5.3 Superline scan (GP8100) .................................................................................................. 19
5.4 Area scan ........................................................................................................................... 19
5.4.1 Time slice view ............................................................................................................. 20
5.4.2 3D view ........................................................................................................................ 20
5.4.3 Augmented reality (AR)................................................................................................ 21
5.5 Tags & Live wire detection ................................................................................................ 21
5.6 Image processing .............................................................................................................. 22
5.6.1 Gain.............................................................................................................................. 22
5.6.2 Noise cancellation ........................................................................................................ 23
5.6.3 Background removal .................................................................................................... 24
5.6.4 Dielectric constant ........................................................................................................ 25
5.6.5 Adjustable Time window (GP8000) ............................................................................. 28
5.7 Display & preferences........................................................................................................ 29
5.7.1 Color setting ................................................................................................................. 29
5.7.2 Marking preference ...................................................................................................... 30
5.8 Logbook & Workspace....................................................................................................... 30
5.9 Data storage, reading, sharing & reporting ....................................................................... 31
6 Applications ................................................................................................................. 32
6.1 Concrete floor with joints ................................................................................................... 32
6.2 Concrete slab with post-tensioned beam .......................................................................... 33
6.3 Hollow core concrete slab ................................................................................................. 34
6.4 Concrete slab with corrosion ............................................................................................. 34
6.5 Post-tensioned concrete slab ............................................................................................ 35
7 Technical Specification ............................................................................................... 37

7. June 2024 © Copyright 2024, PROCEQ SA 4
Legal Notice
This document contains important information on the safety, use and maintenance of Proceq
products. Read through this document carefully before the first use of the instrument. Observe
the safety and warning notes in this documentation and on the product. This is a prerequisite
for safe working and trouble-free operation.
Symbols used
This icon signals important information, specifications, proper working procedure and to
avoid data loss, damage or destruction of the instrument.
This note signifies a warning about dangers to life and limb if the apparatus is handled
improperly. Observe these notes and be particularly careful in these cases. Also inform
other users on all safety notes. Besides the notes in this instruction manual the generally
applicable safety instructions and regulations for prevention of accidents must be
observed.
Limitation of use
The instrument is only to be used for its designated purpose as described herein.
Replace faulty components only with original replacement parts from Proceq.
Accessories should only be installed or connected to the instrument if they are
expressly authorized by Proceq. If other accessories are installed or connected to the
instrument then Proceq will accept no liability and the product guarantee is forfeited.
Liability
Our “General Terms and Conditions of Sales and Delivery” apply in all cases. Warranty and
liability claims arising from personal injury and damage to property cannot be upheld if they
are due to one or more of the following causes:
Failure to use the instrument in accordance with its designated use as described in the
product documentation.
Incorrect performance check for operation and maintenance of the instrument and its
components.
Failure to adhere to the instructions dealing with the performance check, operation and
maintenance of the instrument and its components.
Unauthorised modifications to the instrument and its components.
Serious damage resulting from the effects of foreign bodies, accidents, vandalism and
force majeure. All information contained in this documentation is presented in good
faith and believed to be correct. Proceq AG makes no warranties and excludes all
liability as to the completeness and/or accuracy of the information.
Safety Instructions
The equipment is not allowed to be operated by children or anyone under the influence of
alcohol, drugs or pharmaceutical preparations. Anyone who is not familiar with the instrument
must be supervised when using the equipment.
Reserved Rights
The content of this document is intellectual property of Proceq SA and prohibited to be copied
neither in a photomechanical or electronic way, nor in excerpts, saved and/or be passed on to
other persons and institutions. This document can be changed at any time and without any
prenotification or announcement.
Unauthorized modifications and changes of the product are not permitted.

7. June 2024 © Copyright 2024, PROCEQ SA 5
Damages during carriage
On receipt of the goods, check for any visible damages on the packaging. If it is undamaged
you may sign the receipt of the goods. If you do suspect by visual inspection that damage has
occurred, make a note of the visible damage on the delivery receipt and request the courier to
countersign it. Moreover, the courier service must be held responsible for the damage in
writing.
If a hidden damage is discovered while unpacking, you have to inform and hold the courier
liable immediately in the following way: “When opening the parcel we had to notice that … etc.“
This superficial checking of the goods has to be done within the time limit set by the carrier,
which is normally 7 days. However, the period could vary depending on the courier. Hence, it
is recommended to check the exact time limit when receiving the goods.
If there are any damages also inform your authorized Proceq agent or Proceq SA immediately.
Shipment
Should the device be transported again, it must be packaged properly. Preferably use the
original packaging for later shipments. Additionally, use filling material in the package to protect
the device from any shock during carriage.
Safety notes and hints
All maintenance and repair work which is not explicitly permitted and described in the
present manual shall only be carried out by Proceq SA or your authorized service center,
failure to comply voids warranty.
Proceq SA refuses all warranty and liability claims for damages caused by usage of the
product in combination with non-original accessories, or accessories from 3
rd
party
suppliers.
Never immerse the device in water or other liquids: Danger of short circuit!
Never leave the product under direct sun exposure. Always store the product in its
carrying case.
For the operation of the product all local safety regulations apply.
7. June 2024 © Copyright 2024, PROCEQ SA 6
1 Introduction
The Proceq GPR family are high quality handheld ground penetrating radar (GPR) instruments
used to detect various objects in concrete structures such as rebar, post-tensioning duct, pipes,
voids & conduits.
The Proceq GPR family offers 3 powerful versions for all application needs:
GP8000
GP8800
GP8100
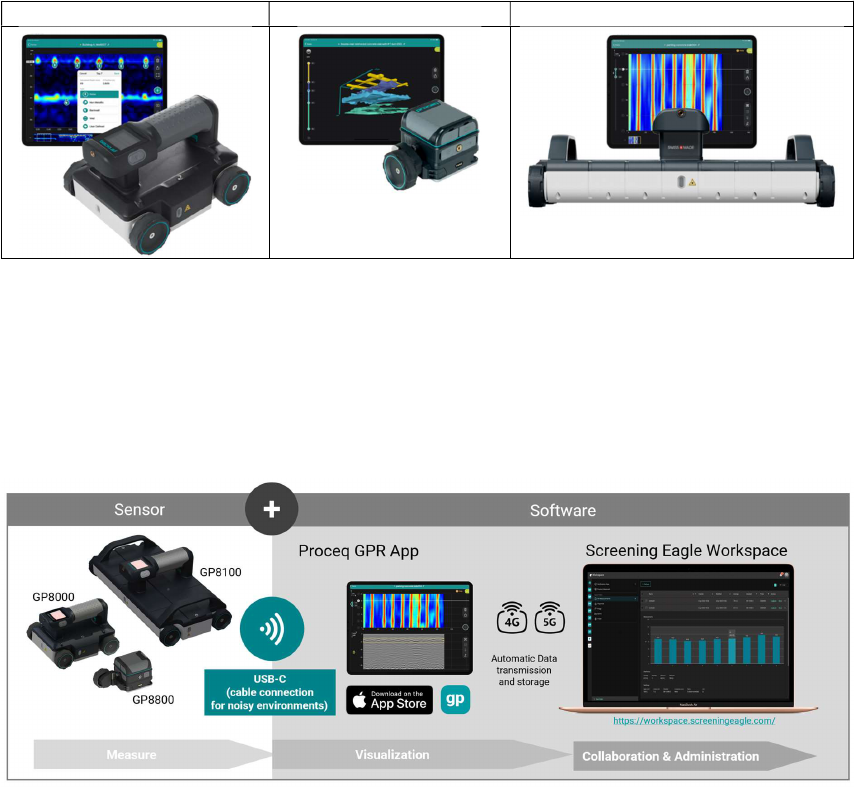
The product consists of
The GP8000 or GP8800 or GP8100 high-performance sensor
the GP iOS app
and the Screening Eagle Workspace platform.
Figure 1: Proceq GPR System
1.1 Scope of this document
This document is the user manual for all products of the Proceq GPR Product family.
Therefore, some pictures or functional descriptions may differ from your model.
1.2 Product versions
To be able to use the functionality of the GP app, a software license is required. The following
licenses are available and offer different functionality.

7. June 2024 © Copyright 2024, PROCEQ SA 7
Please refer to the table below for the supported features of the respective licenses:
GP8000 GP8800 GP8100
Sensor radar technology Stepped-frequency continuous-wave (SFCW) GPR
Antenna 1 1 (w. cross-polarization set)
6 (array)
Modulated frequency range
200 – 4000 MHz 400 – 6000 MHz 400 – 4000 MHz
Penetration depth
1
150 cm / 60 in 65 cm / 26 in 80 cm / 32 in
Measurement Modes Line Scan
Area Scan
Line Scan
Area Scan
Superline Scan
Line Scan
Area Scan
View modes A-scan (incl. envelope)
Non-migrated view
Migrated heatmap view
Time-slice view
3D view
Augmented Reality (AR)
Live Wire
A-scan (incl. envelope)
Non-migrated view
Migrated heatmap view
Time-slice view
3D view
Augmented Reality (AR)
A-scan (incl. envelope)
Non-migrated view
Migrated heatmap view
Split view
Unidirectional time-slice view
Time-slice view
3D view
Augmented Reality (AR)
Live Wire
Image processing Auto-gain
Linear Gain
Time Gain Compensation
Noise Cancellation
Background removal
Depth/Time window
Dielectric constant
Live Wire Threshold level
Markers, annotations
Auto-gain
Linear Gain
Time Gain Compensation
Noise Cancellation
Background removal
Dielectric constant
Markers, annotations
Auto-gain
Linear Gain
Time Gain Compensation
Noise Cancellation
Background removal
Dielectric constant
Live Wire Threshold level
Markers, annotations
Logbook Measurements data,
Instrument Information,
Pictures, Geolocation, text
notes, audio notes,
configuration log
Measurements data,
Instrument Information,
Pictures, Geolocation, text
notes, audio notes,
configuration log
Measurements data,
Instrument Information,
Pictures, Geolocation, text
notes, audio notes,
configuration log
Data Sharing URL exchange URL exchange URL exchange
Data Exporting CSV
HTML
JPG (Snapshot)
SEGY
CSV
HTML
JPG (Snapshot)
SEGY
CSV
HTML
JPG (Snapshot)
SEGY
Data Synchronization Screening Eagle
Workspace
Screening Eagle Inspect
Integration
Screening Eagle
Workspace
Screening Eagle Inspect
integration
Screening Eagle
Workspace
Screening Eagle Inspect
integration
1
For dielectric constant concrete (permittivity) = 7

7. June 2024 © Copyright 2024, PROCEQ SA 8
1.3 Product applications
Each sensor is suitable for different applications & conditions as described in Figure 2
Figure 2: Proceq GPR applications

7. June 2024 © Copyright 2024, PROCEQ SA 9
2 Scope of Delivery
Please refer to the Quick Start Guide provided in the standard delivery and available in
download section of the product webpage:
SET-GP8X00-QSG-200x140-240408-digital.pdf (screeningeagle.com)
7. June 2024 © Copyright 2024, PROCEQ SA 10
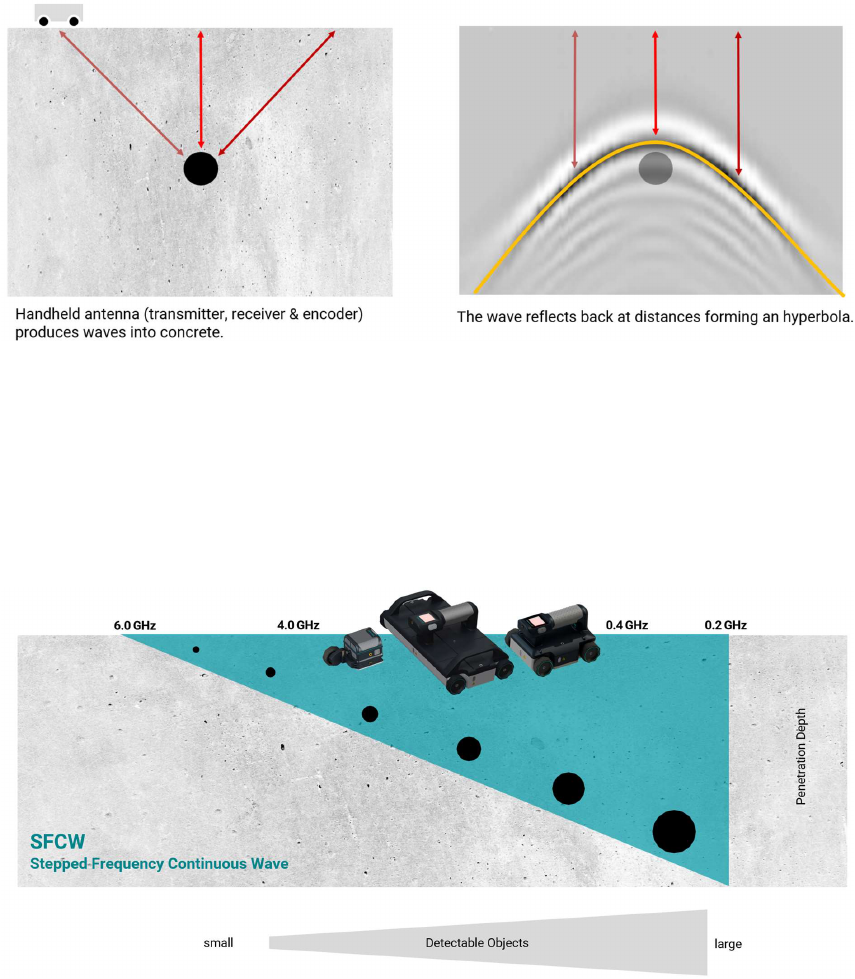
3 Measurement Principle
GPR is the acronym for Ground Penetrating Radar, also known as Georadar, Ground
Penetration Radar, or Ground Probing Radar. Proceq GPR is a compact device that scans the
subsurface in a non-destructive way. It can penetrate the surface, based on concrete
conditions and antenna characteristics.
Figure 3: Measurement principle
Proceq GPR devices use stepped-frequency-continuous-wave (SFCW) technology. Unlike
pulsed-GPR broadcasting a signal centered around one frequency, resulting in a trade-off
between resolution and depth for inspecting, SFCW has the advantage to broadcast an ultra
wide-band range of modulated frequencies. The combination of all frequency response
enables detection of objects from shallow to deep in one scan.
Figure 4: Stepped-Frequency-Continuous-Wave principle

7. June 2024 © Copyright 2024, PROCEQ SA 11
4 Sensor Overview
4.1 Getting Started
Please refer to the Quick Start Guide (included in standard delivery) for first steps with your
GP8000, GP8800 or GP8100. The Quick Start Guide is also available in the download section
of the product webpage:
SET-GP8X00-QSG-200x140-240408-digital.pdf (screeningeagle.com)
4.2 Buttons’ function
4.2.1 Switch on/off
For GP8000 & GP8100:
- Turn on: long press 1 second the switch on/off button on the back (see Figure 5)
- Turn off: long press 1 second the switch on/off button on the back (see Figure 5)
Figure 5: GP8000 & GP8100 Switch on/off button
For GP8800:
- Turn on: long press 1 second one of the two buttons on each side (see Figure 6)
- Turn off: long press 4 seconds one of the two buttons on each side (see Figure 6)
Figure 6: GP8800 Buttons on each side

7. June 2024 © Copyright 2024, PROCEQ SA 12
4.2.2 Start/Stop measurement
Start/Stop measurement can be also implemented from the software GP iOS app,
downloadable from iOS App store. For more information, please watch tutorial videos
available in GP app or YouTube (Screening Eagle Technologies channel).
For GP8000 & GP8100
There are two ways to start/stop measurements:
- Start/stop: short press one of the two buttons on the handle (see Figure 7).
Figure 7: GP8000 & GP8100 Action buttons on each side
- Start/stop: short press touchscreen following Figure 8
Figure 8 : GP8000 & GP8100 Touchscreen functions

7. June 2024 © Copyright 2024, PROCEQ SA 13
For GP8800
Start/stop: short press one of the two buttons on each side (see Figure 9).
Figure 9: GP8800 Buttons on each side
4.2.3 Set marker
Marking digitally identified objects on the iPad screen can be also implemented from the
software GP iOS app. For more information, please watch tutorial videos available in GP
app or YouTube (Screening Eagle Technologies channel).
For GP8000 & GP8100
By default, “backward marking mode” is activated:
- IF device position is at front line, short press one button on side or touchscreen THEN
STOP
- IF device is in back position, short press one button on side or touchscreen THEN
MARK
When selected by the user, “forward marking mode”:
- IF device position is at front line, short press one button on side or touchscreen THEN
MARK
- IF device is at any position and user double-pushes one button on side or touchscreen
THEN STOP
For GP8800
By default, “backward marking mode” is activated:
- IF device position is at front line, short press one button on side THEN STOP
- IF device is in back position, short press one button on side THEN MARK

7. June 2024 © Copyright 2024, PROCEQ SA 14
When selected by the user, “forward marking mode”:
- IF device position is at front line, short press one button on side THEN MARK
- IF device is at any position and user double-pushes one button on side THEN STOP
4.3 Laser functions (GP8000 & GP8100)
The GP8000 & GP8100 are equipped with a laser to indicate the scan direction & the
measurement center point.
Figure 10: GP8000 & GP8100 Laser
4.4 Flexible wheel mounting (GP8800)
The GP8800 single encoder wheel can be mounted for different purposes:
- To adapt to scanning conditions (ex: congested space).
- To turn the antenna at 90°in cross-polarization mode (see section 5.2)
Figure 11 : GP8800 flexible wheel mounting

7. June 2024 © Copyright 2024, PROCEQ SA 15
4.5 Multiline (GP8100)
The GP8100 is a GPR array scanner. This means the device scans 6 lines (A, B, C, D, E, F)
in only one scan called Superline scan (see section 5.3). It is equipped with a LED to facilitate
data visualization on the iPad display when the user wishes to focus on one line scan view.
Figure 12: GP8100 array - 6 lines scan

7. June 2024 © Copyright 2024, PROCEQ SA 16
5 Software overview
The GP app software enables visualization of any scan measurement such as line scan & area
scan views with manual zoom. In addition, there is a logbook providing traceability of each
measurement: time, operator, position and instrument information, pictures (with iPad camera)
and written or voice notes.
Given mobile data connectivity (Wifi or mobile network), the GP app automatically and safely
stores all measurements on the Screening Eagle Workspace by synchronizing with the iPad.
Reporting can be done from the Screening Eagle Workspace or the app.
All measurements, settings and image processing tasks are described in tutorial videos
available in GP app or YouTube (Screening Eagle Technologies channel).
Swipe vertically up or down with 2 fingers for navigating between views. Menu is always
accessible on the right.
The slider defining slice thickness & depth is always accessible on the left for time slice
& 3D views with color palette.
5.1 Line scan
The antenna (transmitter & receiver) above the concrete produces a trace called A-scan based
on the wave trajectory across air, concrete and reflection on objects, every material has
different properties characterized by the dielectric permittivity ε. The reflection is strong on
metallic objects (99% of the wave is reflected). The amplitude of A-scan (generally negative
for metallic objects, positive for non-metallic objects) indicates the change of material and
therefore location of objects at the peak of the amplitude.
When the antenna moves, multiple A-scans are collected along the scan to produce a B-scan
radargram view. The colorful migrated view is a more intuitive way view to identify objects; it
is produced from a processing radargram.
Figure 13 : A-scan, B-scan & migrated views principles

7. June 2024 © Copyright 2024, PROCEQ SA 17
GP app software provides a line scan measurement view with A-scan on the left, radargram
view & migrated view in the center and drop-down menu on the right.
Figure 14: GP app software line scan raw data view
Single finger swipe left-right to display or not the A-scan
Figure 15 : GP app software line scan migrated view

7. June 2024 © Copyright 2024, PROCEQ SA 18
5.2 Cross polarized line scan (GP8800)
By aligning the receiver and the transmitter, which means rotating the antenna with a 90° angle,
the detection of deeper objects shadowed by upper shallow objects (especially longitudinal
targets such as ramping pipes or ducts) becomes easier as explained in Figure 16.
Figure 16: Cross polarization principle
The GP8800 is equipped with an antenna with the ability to be cross-polarized changing the
orientation (90° rotation as per Figure 17) and the encoder wheel mounting (see Figure 11).
The cross-polarized line scan may unveil the presence of deeper/hidden objects.
Figure 17: GP8800 Cross polarization setting

7. June 2024 © Copyright 2024, PROCEQ SA 19
5.3 Superline scan (GP8100)
As explained in section 4.5, the GP8100 array has 6 antennas enabling the measurement of 6
lines scan at the same time. The plan view generated from 6 lines is called Superline scan.
The superline scan (see Figure 18) generates a time slice view of all objects perpendicular to
the scanning direction. The user can adjust the slice thickness and obtain a dynamic plan view
from top to bottom by moving the left slider. Any line scan view can be chosen in the split view.
Figure 18: GP8100 Superline scan
5.4 Area scan
An area scan, also called C-scan, can be generated from the combination of different line
scans in each direction (X & Y) as described in Figure 19.
Figure 19: Area scan, 3D view & time slice view principle
7. June 2024 © Copyright 2024, PROCEQ SA 20
GP app software provides an area scan measurement view (see Figure 20).
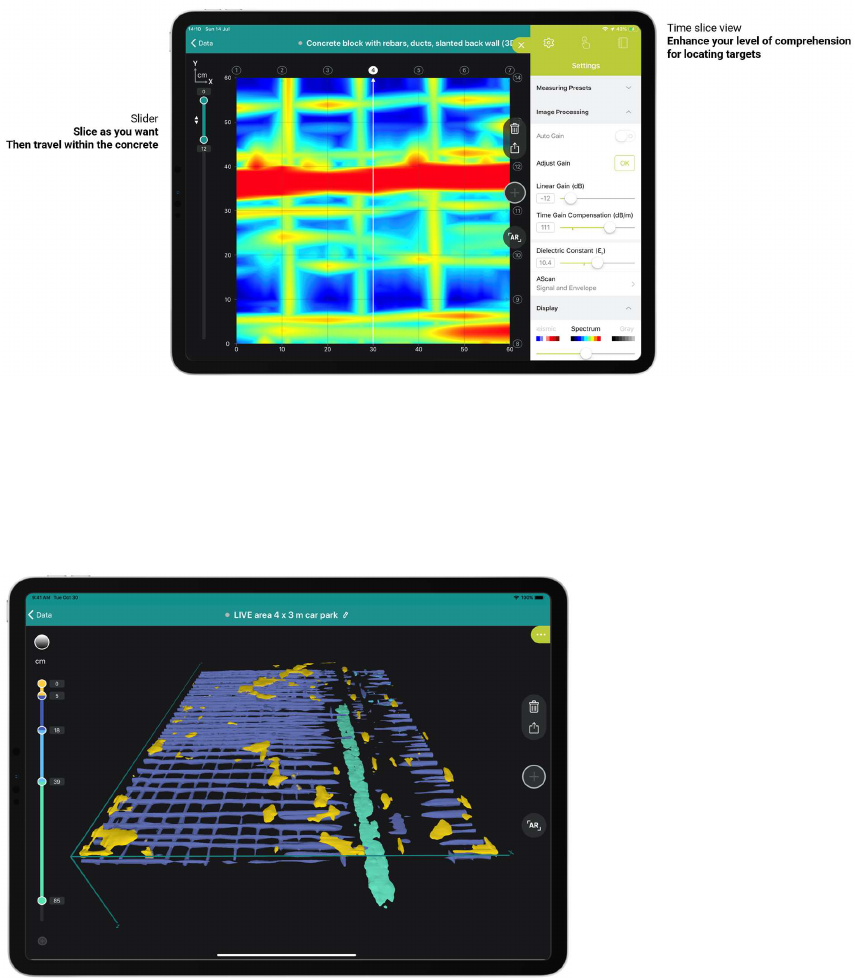
5.4.1 Time slice view
GP app software produces a time slice view (as shown in Figure 20) enhancing the level of
comprehension for locating targets. The user can adjust the slice thickness and obtain a
dynamic plan view from top to bottom by moving the left slider.
Figure 20: GP app software area scan & time slice view
5.4.2 3D view
GP app software produces a 3D view improving the level of comprehension for locating
targets. The user can adjust the color for each depth intervals differentiating objects by moving
the left slider.
Figure 21: GP app software 3D view

7. June 2024 © Copyright 2024, PROCEQ SA 21
5.4.3 Augmented reality (AR)
gp app software produces an Augmented reality (AR) view of time slice view & 3D views.
Screenshots of AR view help to enrich reporting.
Figure 22: GP app software Augmented Reality view
Swipe right/left to increase or decrease the time slice view transparency.
Swipe up/down with 2 fingers for switching between 3D view and time slice view
Swipe up/down with 1 finger to move up/down the 3D view
5.5 Tags & Live wire detection
The Tag menu on the right enables the user to tag identified targets such as rebar, live wire,
void, backwall or defined objects (like post-tension ducts).
GP8000 & GP8100 provide live wire detection (on top of the screen) based on signal strength
color intensity that can be adjusted in image processing settings.

7. June 2024 © Copyright 2024, PROCEQ SA 22
Figure 23: GP app software Tags & Live wire detection
5.6 Image processing
The Settings menu offers a unique wide range of image processing significantly improving the
data quality and the clarity of different views.
5.6.1 Gain
Due to GPR energy attenuation in concrete, some objects may appear weak or invisible. By
increasing energy through gain, the image can be improved with targets being more visible.
Figure 24: GPR ground wave's energy attenuation
GP app software provides in image processing dropdown menu an automatic gain called
“Auto-Gain” which automatically adjusts the gain and amplifies the signal to improve the image
quality. However, it is possible to adjust manually the gain with “Linear Gain” & “Time Gain
Compensation” settings.

7. June 2024 © Copyright 2024, PROCEQ SA 23
Figure 25: GP app software image processing auto-gain or manual gain adjustment
5.6.2 Noise cancellation
Interfering noise from close electronics devices, Wi-Fi routers or smartphones may affect the
data quality with “typical scare pattern” appearing on measurement views.
Figure 26: Noise affecting GPR object detection
GP app software provides in image processing dropdown menu: the “Noise Cancellation”
setting which, when activated, noise cancellation removes noise and improves data clarity
(Figure 27).

7. June 2024 © Copyright 2024, PROCEQ SA 24
Figure 27: GP app software image processing noise cancellation
5.6.3 Background removal
In some circumstances, GPR waves from the transmitter are received by the receiver without
penetrating the concrete. This creates a disturbance called “background” (visual longitudinal
strip) which affects the data quality and may hide shallow targets.
Figure 28: Background affecting GPR object detection
GP app software provides in image processing dropdown menu: the “Background Removal”
setting which, when activated, removes the background, and makes shallow objects easier to
see such as rebar as shown in Figure 29.

7. June 2024 © Copyright 2024, PROCEQ SA 25
Figure 29: GP app software image processing background removal
Use with caution, background removal may remove desired targets.
When first viewing a GPR radargram (B Scan), it is advisable to set background removal
to zero so as not to remove legitimate linear features from the data.
Figure 30: Background removal warning on longitudinal objects
5.6.4 Dielectric constant
The concrete material characterized by the dielectric ε (permittivity) influences hugely the
measurement.
- When concrete is dry (ε<5), GPR waves are less attenuated and can penetrate deeper
resulting in more prominent signals/hyperbolas.
- When concrete is wet (ε>9), GPR waves are heavily attenuated by the presence of
water resulting in less prominent signals/hyperbolas.
The standard concrete usually has a dielectric (ε) between 6.5 and 7.5.

7. June 2024 © Copyright 2024, PROCEQ SA 26
The dielectric constant of concrete can vary widely not only due to moisture content, but also
factors such as the composition of the concrete mix, types of aggregates and the presence of
air voids. This is why it is critical to set ε when considering depth and objects’ size accuracy.
Figure 31: Concrete dielectric ε principle
GP app software provides different solutions to adjust the concrete dielectric.
5.6.4.1 Manual setting of dielectric value
When the concrete dielectric (ε) is known, then the dielectric value can be entered
manually in the image processing menu (see Figure 32).
5.6.4.2 Hyperbola fitting dielectric estimation
When the concrete dielectric (ε) is unknown, then the dielectric can be estimated with
the “Hyperbola fitting” feature. By adjusting the dielectric value in image processing
menu, the user must fit the new appearing yellow hyperbola on any clean hyperbola of
existing object in the raw data view (B-scan) as shown in Figure 32.
Make sure the yellow hyperbola precisely covers-up the object’s hyperbola. Try with
different clean hyperbolas to confirm the concrete dielectric estimation.

7. June 2024 © Copyright 2024, PROCEQ SA 27
Figure 32: GP app software image processing manual input or hyperbola fitting for estimation of Concrete dielectric ε
5.6.4.3 Tag object set depth dielectric calibration
When the concrete dielectric (ε) is unknown, but one object’s depth (such as rebar) is
precisely known from a cover meter or inspection hole then the dielectric can be
calibrated by setting the depth of the object using a tag in “tag setting input depth as
shown in Figure 33.
We recommend the use of cover meters such as Profometer PM8000 to precisely
estimate the depth of rebar in shallow layers. Cover meter technology (eddy-current) is
not influenced by the concrete dielectric.
Figure 33: GP app software tag object set depth for calibration of concrete dielectric (ε)

7. June 2024 © Copyright 2024, PROCEQ SA 28
5.6.5 Adjustable Time window (GP8000)
The time window is the time that the antenna’s receiver spends for listening the GPR signals
coming back from objects/reflectors in the concrete, as shown in Figure 34. Most handheld
antennas have a fixed time window which does not allow for receiving deeper signals (provided
an adequate range of low frequencies) or focusing on shallow layers.
Figure 34: Time window principle
GP app software (only with GP8000) provides in the image processing dropdown menu: the
“depth/time window” setting. By adjusting the time window from 10 ns (shallow) to 24 ns
(deep), the user can either focus on shallow objects or extend the depth to the maximum
(150cm / 60in penetration depth for standard concrete).
Figure 35: GP app software image processing adjustable time window

7. June 2024 © Copyright 2024, PROCEQ SA 29
5.7 Display & preferences
5.7.1 Color setting
Display in dropdown menu provides a wide range of color settings for the different views.
Figure 36: GP app software color display setting
By default, GP software raw data view is in “Black-white” color code. This means, where
the A-scan amplitude is negative (typically a metal target in concrete), the B-scan
generates a main centred black color at the rebar position. Conversely, where the A-
scan amplitude is positive in concrete (typically air or plastic) the B-scan generates a
main centred white color. However, be aware that the opposite is “White-black” color
code setting!
Raw data view
(B-scan)
Color display
setting
Metal or water target in concrete
A-scan with negative amplitude
From Concrete to Metal or water
Plastic or air target in concrete
A-scan with positive amplitude
From Concrete to Plastic or air
Black-white
(by default)
white-BLACK-white hyperbola
black-WHITE-black hyperbola
White-black
black
-
WHITE
-
black hyperbola
white
-
BLACK
-
white hyperbola

7. June 2024 © Copyright 2024, PROCEQ SA 30
5.7.2 Marking preference
GP software proposes two alternatives for setting markers in “Marking with Probe Button”
setting in drop down menu.
- Back Mark : Marking by scanning backward
- Forward Mark: Marking by scanning forward
Read section 4.2.3 to know marking button functionality.
Figure 37: GP app software Marking with Probe button setting
5.8 Logbook & Workspace
GP app software provides a logbook in dropdown menu that collects automatically the following
meta-data (see Figure 38):
- Sensor serial-number
- Software licence owner
- Geolocation
- Measurement setting changes
The user can also add the following information:
- Pictures of the site
- Relevant snap shot
- Text & voice notes

7. June 2024 © Copyright 2024, PROCEQ SA 31
Figure 38: GP app software logbook
5.9 Data storage, reading, sharing & reporting
Screening Eagle Workspace is an online platform where all measurements are stored
automatically as soon as there is data connectivity (Wifi or mobile network) allowing
synchronization of the iPad. Reading and reporting (pdf printing of tab) is possible from
anywhere at any time. The tabs provide all the screenshot views & logbook information.
Sharing from workspace is possible with different formats such as SEGY or JPG.
Figure 39: Screening Eagle Workspace

7. June 2024 © Copyright 2024, PROCEQ SA 32
6 Applications
The different scan views provided in this section are for information & educational
purposes only.
gp software is a powerful visualisation and image processing tool for easing the data
interpretation. However, the data interpretation remains the responsibility of the user.
6.1 Concrete floor with joints
Measurement Mode: Line scan, perpendicularly to rebar & joints
The raw data and migrated views can locate and verify the irregular depth of top rebar
and the position of different construction joints.
Figure 40: GP app software migrated view concrete floor with joints application

7. June 2024 © Copyright 2024, PROCEQ SA 33
Figure 41: GP app software migrated view concrete floor with joints application.
6.2 Concrete slab with post-tensioned beam
Measurement Mode: Line scan with tags, perpendicular to beams
The raw data view shows top rebar and the PT beam bearing the slab.
Figure 42: GP app software raw data view concrete slab with PT beam application

7. June 2024 © Copyright 2024, PROCEQ SA 34
6.3 Hollow core concrete slab
Measurement Mode: Line scan with annotations, perpendicular to longitudinal hollow cores
The raw data view indicates the presence of hollow cores filled with air; the hyperbolas in black-
WHITE-black suggests the presence of air in concrete (as explained in section 5.7).
Note that prestressed cable reflection inverts as the wave travels through air.
Figure 43: GP app software raw data view hollow core concrete slab application
6.4 Concrete slab with corrosion
Measurement Mode: Line scan with annotations, perpendicularly to top rebar
The raw data view indicates the presence of clean good signal targets but also low signal
targets (see Figure 44). This can indicate the presence of corroded rebar.
Corroded rebar dissipates GPR waves and returns less energy than healthy steel rebar.
Proceq GPR helps to find out the potential presence of corroded rebar, however it is
strongly recommended to use other tools & sensors such as GPR Insights post
processing software or half-cell potential technology (Profometer PM8500) to strengthen
the analysis. In any case, an inspection hole is necessary to confirm the presence of
corrosion.

7. June 2024 © Copyright 2024, PROCEQ SA 35
Figure 44: GP app software raw data view concrete corrosion application
6.5 Post-tensioned concrete slab
Measurement Mode: Area scan
The time slice view reveals at a certain depth all the PT duct layout and few rebar.
The B-scan and superline scan in split view confirm the presence of the PT ducts underneath
the rebar.

7. June 2024 © Copyright 2024, PROCEQ SA 36
Figure 45: GP app software area scan PT concrete slab application
Figure 46: GP app software raw data view PT concrete slab application

7. June 2024 © Copyright 2024, PROCEQ SA 37
7 Technical Specification
Measurement Principle
Stepped-frequency continuous-wave (SFCW) GPR
Regulations compliance CE, IC, FCC, UKCA and RoHS
Connection
Wi-Fi (802.11n) to display unit
USB-C for Wi-Fi restricted areas (GP8100 & GP8800)
Warranty 2 years
Operating Temperature 5°C to 40°C / 40°F to 105°F
Storage Temperature -10°C to +60°C / 15°F to 140°F
Relative humidity
up to 85 %, non condensing
Protection against water
and dust
IP 54
Depth accuracy ± 5 mm / 0.2 in (upon direct dielectric calibration!)
Distance accuracy
Distance accuracy
between objects (like
rebars)
<2% error on distance
GP8000 or GP8100: 4 cm / 1.6 in
GP8800: 3cm / 1.2 in
Note: for objects' depth at 5 cm / 2 in

7. June 2024 © Copyright 2024, PROCEQ SA 38
The English version of the content remains the official version. All translated content should
bear an appropriate notice to this effect.
For safety and liability information, please download at
www.screeningeagle.com/safety-and-liability
Subject to change. Copyright © 2023 by Proceq SA, Schwerzenbach. All rights reserved.
7. June 2024 © Copyright 2024, PROCEQ SA 39
HQ - SWITZERLAND
Ringstrasse 2
CH-8603 Schwerzenbach
Switzerland
+41 43 355 38 00
EUROPE
Screening Eagle UK Limited
Bedford i-lab,
Priory Business Park, Stannard Way,
Bedford
MK44 3RZ
United Kingdom
T +44 12 3483 4645
USA, CANADA & CENTRAL AMERICA
Screening Eagle USA Inc.
117 Corporation Drive
Aliquippa, PA 15001
United States
T +1 724 512 0330
SOUTH AMERICA
Proceq SAO Equipamentos de Mediçao Ltda.
Rua Paes Leme 136
Pinheiros,
Sao Paulo SP 05424-010
Brasil
T +55 11 3083 3889
MIDDLE EAST
Sharjah Airport
International Free Zone
P.O.Box: 8365
United Arab Emirates
T +971 6 5578505
ASIA - PACIFIC
Screening Eagle Singapore Pte. Ltd.
1 Fusionopolis Way
Connexis South Tower #20-03
Singapore 138632
T +65 6382 3966
CHINA
Proceq Trading Shanghai Co.,
Limited Room 701, 7th Floor,
Golden Block 407-1
Yishan Road,
Xuhui District
200032 Shanghai | China
T +86 21 6317 7479
