
DOT HS 812 555 August 2018
Human Factors Design
Guidance for Level 2
And Level 3
Automated Driving
Concepts
DISCLAIMER
This publication is distributed by the U.S. Department of Transportation, National
Highway Traffic Safety Administration, in the interest of information exchange. The
opinions, findings and conclusions expressed in this publication are those of the
authors and not necessarily those of the Department of Transportation or the
National Highway Traffic Safety Administration. The United States Government
assumes no liability for its content or use thereof. If trade or manufacturers’ names
or products are mentioned, it is because they are considered essential to the object
of the publication and should not be construed as an endorsement. The United States
Government does not endorse products or manufacturers.
Suggested APA Format Citation:
Campbell, J. L., Brown, J. L., Graving, J. S., Richard, C. M., Lichty, M. G., Bacon, L. P., … & Sanquist,
T. (2018, August). Human factors
design guidance for level 2 and level 3 automated driving
concepts (Report No. DOT HS 812 555). Washington, DC: National Highway Traffic Safety
Administration.

i
REPORT DOCUMENTATION PAGE
Form Approved
OMB No. 0704-0188
1. AGENCY USE ONLY (Leave blank) 2. REPORT DATE
August 2018
3
.
R
EPORT TYPE AND DAT
ES
C
OVERED
4. TITLE AND SUBTITLE
Human Factors Design Guidance for Level 2 and Level 3 Automated Driving Concepts
5. FUNDING NUMBERS
Contract No. DTN22-11-00236/0011
6. AUTHORS
John L. Campbell, James L. Brown. Justin S. Graving, Christian M. Richard, Monica G.
Lichty, L. Paige Bacon, Justin F. Morgan, Hong Li, Diane N. Williams, Thomas Sanquist
7. PERFORMING ORGANIZATION NAME(S) AND ADDRESS
Battelle Memorial Institute
505 King Avenue
Columbus, Ohio 43201-2696
8. PERFORMING ORGANIZATION
R
EPORT NUMBER
9. SPONSORING/MONITORING AGENCY NAME AND ADDRESS
National Highway Traffic Safety Administration
1200 New Jersey Avenue SE.
Washington, DC 20590
10. SPONSORING/MONITORING
AGENCY REPORT NUMBER
DOT HS 812 555
11. SUPPLEMENTARY NOTES
Dr. Paul Rau was NHTSA’s Contracting Officer’s Representatives (COR) for this effort.
12a. DISTRIBUTION/AVAILABILITY STATEMENT
This document is available to the public from the National Technical Information Service,
www.ntis.gov.
12b. DISTRIBUTION CODE
13. ABSTRACT
High automation presents the opportunity to increase the safety, mobility, and efficiency of the existing road network, and has been
anticipated for decades. It was not, however, until the development of sophisticated sensing and computing systems that such vehicles
became technically feasible. Many automakers and Tier-1 suppliers are developing or testing vehicles with some form of automation.
In support of the motor vehicle automation effort, NHTSA is planning a automation driving system (ADS) research program in
coordination with other USDOT agencies with the goal of improving motor vehicle safety. Driver vehicle interface (DVI) design
guidance has been developed as part of a larger research effort intended to perform an initial human factors assessment of driver
performance and behavior under Level 2 and Level 3 automated driving. Safe and efficient operation of any motor vehicle requires
that the DVI be designed in a manner consistent with driver limitations, capabilities, and expectations. This document is intended to
assist DVI developers achieve these outcomes.
14. SUBJECT TERMS
Automation, Automated Driving Concepts, Levels of Automation, Driver Vehicle Interface, DVI,
Driver Performance
15. NUMBER OF PAGES
127
16. PRICE CODE
17. SECURITY CLASSIFICATION OF
REPORT
Unclassified
18. SECURITY CLASSIFICATION OF
THIS PAGE
Unclassified
19. SECURITY
CLASSIFICATION
OF ABSTRACT
20. LIM
ITATION OF
ABSTRACT
ii
Table of Contents
Chapter 1. Introduction ............................................................................................................. 1
Background ............................................................................................................................ 1
Overview of Automation ......................................................................................................... 2
Automation in Vehicles ........................................................................................................... 4
General Design Issues for Automated Driving Systems ........................................................ 6
Current and Future Directions of Vehicle Automation ............................................................ 8
Current Best Practices ......................................................................................................... 10
Driving Automation Research and Design Guidance Development ..................................... 12
Scope of this Document ....................................................................................................... 13
Limitations of This Document ............................................................................................... 13
Organization of This Document ............................................................................................ 13
Chapter 2. How to Use This Document ................................................................................. 15
Two-Section Format ............................................................................................................. 15
The First Section .................................................................................................................. 15
The Second Section ............................................................................................................. 16
Selection of Font Sizes in This Document ............................................................................ 17
Chapter 3. General DVI Design Guidance for Level 2 and Level 3 Automation ................. 18
Current Automation Mode and Status .................................................................................. 18
Suitable Display Properties for Automation Mode and Status Messages ............................ 21
Communicating Transfer of Control From Driver to System ................................................ 24
Communicating Transfer of Control From System to Driver ................................................ 27
Developing and Maintaining Driver Mental Models .............................................................. 30
Special Considerations for Level 2 and Level 3 Automation ................................................ 33
Developing Driver Training Material for Automated Driving System Applications ................ 35
Incorporating Etiquette Into the Design of Automated Systems ........................................... 38
Chapter 4. Message Characteristics ...................................................................................... 40
Designing Messages for Driver Comprehension .................................................................. 41
Message Complexity ............................................................................................................ 43
Selection of Sensory Modality .............................................................................................. 45
Multimodal Messages ........................................................................................................... 47
Chapter 5. Visual Interfaces ................................................................................................... 49
Locating a Visual Display ..................................................................................................... 50
Display Glare ........................................................................................................................ 51
Head-Up Displays ................................................................................................................ 54
Using Color ........................................................................................................................... 56
Selecting Character Height for Icons and Text ..................................................................... 58
Temporal Characteristics of Visual Displays ........................................................................ 60
iii
Chapter 6. Auditory Interfaces ............................................................................................... 62
Perceived Urgency of Auditory Warnings ............................................................................ 63
Perceived Annoyance of Auditory Warnings ........................................................................ 65
Loudness of Auditory Warning Signals ................................................................................ 67
Chapter 7. Haptic Interfaces .................................................................................................. 70
Selecting a Haptic Display ................................................................................................... 71
Improving Distinctiveness of Haptic Displays ...................................................................... 73
Accommodating for Vibrotactile Sensitivity Across the Body ............................................... 75
Generating a Detectable Signal in a Vibrotactile Seat ......................................................... 77
Chapter 8. Driver Inputs ......................................................................................................... 80
General Guidance for Driver-DVI Interactions ..................................................................... 81
Control Placement ............................................................................................................... 83
Voice Recognition Inputs ..................................................................................................... 85
Chapter 9. Glossary ................................................................................................................ 88
Chapter 10. Index ...................................................................................................................... 95
Chapter 11. Abbreviations ....................................................................................................... 97
Chapter 12. Equations .............................................................................................................. 99
Chapter 13. Relevant Documents From the United States Department of
Transportation, SAE International, and International Organization for
Standardization ....................................................................................................................... 101
Chapter 14. References .......................................................................................................... 108

1
Chapter 1. Introduction
Background
Motor vehicle automation can potentially improve highway safety by supporting or
supplementing the driver, thereby providing precise vehicle control during normal driving, and by
maintaining appropriate driver attention to traffic and roadway conditions. Although it is expected
that automated systems will not have universal capabilities in all traffic and environmental
conditions for some time to come, applications in motor vehicles will likely include a driving
experience of seamless transitions between automation and manual control of motion control
system functions in complex and rapidly changing conditions.
Higher levels of driving automation systems present the opportunity to greatly increase the safety,
mobility, and efficiency of the existing road network. Automated vehicles, however, have been
“coming soon” since the first half of the 20th century, when vehicles guided automatically along a
highway were described at the 1939 World’s Fair (O’Toole, 2009). It was not until the
development of sophisticated sensing and computing systems that such vehicles became
technically feasible. Prior large-scale efforts, such as the Federal Highway Administration
(FHWA) Automated Highway System (AHS) research, provided some information as to the
potential of automated systems. Yet it was not until newer explorations of ground vehicle
automation and highly-visible events such as the 2004 and 2005 Defense Advanced Research
Projects Administration (DARPA) Grand Challenge that the near-term potential of vehicle
automation became apparently to the broader community.
While some relevant research exists from AHS or adaptive cruise control (ACC) projects, current
and near-term implementations of driving automation have not been extensively researched.
Further, at the time of writing this document, a number of automakers and Tier-1 suppliers are
currently developing or testing vehicles with some form of automation. Thus, constructing
appropriate design guidance for automated driving requires, and must be partially based upon an,
understanding the broader field of human factors in automation and human-automation
interaction, as well as attempting to understand how automation is likely to be implemented in the
near-future.
In support of the motor vehicle automation effort, the National Highway Traffic Safety
Administration’s Office of Crash Avoidance and Electronics Systems Safety Research is planning
an automated systems research program in coordination with other USDOT agencies including
the Research and Innovative Technology Administration (RITA),
1
FHWA, Federal Motor Carrier
Safety Administration (FMCSA), and Federal Transit Administration (FTA). The goal of the
program is to improve motor vehicle safety by defining the requirements for automation in
driving that is: (1) functionally safe and electronically reliable; (2) operationally intuitive for
1
The Research and Innovative Technology Administration (RITA) was moved by Congress in 2014 to the Office of the Assistant
Secretary for Research and Technology (OST-R), a part of the Office of the Secretary of Transportation (OST), which is home to
all the program offices and statistics and research activities previously administered by RITA.
2
drivers under diverse driving conditions; (3) compatible with driver abilities and expectations; (4)
supportive of improving safety by reducing driver error; (5) operational only to the extent granted
by the driver and always deferent to the driver; and, (6) secure from malicious external control
and tampering. Addressing the human factors questions is central for accomplishing these goals.
A key element of vehicle automation is the driver-vehicle interface or DVI. The DVI refers to
vehicular displays that present information to the driver, and controls that facilitate the driver’s
control of the vehicle as a whole as well as the status of various vehicle components and
subsystems. Safe and efficient operation of any motor vehicle requires that the DVI be designed
in a manner that is consistent with driver limitations, capabilities, and expectations. This
document is intended to assist DVI developers to achieve these outcomes. This DVI design
guidance has been developed as part of a larger research effort—Human Factors Evaluation of
Level 2 and Level 3 Automated Driving Concepts—that is intended to perform an initial human
factors assessment of driver performance and behavior under Level 2 (L2) and Level 3 (L3)
automated driving.
Overview of Automation
Uses of Automation
Automation has been defined as a device or system that accomplishes (partially or fully) a
function that was previously or conceivably could be performed (partially or fully) by a human
operator (Parasuraman, Sheridan, & Wickens, 2000). Historically, the use of automation has been
found in process control and aviation but, today, examples of automation can be found as well in
non-industrial and personal uses. Automation in vehicles has the potential to help drivers who
choose to engage in distracting behaviors (e.g., text messaging while driving) or who are
experiencing a high level of workload by filling the gap between the driving demands and the
capabilities of the driver. While there are many automated systems in the vehicle (such as
automated driver assistance systems or safety systems that intervene in the absence of driver
responses to specific situations), for the purpose of this document automation is a system that
physically performs a specific combination of driving functions for the driver (e.g., maintain
headway and steer the vehicle in a lane during a traffic jam, choose and execute a route to a
chosen destination, or park the vehicle).
Philosophies of Automation
In developing a system that will include some degree of automation, system planners and
designers may begin by first determining which functions the automation will take over from the
driver and which functions the driver will continue to perform. Research in human-automation
interaction provides four general automation philosophies that provide a way to view, or in some
cases determine, this allocation of functions between the human and the automation:
• The “left-over” or residual function principle is the earliest automation philosophy. Under
this philosophy, the automation is designed to perform as many functions as possible, with
the remaining functions being allocated to be performed by the human. The rationale
behind this philosophy is that since the automation can be designed to perform functions
or tasks more quickly, reliably, and with fewer errors than a human, it should perform as

3
many of the tasks as possible. This philosophy proposes that only functions that can be
automated completely and will not suddenly require the intervention and support of a
human should be automated (Hollnagel & Bye, 2000).
• The compensatory principle, or “Fitts List” (Fitts, 1951), is a list or table of the strong and
weak features of humans and machines used as a basis for assigning functions and
responsibilities to the various system components. As shown in Table 1-1, the function
that humans are better at are the functions that would be assigned to the human to perform
and functions that machines are better at are those that would be assigned to the
automation to perform. Under this automation philosophy, humans are seen as mainly
responding to what happens around them and their actions are the result of processing
input information using whatever knowledge they may have (i.e., their mental models;
Hollnagel, 2004).
Table 1-1. Human and machine function allocation.
Humans are better at: Machines are better at:
• Detecting small amounts of visual or acoustic energy
• Perceiving patterns of light or sound
• Improvising and using flexible procedures
• Storing large amounts of information for long periods
of time and recalling relevant facts at the appropriate
time
• Reasoning inductively
• Exercising judgment
• Responding quickly to control signals and applying
great force smoothly and precisely
• Performing repetitive, routine tasks
• Storing information briefly and then erasing it
completely
• Reasoning deductively, including computational
ability
• Handling highly complex operations, i.e., doing
many different things at once
• Dynamic function allocation (as opposed to the static approaches above) is a
complementary approach that enables the human and automation to trade off which
functions each performs based on the current situation. Instead of focusing on what types
of functions the automation is better at performing and what types of functions the human
is better at performing, as seen with the Fitts List, the focus is now on how humans and
the automation can complement and support each other to achieve the overall purpose
(Grote, Weik, Wäfler, & Zӧlch, 1995; Wäfler, Grote, Windischer, & Ryser, 2003). This
approach aims to sustain and strengthen the human’s ability to perform efficiently by
focusing on the work system in the long term, including how routines and practices may
change because of learning and familiarization.
• Adaptive function allocation is an extension of the complementary approach which
assumes criteria to determine whether functions must be reallocated, how and when based
on changes in the operating environment, loads or demands to operators and performance
of operators (Inagaki, 2003). An automation system that operates under an adaptive
function allocation is called adaptive automation. Adaptive automation can be used to help
regulate workload by having the operator control a process during periods of moderate
workload and then hand-off control of particular tasks when workload either rises above
or falls below an optimal level (Hilburn, Molloy, Wong, & Parasuraman, 1993;
Parasuraman & Wickens, 2008). Adaptive automation can also assist in keeping the
operator in-the-loop by altering the level of automation being used. This information

4
should be used with caution, however, as frequent cycling between automated and manual
control may sometimes, but not always, cause a decrease in performance.
Automation in Vehicles
NHTSA’s Preliminary Statement of Policy Concerning Automated Vehicles (NHTSA, 2013)
provided an initial taxonomy of road vehicle automation that included five levels of automation.
Additionally, the Statement of Policy provided information on the developments in automated
driving at the time and an overview of NHTSA’s automated systems research program. The SAE
also defined a taxonomy (SAE J3016, 2014) that consists of six levels of automation, which was
adopted by NHTSA (described below in Table 1-2).
Table 1-2. Summary of SAE International driving automation levels.
2
Level and Name Description
Level 0 (L0)
No Driving Automation
The human driver does all the driving.
Level 1 (L1)
Driver Assistance
Vehicle is controlled by the driver, but some driving assist features may be included
that can assist the human driver with either steering or braking/accelerating, but not
both simultaneously.
Level 2 (L2)
Partial Driving
Automation
Vehicle has combined automated functions, like speed control and steering
simultaneously, but the driver must remain engaged with the driving task and monitor
the environment at all times.
Level 3 (L3)
Conditional Driving
Automation
An automated driving system on the vehicle can itself perform all aspects of the
driving task under some circumstances. Driver is still a necessity, but is not required
to monitor the environment when the system is engaged. The driver is expected to be
takeover-ready to take control of the vehicle at all times with notice.
Level 4 (L4)
High Driving
Automation
The vehicle can perform all driving functions under certain conditions. A user may
have the option to control the vehicle.
Level 5 (L5)
Full Driving Automation
The vehicle can perform all driving functions under all conditions. The human
occupants never need to be involved in the driving task.
The SAE International taxonomy is applicable to all implementations of driving automation, is
technology agnostic, and has some important distinctions, assumptions, and implications. From
these, functional distinctions and assumptions follow the associated role of the driver of the
vehicle at each level.
L2 vehicles are interesting as they may, in some implementations, utilize existing production
technologies, such as radar and machine vision technology, to provide robust automation. L3
vehicles may utilize these or a completely different set of technologies in support of automation.
2
As technically defined in SAE J3016.
5
From the average driver’s perspective, the actions of a highly-performing L2 system and any L3
system performing the same automated function may appear to be the same. The highway speed
automation in L2 or L3 controls the system by keeping the vehicle within its lane and controlling
the speed and headway to any leading vehicles. Ensuring the driver builds an appropriate mental
model, the driver is provided with information about the status of the automation, and is aware of
what the automation may or may not do while actively controlling the vehicle may yield
significant benefits. Yet there is a lack of published research examining how drivers form mental
models of different levels of vehicle automation, and how those mental models are applied (and
especially how mental models are applied between different levels of vehicle automation). While
research into driver performance with L2 and L3 systems is in a nascent stage, examining drivers’
interactions with different levels of automation may provide highly useful information for DVI
design guidance in such vehicles.
As the level of automation increases, the driving role shifts from the driver to the vehicle. Under
L2 automation, drivers are expected to serve as a monitor of automation as they are ultimately
trusted to ensure the safe operation of the vehicle. The SAE definition states that L2 automated
driving systems can release control with little or no advance warning. At higher levels of
automation, the vehicle starts assuming more aspects of the driving role while under automated
control. In contrast to L2, under L3 automation drivers are not expected to monitor the
environment when the system is engaged, but they are expected to be takeover-ready to take
control of the vehicle at all times with notice. Therefore, the L2 driver is expected to be alert and
monitoring the road continuously. The L3 driver is not expected to be paying attention to the road
at all times, but is expected to be takeover-ready with advance notice.
This is a unique situation in terms of the driver’s attention. The L2 driver has been relieved of the
control level of driving task, and potentially some of the maneuvering level (Michon, 1985).
Thus, the driver of the L2 vehicle has transitioned from the role of active driver to one of a
monitor of driving automation. Under L2 automation, the driver is expected to monitor the road,
the performance of the automation, and be ready to intervene if something functions incorrectly or
if asked to do so. In contrast, the L3 driver has transferred control, maneuvering, and perhaps
some of the strategic choices to the automation. The driver must be ready to resume control at any
time with advance notice in L3 automation. The L3 driver, largely relieved of the role of driving,
is not required to constantly monitor the vehicle or road status; the L3 driver is only asked to be
ready to intervene if warned in advance.
Note that the L2 driver is engaged in the monitoring task even as event rate and workload are
reduced to what may be described as a vigilance task (O’Hanlon & Kelley, 1977). While
monotonous driving over time has been identified with poorer performance in both laboratory
evaluations of driving and naturalistic evaluations of long-duration commercial vehicle driving
(Thiffault & Bergeron, 2003; Soccolich et al., 2013), it is currently unknown how drivers will
perform in terms of sustained attention under longer duration L2 or L3 automated driving. Related
to this, emerging research suggests that drivers, when relieved of actively controlling the vehicle,
may engage in a variety of non-driving tasks that can involve significant levels of distraction
(Llaneras, Salinger, & Green, 2013). Taken together, the potential for a vigilance-like state and
behaviors that would be termed distraction in manual driving provide the foundation for important
guidance on L2 and L3 automation DVIs. Understanding lessons learned in how to provide both
safety-critical and non-safety critical messages to operators who are either in a vigilance state or
6
involved in secondary (divided attention) tasks provides useful information for the designer of L2
and L3 automated system DVIs. The implication for design guidance is that, under L2 and L3
operations, automation-specific messages (and especially safety-critical messages) may need to be
provided in a distinctive and highly salient manner as the driver may not be currently monitoring
the forward roadway (Llaneras et al., 2013). Further research in this area is likely to provide
highly useful guidance and understanding best practices.
The definitions of L2 and L3 automated systems also have implications for the DVI in terms of
transfer times. The L2 system driver is expected to be able to take control with little to no advance
warning. The L3 system’s driver is expected to be able to take control with a sufficient and
comfortable transition time. The issue of advance-notice transfer time may be considered both in
terms of the active status of the road (the origin of the take control message) and of the driver’s
status (e.g., engaged in another task for the last 10 minutes). Perhaps more critical from a DVI
design standpoint is the “no advance warning situation” possible in L2 vehicles. L2 vehicles have
the potential to fail in such a manner that no advance warning is provided (a “silent failure”). One
such example of this would be that of a vehicle incorrectly following lane markings and
(intentionally) drifting onto the shoulder instead of continuing on the road. In this hypothetical
example, the inattentive driver would not be informed of this until the vehicle encountered the
infrastructure-based warning of the rumble strip. The issues surrounding no advance warning
transfers and how drivers sample the road in different levels of automated driving, as well as
transition times for both L2 and L3 automated systems, remains largely unexplored. The need for
research in this topic was acknowledged, however, and existing knowledge considered in the
design principle generation process. Some of the applicable lessons learned from the broader
human-automation interaction field are described in the following section.
General Design Issues for Automated Driving Systems
Due to the fact that automation has been used in a variety of domains, for decades in some cases,
a large body of research exists regarding what can be considered basic design issues when
developing automated systems. These issues are listed here.
• Trust in automation (Lee & Moray, 1994; Muir & Moray, 1996; Lee & See, 2004;
Rajaonah, Anceaux, & Vienne, 2006)
As vehicle automation is able to perform more functions for the driver, the driver’s
confidence in the automation’s ability to perform these functions and a willingness to rely
on information provided by the automated system becomes more important. For example,
if the automation system alerts the driver to a hazard, even when the hazard is not
immediately observable, the driver prepares to take the necessary action to prevent from
hitting or running over the hazard. In terms of L3 automation, in which the driver can cede
full control of all safety-related functions to the automation under certain traffic or
environmental conditions, the topic of trust in automation is particularly relevant due to
the fact that the automation is the primary source of ensuring safe operation of the vehicle.
• Misuse, disuse, and abuse of automation (Parasuraman & Riley, 1997)
Using automation when it should not be used, ignoring or turning off automated alarms or
safety systems due to reoccurring false alarms, or implementing automation without
7
regard for the consequences for human performance can affect a driver’s trust in the
automation system. Proper design of the automation system and appropriately calibrated
trust in the automation system may help support drivers’ appropriate use of the
automation. As higher levels of automation are implemented (L2 and L3), this is a
particularly relevant topic because the consequences to safety are higher as the driver is
less engaged in driving (in L2 automation) or is performing fewer safety-related functions
(in L3 automation).
• The out-of-the-loop problem (Endsley & Kiris, 1994; Stanton & Young, 1998; Seppelt &
Lee, 2007)
If a driver is not provided with the proper information about the automation, and
potentially road/traffic status, he or she may suffer from a diminished ability to detect
automation failures and to re-claim manual control of the vehicle if necessary. This is a
topic that is becoming more important as higher levels of automation (L2 and L3) are
implemented in vehicles and drivers are potentially able to perform non-driving related
tasks while in the vehicle. At these levels of automation, the automation is performing
nearly all, if not all, of the primary driving tasks, meaning that a driver could be so
involved in a non-driving related task (e.g., texting, checking e-mail, reading a book, etc.)
that he or she could completely miss a warning or message from the automation, possibly
leading to a crash or other incident.
• Failures in automation (Endsley & Kiris, 1994; Stanton & Young, 2000)
As automation systems have been implemented in various domains—including in
vehicles—the reliability of these systems has improved. Even with the most advanced
automation available, however, the reliability will never be perfect. Performance after a
failure may be better if the driver has a realistic understanding of the reliability of the
system, and the types of system failures that could potentially occur. In a scenario in
which the automation fails, there may be benefits if the driver could be alerted to the
failure with plenty of time to re-claim manual control of the vehicle from the automation.
As L2 and L3 automation are designed and implemented in vehicles, the status of the
automation and being alerted to a failure of the automation system may become even more
important due to the fact that a driver is unlikely to be in contact with either the steering
wheel or the pedals. This means that the sooner he or she can tell that the automation has
failed or is alerted to the fact that the automation as failed, the sooner he or she can
prepare to and ultimately re-claim manual control of the vehicle.
• Workload and the implementation of automation (Young & Stanton, 1997)
The implementation of automation is often expected to reduce driver workload, which
during periods of high workload can be helpful. However, underload—resulting from
fewer driving tasks—can also occur, potentially causing a driver to be become bored due
to the lack of tasks to perform. The prevention of the driver becoming bored or fatigued
due to underload is particularly relevant in terms of (primarily) L2 automation since the
reduction of driver-performed functions is great to begin with. Therefore, L2 automation
could be adaptive, meaning that there could be a balance between which functions the
driver was still performing and which functions the automation was now performing,
impacting the workload experienced by the driver.
8
• Clumsy automation (Wiener, 1989)
If the automation is designed to perform the easier task for the driver, leaving him or her
to perform the more challenging task, the result is clumsy automation. In terms of
workload, with this type of automation, the automation reduces the workload experienced
when it is already low and increases the workload experienced when it is already high.
This topic is important because if automation makes the driving situation more
challenging than it already is, it defeats the purpose of implementing automation. When
designing L2 automation, designers and systems planners could consider adaptive
automation to address this concern. As mentioned above, this may help keep the workload
experienced by the driver balanced and will potentially reduce the occurrence of clumsy
automation altogether.
• Mode awareness (Sarter & Woods, 1995)
When a driver is using a level of automation and fails to detect a change in the level of
automation, it is called a mode awareness failure, or automation surprise, e.g., when a
driver engages a lane centering system and then, for an unknown reason, the lane
centering system disengages. Without proper feedback, the driver may not know the lane
centering system is disengaged and might not take the necessary steps to re-claim manual
control of the vehicle and to correct or change the course of the vehicle. As the ability of
the automation to perform functions for the driver increases, the potential for the driver to
possibly engage in non-driving related activities also increases, making the process of
alerting the driver to any critical changes in automation mode more important.
Current and Future Directions of Vehicle Automation
Available Technology
Currently, L1 automation technologies are available in some, but not all, new light vehicles on the
market today and L2-type technologies are beginning to become available from different
manufacturers (NHTSA, 2013). L1 automation technologies are designed to assume a portion of
driving authority over a primary control (e.g., adaptive cruise control).
L2 technologies could allow the driver to physically (but not cognitively) disengage from the
driving task and assume the role of monitoring the road and vehicle performance. Some L2
technologies, such as ACC plus lane centering, are also available in new light vehicles on the
market.
L3 technologies allow the driver to cede both the monitoring and control role for the full driving
task to the automation under certain conditions but expect the driver to be takeover-ready when
the system may request it. An example of an L3 concept is traffic jam pilot, which allows drivers
to engage the automation and cease monitoring the road. As L2 technologies allow the driver to
physically disengage from the driving task, L3 technologies allow the driver to relegate full
control of the driving task to the vehicle. These L3 technologies, while experiencing varying
degrees of maturation while in development, are not currently available in the United States light
vehicle market, yet they are expected to be available in the near future.
9
L4 and L5 technologies, which are expected to only require the driver to input a destination while
the automation monitors the roadway and performs all safety-critical functions, do not yet exist
outside of advanced research concepts. L4 systems are constrained in a domain, and L5 systems
can operate without such limitations.
Role of the Driver
With the implementation of automation in the vehicle come changes in the role of the driver in the
driving task. When performing the driving task manually (under L0 or L1 automation), the driver
is actively participating in the task. The driver is completely responsible for control of the vehicle
and monitoring the roadway for safe operation of the vehicle. When a level of automation is
added, however, part of the task is taken over by the automation, leaving the driver to participate
in less of an active manner and more of a passive manner during normal operating conditions. For
example, under L1 automation the driver may still be responsible for steering the vehicle, but is
not responsible for maintaining a safe following distance behind the vehicle in front of him or her
when using ACC. Under L2 automation (extending the previous example to include both ACC
and lane centering) the driver is expected to monitor the performance of the vehicle continuously,
but the system may manage vehicle headway and lane position appropriately for extended period
of time without intervention from the driver.
Increased automation and the accompanying shift to a role of automation monitor presents the
potential for driver underload. Research from domains such as unmanned vehicles and control
systems has suggested that increased time in a monitoring role can lead to reduced performance
(Cummings, Mastracchio, Thornburg, & Mkrtchyan, 2013). It is unclear, however, whether this
can be extended to driving. As automation technologies improve and evolve, the role of the driver
in the driving task must be assessed and reassessed as changes continue.
Automation Transitions
As higher levels of automation are researched, designed, tested, and eventually implemented,
additional design considerations will need to be discussed. A main concern with near-term and
future levels of automation is the occurrence of planned and unplanned transitions between the
levels of automation and the impact that these transitions will have on the timing of delivering
information to the driver (e.g., much before the transition, near the occurrence of the transition),
the modality of delivering the information to the driver (e.g., for the auditory modality, a single
tone, a consistent tone, an auditory icon), and what specific information that will be
communicated to the driver (e.g., what function the automation was performing but is not now,
that the automation went from L3 to L1). To keep the driver in-the-loop as best as possible,
enabling him or her to re-claim manual control of the vehicle more quickly if necessary,
addressing the following questions may be of value: what information should drivers receive
about the transition in level of automation, when should drivers be alerted about the transition
between one level of automation and another level of automation, and how should drivers be
informed about the transition in level of automation? This is a particularly important topic due to
the fact that near-term in-vehicle automation (L2 and L3) will, at least in the beginning, likely
consist of short cycles between the different levels of automation, meaning a short duration of
time between engaging the automation and then returning to manual mode.
10
Short-cycles of automation can also be found in the aviation domain. In a study by Parasuraman,
Hilburn, Molloy, and Singh (1991), participants monitored three flight-related functions that
could be automated or performed manually, with a shift from manual to automatic control and
back occurring every 10 minutes during the 30-minute session. When the functions were
automated, participants were required to perform a supervisory control task of the automation.
Results from this study showed performance benefits in all three flight functions and no evidence
of costs for the three flight functions. Also, results showed that dynamic automation shifts when
transitioning between levels of automation benefitted the performance of the flight-related tasks,
without evidence of costs to performance following the return to manual control. While this can
be used as a starting point for thinking about short-cycle automation in vehicles, the results cannot
be generalized from aviation to surface vehicles without further research.
Maintenance of Driving Skills for Drivers
Another concern with the implementation of higher levels of automation (L2 and L3) is the
degradation of some driving skills due to reliance on automation and lack of exposure to manual
driving. At the current level of automation this does not seem to be much of an issue; as higher
levels of automation become available, however, it can become much more significant. Already a
recognized issue in aviation, prompting the Federal Aviation Administration (FAA) to release a
safety notice recommending that pilots fly in manual mode more than using the autopilot (FAA,
2013), skill degradation can not only apply to psychomotor skills, but also for decision-making
skills (Miller & Parasuraman, 2007). The maintenance of basic skills is important because, as
previously mentioned, reliability of automation is still not perfect. There is a good chance that
drivers will need to re-claim manual control of the vehicle at some point in time.
Awareness of the System by Drivers
Until L4/L5 technology expecting a driver to only provide destination input and then let the
vehicle take care of all safety-critical functions, including monitoring the roadway exists, there
will continue to be some level of shared authority between the driver and the vehicle over the
tasks that make up driving. For lower levels of automation, design of vehicle automation that
supports the driver’s full understanding of the capabilities and limitations of the automation, as
well as the driver’s awareness of the automation’s current state, could yield safety benefits. The
failure to remain aware of the state of the automation and the overall status of the driving task, if
the automation has failed, could potentially increase the likelihood of collisions.
Current Best Practices
While there is not yet enough relevant research about the current and near-term implementation of
vehicle automation to develop full and specific design requirements, there is enough research to
recognize some best practices that could be considered when designing and implementing vehicle
automation. Table 1-3 below provides a summary of factors that may influence the effectiveness
of an automation design, the best practice to follow regarding that factor, and key references that
can provide more information on the best practice. These best practices can be used by designers
and system planners as a starting point, however, it is still unknown how exactly they will apply
when designing and implementing L2 and L3 automation.

11
Table 1-3. Summary of factors that can influence the effectiveness of an automation design.
Factors that Influence
Effectiveness
Best Practice Key Reference(s)
Driver Understanding of
Automation
Automation should not degrade a driver’s mental
model of how the automation system functions.
Goodrich & Boer, 1999
Preservation of Situation
Awareness
Drivers should be able to maintain good situation
awareness in case of an automation failure (out-of-
loop familiarity).
Endsley & Kiris, 1995;
Endsley & Kaber, 1999;
Seppelt & Lee, 2007
Automation-Induced Errors
Automation should not introduce new sources of
driver error.
Sarter & Woods, 1995
Appropriate Level of Trust
The level of trust that drivers place in the
automation should be commensurate with the
capabilities of the automation. Drivers should not
become over-reliant on automation and therefore
unable to perform key driving tasks.
Lee & See, 2004;
Muir & Moray, 1996;
Lee & Moray, 1994
Behavioral Adaptation
Automation should not lead drivers to adopt “bad
habits” (i.e., not paying attention to the road) that
can lead to unsafe driving in some situations or in
different vehicles.
Parasuraman & Riley, 1997;
Wilde, 1998;
Rudin-Brown, & Parker, 2004;
Jamson, Merat, Carsten, & Lai, 2013
Allocation of Functions
Allocation of a function between manual and
automated processes should be determined by task
suitability (i.e., Fitts List, adaptive functional
allocation), rather than application/engineering
capabilities.
Hollnagel & Bye, 2000;
Fitts, 1951;
Grote, Weik, Wäfler, & Zölch, 1995;
Inagaki, 2003;
Hilburn, Molloy, Wong, &
Parasuraman, 1993;
Hollnagel, 2004
Definition of the Driver’s
Role
The driver’s role and functions in the automated
application should be clearly apparent.
Hollnagel & Bye, 2000;
Inagaki, 2003
Incomplete Automation
Incomplete or “clumsy” automation should be
avoided (i.e., when easy tasks are automated but
complex ones remain manual) unless it constitutes
an appropriate allocation of function for the
application.
Wiener, 1989
Status Display Availability
Display of system status should be available on
demand (i.e., a persistent visual notification).
Flemisch & Schieben, 2009
Status Display Modality
Status display modality should be consistent with
or complement the type of information presented
(i.e., visual for persistent information, auditory or
conspicuous for change information.
Lee, McGehee, Brown, & Marshall,
2006
Change in Automation
Status
Display of system status should indicate changes in
system status. Status changes in critical tasks
should be adequately conspicuous, but not
disruptive to the driving task.
Hancock, 2007;
Seppelt & Lee, 2007
12
Driving Automation Research and Design Guidance Development
The best practices summarized above provide the beginnings of a foundation for thinking about
the DVIs of automated driving systems. These are some of the concepts considered during the
process of assembling the design guidance provided in this document. However, this is far from a
comprehensive foundation in terms of supporting the design of actual vehicle automation systems.
Much more research is needed to provide the kind of science-based guidance that could benefit
system developers and designers. In particular, further research about what information should be
presented, how it should be presented (mode, location, format, location, etc.), and when it should
be presented could be very helpful. Understanding how these factors apply across different levels,
and within different implementations of automation are also important. To that end, research
performed so far in the Human Factors Evaluation of L2 and L3 Automated Driving Concepts
project has culminated in this set of human-centric design guidance for the DVI of automated
driving systems. This design guidance represents both the current state of published science, as
well as a beginning step for a rapidly evolving field.
This document may assist manufacturers in minimizing the unintended consequences of motor
vehicle automation and help support designers in creating systems that are compatible with driver
limitations and capabilities. Consistent with this goal, the development team has focused on
providing a clear, relevant, and easy-to-use reference of human factors guidance for in-vehicle
DVI design and operation within L2 and L3 automated driving environments. The development
team has worked cooperatively with other project team members to ensure that relevant research
and suggestions are integrated into the design guidance development process. Overall, the DVI
design guidance is intended to:
• Be concise, clear, and easy to use.
• Include graphics-based design tools and examples that can be used by designers who are
unsophisticated regarding human factors issues and practices.
• Include discussions of critical design issues and special design considerations when, for
example, design trade-offs must be made or design constraints exist.
• Serve as a repository for relevant standards and guidelines.
• Support increased awareness and knowledge of relevant standards, human factors
concepts, and user characteristics among DVI developers and designers.
While DVI design guidance can be a valuable tool and resource for designers, they have their
limitations, and for L2 and L3 ADS, human drivers are ultimately responsible for driving safely.
Also, we recognize and appreciate the complexities and challenges associated with developing
automated driving systems; the design guidance is intended to augment, but not replace, the
judgment and experience of DVI developers.
Due to the variety of data sources used in this document, users may be uncertain regarding the
applicability of individual data sources to safety-related vs. non-safety-related DVI questions. In
general, when considering the applicability of individual design topics to a specific DVI design
question, users of this document should carefully consider the DVI question or issue they are
addressing relative to the characteristics (e.g., objectives, research and analytical methods,
13
limitations) of the original data sources cited, our syntheses of and conclusions regarding these
data sources.
Scope of This Document
This document provides goals and guidance for the design and development of DVIs for L2 and
L3 automated driving systems.
Limitations of this Document
As noted above, this document reflects an initial step in thinking about the information needs of
drivers in automated driving systems and trying to translate those needs into DVI design
guidance. There is relatively little published research available to support the development of
detailed design specifications for the DVIs of L2 or L3 automated systems. Thus, this document
is far from a comprehensive foundation in terms of supporting the design of actual vehicle
automation systems. In many respects, it highlights key knowledge gaps and points towards what
we do not yet know about the DVIs of automated driving systems. Future research may contribute
to the science-based guidance that system developers and designers may appreciate. In particular,
further research regarding what information should be presented, how it should be presented,
when it should be presented, and what kinds of driver behavior/performance/acceptance
challenges are associated with L2 and L3 systems could be beneficial to the community.
Understanding how these factors apply across L2 and L3 systems (and other levels in the future),
and across different implementations of automation (e.g., systems that provide longitudinal and
lateral control at highway speeds vs. parking assist systems vs. systems that provide drivers
assistance within traffic jams) are important issues for future research.
Organization of This Document
Beyond the Introductory chapter, this document consists of a series of chapters containing DVI
design guidance. Each chapter contains a set of subtopics relevant to a specific design
characteristic or element. Chapter 2 provides an overview of the format and content of these
design-specific chapter topics (Chapters 3 through 8). Following the design chapters are a set of
reference chapters with supplemental information which may be useful for either a specific topic
or for DVI design in general. These supplemental material (Chapters 9 to 14) includes a glossary,
an index, lists of abbreviations and equations used in the document, a list of additional standards
and other documents related to DVI design, and a complete reference list of articles and reports
specific to each chapter used to develop the design guidance. These chapters are listed below.
• Chapter 2. How to Use this Document
• Chapter 3. General DVI Guidance for Level 2 and Level 3 Automation
• Chapter 4. Message Characteristics
• Chapter 5. Visual Interfaces
• Chapter 6. Auditory Interfaces
• Chapter 7. Haptic Interfaces
14
• Chapter 8. Driver Inputs
• Chapter 9. Glossary
• Chapter 10. Index
• Chapter 11. Abbreviations
• Chapter 12. Equations
• Chapter 13. Relevant Documents From the United States Department of Transportation,
SAE International, and International Organization for Standardization
• Chapter 14. References

15
Chapter 2. How to Use This Document
Two-Section Format
In this document, a consistent two-section format is used to present the individual human factors
topics provided in Chapters 3 to 8. On each page the chapter title is indicated by centered, bold
type within the header. As described in more detail below, the first section presents the title of the
topic; an introduction and overview of the topic; a high-level design goal; supporting design
guidance; a graphic, table, or figure that augments the text information; and the rating associated
with the topic. The second section provides the more detailed supporting rationale for the topic, as
well as special design considerations, cross-references to related topics, and a list of references. A
sample topic, with key features highlighted, is shown in Figure 2-1; a detailed description of the
presentation format of the topics follows.
Figure 2-1. Topic format used in the guidance document.
The First Section
The topic title is indicated by centered, bold type at the top of the first page of the section.
Introduction
This subsection briefly defines the topic and provides an overview of or background for the topic
area.
16
Design Goal
This subsection provides the high-level functional driver-vehicle interface implementation
objective for the topic. This design goal: (1) specifies an objective regarding driver responses or
activities that the driver-vehicle interface design is intended to support, and (2) includes the
primary automation application addressed by the topic (L2, L3 or both). The objective of this
section is to provide a goal without indicating the specific ways in which the design goal must be
met. Since there may be several design approaches that could achieve the functional outcomes
specified by the design goal, this level of guidance provides system and application developers
with flexibility for meeting the goal with alternative design and implementation approaches.
Design Guidance
This subsection provides the best-available design information from the literature, including
specific, quantitative design parameter values, if available, that can be incorporated into a driver-
vehicle interface that satisfies the design goal. This represents the most directly “actionable”
information presented in each topic, although the level of specificity may vary depending on
available research. A key goal within this subsection is to present the design assistance clearly
and succinctly, with a minimal amount of clutter. Where individual information in this subsection
reflects a direct quote, or has a direct source, the source is cited. Often, information presented
here reflects a synthesis of the findings, conclusions, or results from several sources, not just a
single source. Also, it may reflect the judgement of the authors, after the reviews and analyses of
the relevant data sources have been completed. In general, the Discussion subsection (discussed
below) is intended to provide users of this document with support and rationale for the design
information provided.
Figure, Table, or Graphic
This subsection provides a figure, table, or graphic to augment the design topic. This figure, table,
or graphic might take many forms, including: a drawing depicting a generic application of a
design principle or a design issue, a flowchart of measurement procedures for the design topic, a
table that summarizes the design topic, or schematic examples of particular visual warnings. The
figure, table, or graphic will provide “at-a-glance” information to support the use of the design
information.
The Second Section
Discussion
This subsection, which always starts on a new page, briefly summarizes the rationale behind the
choice of the supporting design guidance provided. The discussion can take many forms,
including a brief review of applicable empirical studies, references to traditional design practice,
or an analysis of relevant information. The discussion is presented primarily to help designers
understand the design guidance and to help them explain or justify the guidance to others
involved in developing a system or application.
17
Design Issues
This subsection presents special design considerations, design cases (e.g., older driver
capabilities), or other concerns that may impact the effectiveness of the driver-vehicle interface
design. Design issues are only included on an “as-available,” “as-needed” basis; not all topics
include a design issue subsection.
Cross References
This subsection lists the titles and page numbers of other topics within the guidance document
that are particularly relevant to the current topic.
Topic References
This subsection lists the references associated with the formulation of the design topic. Each of
these references will already have been noted within the text of the design topic, and assigned a
reference number. It provides a quick way for designers to identify the source of the design
information and for the authors to source the information.
Selection of Font Sizes in This Document
Note that the font sizes occasionally change in this document—this is deliberate. In general, the
individual DVI design topics in Chapters 3 to 11 are presented using a 10-point font to maximize
the content of the topics in as few pages as possible. In these chapters, the topic references might
be presented in an even smaller font, depending on space constraints. The remaining chapters,
including the tutorials and the “back matter” (i.e., glossary, index, references) are presented using
a 12-point font.
18
Chapter 3. General Design Guidance for Level 2 and Level 3 Automation
This chapter provides design guidance for facilitating the relationship between the driver and
automation systems so that drivers can engage the system appropriately. Drivers may benefit from
a good understanding of their automation system, including the signals and mechanisms for
transfer of control to the system and back again to the driver. This guidance addresses design
issues that support drivers in relinquishing primary control of their vehicle, assist them in retaking
the primary role of driving as workload changes, and monitoring the status of their system
activities. Of importance is the ability of the system to reconnect the driver when he or she has
become distracted by either secondary tasks or through the lack of focus on driving tasks that
follows handover of control to the system.
The following topics are included in this chapter.
• Current Automation Mode and Status
• Suitable Display Properties for Automation Mode and Status Messages
• Communicating Transfer of Control from Driver to System
• Communicating Transfer of Control from System to Driver
• Developing and Maintaining Driver Mental Models
• Automation Etiquette
• Special Considerations for Level 2 and Level 3 Automation
• Developing Driver Training Material for Automated Driving System Applications
Current Automation Mode and Status
Introduction
This topic provides information about communicating the current mode and status of the automation to drivers.
Automation mode refers to the type or level of automation that is active at a particular time. This includes the specific
driving functions that are automated and that are relevant for driver understanding of the system operation. The status
of automation refers to the information about the system overall, including mode, that is communicated to the driver.
Appropriate status feedback about automation mode and status is important for: (1) maintaining drivers’ situation
awareness, (2) communicating if their requests have been received by the automation, (3) informing drivers if the
system actions are being performed properly, or (4) informing drivers if problems are occurring (Toffetti et al., 2009).
Providing status information is a key part of meeting NHTSA’s human factors objectives of allowing drivers to safely
transition between automated and manual vehicle operation and communicating relevant information about the safe
operation of the vehicle effectively to the driver (Strickland, 2013).

19
Design Goal (L2, L3): Display the information that drivers need to maintain an understanding of the current
and impending automation state and modes.
Supporting Design Guidance
Based on the best available literature, the information in the table below shows the types of status information that
can be provided to the driver about the automation, and considerations for presenting this information.
Information Type What Information to Provide Why Information is Provided
System activation or
on/off status
A display indicating which automation mode
is currently active, if at all.
To support driver awareness of current
automation mode when the driver seeks
this information.
Mode transition
status
A display indicating that a transition in
automation mode is occurring or that one
will occur in the near future.
Under normal operating conditions, this
information is presented to help drivers
maintain awareness of the driving tasks.
Confirmation of
successful transfer
from automated to
manual control
A display or message confirming for the
driver that control has been transferred to the
driver as they would expect, or
communication of a failed/incomplete
transfer of control if the transfer is
unsuccessful.
To indicate a successful transfer of control
from the automation system to the driver.
System fault or
failure
A display or message indicating that part of
the system has failed or is not functioning
correctly.
To alert drivers that they must intervene in
and reclaim control of driving tasks that
have previously been performed by the
automation as a result of a system fault or
failure.
20
Discussion
A key consideration when developing automated driving systems is how to keep the driver aware of the current
driving situation when the automation is in control of a portion of the driving tasks. Providing mode and status
information about the automation can help drivers remain aware of the driving task even if he/she is not performing it
and can help drivers understand how the automation system works (Sarter, Woods, Billings, 1997).
System activation or on/off status: System activation or on/off information should be provided to the driver, even
though the driver may know this type of information about the system. In a simulator study investigating vehicles that
were going to be driven manually and automatically, Toffetti et al. (2009) provided drivers with a pre-activation
message, communicating that the eLane (automation) system would be active in 200m. Once the vehicle was in the
eLane area, a second message was provided to drivers indicating that the system was ready to use. Knowing the
automation system was active helped drivers know when they could transfer control to the automation since there
were multiple activation parameters that needed to be satisfied before the transfer could occur.
Mode transition status and confirmation of successful transfer from automated to manual control: If the automation
system detects a situation that it cannot handle, an impending transition in automation mode from system to driver
should be communicated if possible (in the case of L2 automation, and must be communicated in the case of L3
automation). This information should direct the driver’s attention to the transition. In the Toffetti et al. study (2009),
the system gave drivers a message a few minutes before deactivating. The majority of drivers (85%) reclaimed
control of the vehicle in response to the deactivation message while the other 15% of drivers did not. With L3
automation, drivers will need sufficient time to reclaim control of the vehicle as they may be engaged in non-driving
activities. Messages indicating the driver will need to take control soon can benefit drivers (Blanco et al., 2015; see
Chapter 4). After the transfer of control has occurred, the driver must receive information confirming that control has
been transferred back to him/her as expected (see topics 3-6 and 3-8). Mode transition status information should be
communicated to the driver under normal operating conditions to help the driver maintain awareness of system
function and driving tasks.
System fault or failure: When an automation function or system detects that it has stopped functioning as it was
designed to, this may need to be communicated to the driver depending on the effect upon the driver’s tasks. If only
part of the automated system stops functioning, resulting in partial automation, this may need to be communicated to
the driver as well. In response to a system failure, either partial or full, information regarding the specific failure
could be communicated if there are specific actions the driver needs to take in response to the failure. A study of L3
automation did not identify differences in driver responses to immediate take control requests based on the presence
or absence of a visible external hazard (Blanco et al., 2015; see Chapter 4).
Design Issues
Tracking or external input status: For automation systems that use external inputs, information could be
communicated to the driver indicating that the automation is detecting and receiving these necessary inputs. If the
system is not receiving these inputs, but the sensor or device that gathers these inputs is functioning properly, it may
indicate that something in the environment is preventing the sensor from gathering this information. An example of
this is a lane keeping system having trouble keeping the vehicle in the lane due to faded lane markings on the road. If
this information is provided to the driver, it should be provided in a way that does not interfere with the driving task
(Seppelt & Lee, 2007). The decision of whether to provide this information or not is dependent upon a number of
factors. Further research may assist with this decision by determining if drivers find the information useful and what
benefits and dis-benefits may be associated with its use.
Cross References
Suitable Display Properties for Automation Mode and Status Messages, 3-4; Communicating Transfer of Control
from Driver to System, 3-6; Communicating Transfer of Control from System to Driver, 3-8
Topic References
1. Norman, D. A. (1990). The problem of automation: Inappropriate feedback and interaction, not over-automation. Philosophical Transactions
of the Royal Society of London, B, 1-18.
2. Strickland, D. (2013, August 13). Every co-pilot needs a pilot (Speech for the Washington Automotive Press Association Luncheon).
Washington, DC. National Highway Traffic Safety Administration. Available at www.nhtsa.gov/sites/nhtsa.dot.gov/files/ds_wapa_8-14-
2013.pdf
3. Sarter, N. B., Woods, D. D., & Billings, C. E. (1997). Automation surprises. In G. Salvendy (Ed.), Handbook of Human Factors and
Ergonomics, Second Edition (pp. 1926-1943). Hoboken: Wiley & Sons.
4. Toffetti, A. Wilschut, E. S., Martens, M. H., Schieben, A., Rambaldini, A., Merat, N., & Flemisch, F. (2009). CityMobil: Human factor issues
regarding highly automated vehicles on eLane. Transportation Research Record: Journal of the Transportation Research Board, 2110, 1-8.
doi: 10.3141/2110-01

21
5. Blanco, M., Atwood, J., Vasquez, H. M., Trimble, T. E., Fitchett, V. L., Radlbeck, J., ... Morgan, J. F. (2015, August). Human factors
evaluation of level 2 and level 3 automated driving concepts (Report No. DOT HS 812 182). Washington, DC: National Highway Traffic
Safety Administration. Available at www.nhtsa.gov/sites/nhtsa.dot.gov/files/812182_humanfactorseval-l2l3-automdrivingconcepts.pdf
6. Seppelt, B. D., & Lee, J. D. (2007). Making adaptive cruise control (ACC) limits visible. International Journal of Human-Computer Studies,
65, 192-205.
Suitable Display Properties for Automation Mode and Status Messages
Introduction
This topic discusses message display properties for communicating automation mode and status information to the
driver. Status messages can be used in a range of ways and can have different functional objectives. Display
properties are important because the method used to communicate automation mode and status can be matched with
the nature of the information to facilitate communication and appropriate driver responses.
Design Goal (L2, L3): Present status information in a way that is compatible with the purpose of the
information being communicated and the expected driver response.
Supporting Design Guidance
The best available research suggests that this goal can be met when designers provide:
• Continuously available information on a dedicated display to communicate static status information that the
driver can access in a self-paced manner. Visual displays are suitable for this type of information because they
can be displayed continuously (Deatherage, 1972;
Seppelt, & Lee, 2007).
• Temporary, as needed, information with a clear onset in time to communicate time-dependent information,
especially a status that requires a driver to take action in the driving task. Auditory and haptic signals are
suitable for this type of information because these signals are omnidirectional and have a clear onset point
(Deatherage, 1972).
• Salient information to communicate important, time-critical, information that commands the driver’s
attention. Auditory and haptic signals are suitable for this type of information because they can quickly re-
orient the driver’s attention (Deatherage, 1972; Parasuraman & Riley, 1997).
• Non-salient information to communicate non-urgent, non-time-critical, information that notifies the driver
of automation mode and status, but does not interfere with the driving task. Visual displays are suitable for
this type of information because they can be viewed as the driving task allows and do not take the driver’s
attention away from the driving task (Deatherage, 1972; Arroyo, Sullivan, & Selker, 2006).
• A simple display to communicate basic information about the mode or status of the automation to the driver.
Auditory signals or visual displays are suitable for communicating this type of information, but choosing which
modality to use depends on the purpose of status information (Deatherage, 1972).
• A complex display to communicate detailed information about the mode or status of the automation to the
driver. Speech (for verbal messages) or visual displays are suitable for communicating this type of
information (Deatherage, 1972; Stanton, Dunoyer, & Leatherland, 2011).

22
Application of design guidance to specific status message types.
Type of Mode or
Status Information
Saliency Timing Complexity Example
System Activation or
On/Off Status
Non-salient
Continuously
available
Simple
A light indicating that the
automation system is on.
Mode Transition
Required
Salient
Temporary,
as needed
Simple
A tone and a “Place hands
on steering wheel” speech
message.
Confirmation of
Successful Manual
Override/Mode
Transition Success
Non-salient
Temporary,
as needed
Simple
An icon and a tone
indicating that the
automation will disengage
in the near future,
requiring the driver to
reclaim control of the
vehicle.
Tracking or External
Input Status
Non-salient
Continuously
available
Complex
A “radar” type display
indicating the vehicle that
the ACC system is
tracking and functioning
(Stanton, Dunoyer, &
Leatherland, 2011).
An Error or Bad Data
Resulting in Partial or
Imperfect Automation
Salient
Temporary,
as needed
Complex
A tone and a flashing icon
indicating to the driver that
the system is not
functioning normally and
that he/she needs to
reclaim control of the
vehicle.
23
Discussion
While it is important to communicate the current automation mode and status to drivers, the display properties used
to communicate this information are equally important. The following discusses the various display properties and
how they should be used to communicate mode and status information.
Providing continuously available information can help drivers understand how the automation system functions under
both normal and non-normal operating conditions, such as a failure, which is an important part of helping drivers
develop appropriate reliance on the automation system. If drivers understand how the system functions and they rely
on it, they are more likely to use it than if they do not understand how it functions and therefore do not rely on it
(Parasuraman and Riley, 1997). Seppelt and Lee (2007) investigated the use of an ecological interface design (EID)
display to provide a visual representation of ACC behavior. With the EID display, drivers were better able to respond
to ACC failures and the continuous information about the automation system and the roadway state helped drivers
rely on the automation appropriately when detecting and responding to the failures.
Continuously available information should be non-salient, meaning that it does not take the driver’s attention away
from the driving task, but should be available when the driver looks for it or have reached a point in the driving task
that they can take-in the information (Sarter, Woods, & Billings, 1997). The use of continuously available
information mostly applies to L2 automation, as with this level of automation, the driver is still expected to monitor
the roadway and for safe operation of the vehicle, meaning he/she will still be engaged in the driving task to a certain
extent.
Mode and status information that is presented in response to an event occurring, such as a take-over request from the
automation to the driver or a system failure, is different from continuously available information because it is often
time-dependent information and requires the driver to take action. This type of information should direct or reorient
the driver’s attention to the driving task. The communication of this information differs between Levels 2 and 3 of
automation. With L2, drivers are expected to be able to reclaim control from the automation on short notice, while in
L3 drivers are still expected to be able to reclaim control of the vehicle, yet on a more infrequent basis and with a
sufficient and more comfortable transition time than with L2. Toffetti et al. (2009) investigated the use an acoustic
interface and a vocal interface to indicate that the driver must reclaim control of the vehicle across three messages
(pre-message, first, and final message). In response to the automation deactivation message, at the pre-message step
more drivers took control in response to the vocal interface (55%) compared to the acoustic interface (40%) and after
the first message, more drivers with the acoustic interface (50%) took control compared to the vocal interface (35%).
Display complexity is another factor that must be considered when communicating automation mode and status
information. As mentioned on the previous page, a simple display should be used to communicate basic mode or
status information, while a complex display should be used to communicate more detailed mode or status
information. Stanton, Dunoyer, and Leatherland (2011) investigated the use of three interfaces to communicate that
the lead vehicle being tracked by the Stop & Go ACC system had changed. When using the “radar” type display,
drivers were better able to a detect change in the target vehicle being tracked by the Stop & Go ACC system than
when using the icon interfaces.
Design Issues
Beyond simple, salient, messages, sometimes messages must communicate a higher sense of urgency, e.g., a transfer
of control. In L3 automation, the message should be intrusive, but in a non-urgent way because the transfer of control
will happen in the future when driver have a lot of time to prepare. Conversely, in L2 automation drivers must take
control as soon as possible. Therefore, the message needs to be salient, attention-getting, and communicate a sense of
immediacy.
Cross References
Current Automation Mode and Status, 3-2; Selection of Sensory Modality, 4-6; Perceived Urgency of Auditory
Warnings, 6-2

24
Topic References
1. Deatherage, B. H. (1972). Auditory and other sensory forms of information presentation. In H. P. Van Cott & R. G. Kinkade (Eds.), Human engineering
guide to equipment design (rev. ed.). Washington DC: U.S. Government Printing Office.
2. Seppelt, B. D., & Lee, J. D. (2007). Making adaptive cruise control (ACC) limits visible. International Journal of Human-Computer Studies, 65, 192-
205.
3. Parasuraman, R., & Riley, V. (1997). Humans and automation: Use, misuse, disuse, abuse. Human Factors, 39(2), 230-253.
4. Arroyo, E., Sullivan, S., & Selker, T. (2006). CarCoach: A polite and effective driving coach. Proceedings of CHI ’06 Extended Abstracts on Human
Factors in Computing Systems, 357-362.
5. Stanton, N. A., Dunoyer, A., & Leatherland, A. (2011). Detection of new in-path targets by drivers using stop & go adaptive cruise control. Applied
Ergonomic, 42, 592-601.
6. Sarter, N. B., Woods, D. D., & Billings, C. E. (1997). Automation surprises. In G. Salvendy (Ed.), Handbook of Human Factors and Ergonomics,
Second Edition (pp. 1926-1943). Hoboken: Wiley & Sons.
7. Toffetti, A., Wilschut, E. S., Martens, M. H., Schieben, A., Rambaldini, A., Merat, N., & Flemisch, F. (2009). CityMobil: Human factor issues
regarding highly automated vehicles on eLane. Transportation Research Record: Journal of the Transportation Research Board, 2110, 1-8. doi:
10.3141/2110-01
Communicating Transfer of Control From Driver to System
Introduction
This topic discusses the driver’s information needs within a driver-initiated transfer of control from the driver to an
automated system and what information supports the driver during this transition. This type of transfer reflects a
series of operations through which the driver transfers part of or the entire driving task to the automated system.
System information during these transfers is important to maintain a driver’s calibrated trust in the system and to help
drivers maintain awareness of driving tasks and the driving situation.
Design Goal (L2, L3): Support the transition from manual to automated driving by acknowledging a driver’s
request to engage automation and provide information about the status of the transfer of control.
Supporting Design Guidance
The best available research on this topic suggests that this design goal can be met when the following points are
considered:
The current system status is provided at all times (Toffetti et al., 2009).
Automation engagement requests are acknowledged upon receipt to prevent duplicate or conflicting
inputs from the driver, and to prevent the driver from releasing control without the automation being
active.
Feedback acknowledging a driver automation activation request is provided within 250 ms of input
(ISO 15005, 2002; Alliance of Automobile Manufacturers, 2006).
If the transfer was successful, provide the driver with a notification and update the displayed status of
the automation.
If the transfer was unsuccessful, the driver is provided with a notification as to the failure of the
automation to engage and why the automation did not engage (Tsao, Hall, & Shadlover, 1993; Merat
& Jamson, 2009).
The use of unimodal or multimodal notifications and messages is based on the context of the
situation.
Distinctive messages are used for successful and unsuccessful transfer of control events.
Display needs during driver to automation transfer of control.
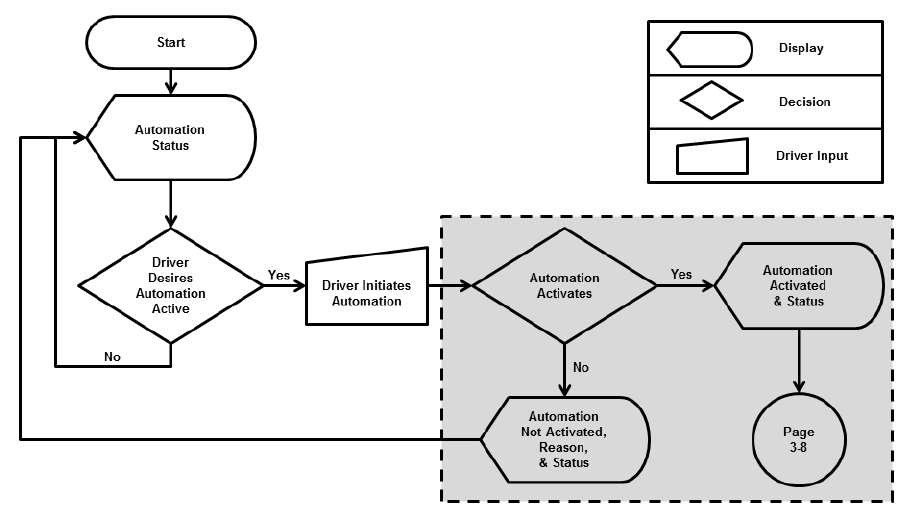
25
This flowchart shows a hypothetical driver-automation interaction. This topic addresses what information the system
can provide to support the driver during the interaction, indicated within the shaded box. The automation status is
displayed at all times. Following an activation request, the automation displays the success of the transfer or, in the
case that automation does not activate, displays that automation did not activate and what prevented activation from
occurring. System to driver transfers are covered in Communicating Transfer of Control from System to Driver, 3-8.

26
Discussion
This topic addresses how the DVI can support the driver’s information needs during a manual-to-automated transition
once the driver has initiated the request for automated control. Although well examined in other domains, the
activation of automation and transfer of control from the driver to the automated driving system have not been
extensively examined for L2 or L3 systems. However, the basic guidance of human factors, as well as the extant
research from L1 and exploratory L2 research, can inform the DVI designer as to some basic guidance for supporting
the driver to automation transfer of control.
Providing the current status at all times can help prevent mode awareness failures (Toffetti et al., 2009). The
automation should provide an acknowledgement of the request in a timely fashion if the request should be expected.
Providing rapid feedback to the driver helps to avoid driver uncertainty. Delayed responses can lead to drivers
providing second inputs or becoming distracted by the systems’ non-response. Standards organizations have provided
some guidance for system response time maximal limits for drivers’ interaction with vehicle user interfaces that
provide good guidance for designers of automated driving system DVIs. ISO 15005 (2002) provides a limit of 250
ms for providing feedback to the driver. This value is also used by the Alliance of Automobile Manufacturers (AAM)
as a maximum system response time for in-vehicle information and communications systems providing a response to
drivers (AAM, 2006).
In addition to acknowledging a driver’s input, research from other areas of human-automation interaction suggest that
it is important to include information on the success or failure of the automation activation request (Sarter & Woods,
1995). This can reduce the likelihood of a mode awareness failure, where the driver believes the automation activated
and ceases control of the vehicle without automation having assumed control. If the transfer is unsuccessful even
though the system displayed that automation was available, drivers may benefit from receiving information about the
reason for the failure. Drivers may attempt to immediately reactivate the automation. If a reason for the failure is
something that can be provided in a simple manner and addressed by the driver, it may help the driver successfully
modify vehicle conditions (e.g., centering the vehicle in the lane, stopping at an appropriate location) necessary for
automation activation.
Design Issues
The use of a unimodal or multimodal notifications or messages should be considered based on the context in which
the message is being generated. For uneventful driver-initiated activations of automation, basic acknowledgments
may suffice. If a driver may misinterpret a scenario, such as a failed automation activation request, consider using a
multimodal display. Distinctive messages are needed for successful and unsuccessful transfer of control events to
minimize the potential for confusion as to the transfer status. The use of unique coding can help create distinctive
messages for these two events.
Cross References
Current Automation Mode and Status, 3-2; Suitable Display Properties for Automation Mode and Status Messages, 3-4;
Communicating Transfer of Control from System to Driver, 3-8; Selection of Sensory Modality,4-6; Multimodal
Messages, 4-8
Topic References
1. Toffetti, A. Wilschut, E. S., Martens, M. H., Schieben, A., Rambaldini, A., Merat, N., & Flemisch, F. (2009). CityMobil: Human factor issues
regarding highly automated vehicles on eLane. Transportation Research Record: Journal of the Transportation Research Board, 2110, 1-8.
doi: 10.3141/2110-01
2. ISO 15005. (2002). Road vehicles—Ergonomic aspects of transport information and control systems—Dialogue management principles and
compliance procedures. Geneva: International Organization for Standards.
3. Alliance of Automobile Manufacturers. (2006). Statement of principles, criteria and verification procedures on driver interactions with
advanced in-vehicle information and communication systems, including 2006 updated sections (Report of the Driver Focus-Telematics
Working Group). Retrieved from www.autoalliance.org/index.cfm?objectid=D6819130-B985-11E1-9E4C000C296BA163.
4. Tsao, H.-S. J., Hall, R. W., & Shadlover, S. E. (1993). Design options for operating fully automated highway systems. Berkeley: University of
California PATH Institute of Transportation Studies.
5. Merat, N., & Jamson, A. H. (2009). How do drivers behave in a highly automated car? Proceedings of the 5th International Driving
Symposium on Human Factors in Driver Assessment, Training, and Vehicle Design, Big Sky, MT, June 22-25, 2009 514-521.
6. Sarter, N. B., & Woods, D. D. (1995). How in the world did we ever get into that mode? Mode error and awareness in supervisory control.
Human Factors, 37, 5-19. doi: 10.1518/001872095779049516

27
Communicating Transfer of Control from System to Driver
Introduction
This topic discusses the driver’s information needs of a system-initiated transfer of control from an automated system
to the driver and what information supports the driver during this transition. Transfer of control can range from
gradual and expected by the driver to immediate and unexpected. Consequently, providing drivers with information
to support a safe transition from automated to manual vehicle control in all circumstances may be beneficial.
Design Goal (L2, L3): Support the transition from automated to manual driving by providing information
about the need for the driver to take manual control.
Supporting Design Guidance
The best available research on this topic suggests that this design goal can be met when the following
points are considered:
• The driver is provided with information on when they need to take control (Gold, Damböck,
Lorenz, & Bengler, 2013; Blanco et al., 2015).
• The driver is provided with information on how to take control if a specific control input is
required (Toffetti et al., 2009).
• The driver is provided with information on why the driver needs to take control. For time-
critical situations, this may be a simplified “take control” message. For less time-critical
situations, more information may be provided.
• The current system status is provided at all times, allowing the driver to validate the
disengagement (Sheridan & Parasuraman, 2005).
• Notifications and messages related to a “take control” message are multimodal. (Blanco et
al., 2015; Toffetti et al., 2009; Brookhuis, van Driel, Hof, van Arem, & Hoedemaeker,
2008).
•
Any collision avoidance system messages are provided to the driver, if applicable.
Display needs during automation to driver transfer of control.
28
This flowchart shows a hypothetical driver-automation interaction. This topic addresses information the system can
provide to support the driver during the interaction, indicated within the shaded box. The urgency of the request is
considered in what type of message to provide to the driver. The reason for the take control message is provided
depending on the time critical nature of the request. Driver to system transfers are covered in Communicating
Transfer of Control from Driver to System (3-6).

29
Discussion
The “take control” request should inform the driver about when to take control. A CityMobil study examining an L2-
type automated driving included a three-stage warning prior to emergency braking at the end of the automated travel
lane (Toffetti et al., 2009). Many drivers took manual control at the first warning issuance, and the majority of drivers
had taken control after the second warning. Providing earlier “take control” requests can aid drivers in transitioning to
manual control. A simulator evaluation of L3 driving used a “take control” scenario with either a 5 s or 7 s time-to-
collision (TTC) used as the “take control” request issuance point (Gold, Damböck, Lorenz, & Bengler, 2013. The
amount of steering maneuvers increased with a greater amount of warning (i.e., the 7 s. TTC) and the amount of
braking maneuvers decreased. Drivers in the 7 s. TTC condition could sample more roadway information and thus
steer the vehicle around the obstacle. In an L3 study where a 40 s duration staged alert was provided, drivers took
control on average 17.0 s post-alert issuance; all drivers took control before the alert escalated to a more urgent level
(Blanco et al., 2015; see Chapter 4).
Information about how the driver should take control should be provided, if applicable. If the driver should perform a
certain input, such as taking manual control of steering (Toffetti et al., 2009) this information should be clearly
provided. Guidelines from the Automated Highway System project recommended against limiting the methods a
driver can use to take manual control of the vehicle (Levitan, Bunus, Dewing, Reinhart, Vora, & Llaneras, 1997), and
cruise control (an L0 automation system most drivers are familiar with) similarly allows drivers to take manual
control through multiple means.
The status of L2 or L3 automation following a temporary driver manual input should be clearly communicated to the
driver (indicating if the automation is still active and in control) (Sheridan & Parasuraman, 2005). As a safety critical
message, take control messages should be provided in a multimodal manner. Simulator studies of L1-type automated
systems have used a visual icon for system status accompanied by an auditory signal to indicate when the system
status changed (Brookhuis, van Driel, Hof, van Arem, & Hoedemaeker, 2008). Evaluations of L2-type automation
have used a constant visual status message with visual and auditory notifications for transition states (Toffetti et al.,
2009), or a visual-tactile combination (Blanco et al., 2015; see Chapter 2) to indicate this status.
Design Issues
When communicating transition information to the driver, a key question is how to balance the complexity of
information provided against the time available to provide this information. In the absence of research specific to L2
and L3 automation, guidance from driver warnings (see topic 4-4) should be followed and information should be
presented in the simplest manner supporting a timely and effective driver response. Providing the reason for the “take
control” request may be beneficial for supporting mental models. While potentially inappropriate during urgent “take
control” requests, information about the reason for the “take control” request may prevent the driver from attempting
to reengage automation in the presence of a limiting condition and helps support the formation of functionally-
accurate mental models of the system (see topic 3-10). Providing the current automation status allows drivers to
verify the automation disengaged (Sheridan & Parasuraman, 2005). Relevant safety warnings (e.g., collision
warnings) should be provided.
The guidance in this topic does not address transfers between L2 and L3 automation. Insufficient research exists to
provide an understanding of what is needed to support transitions between higher automation levels (i.e., L3 to L2)
and how to ensure the driver begins performing the monitoring tasks required at that point. ACC provides a similar
parallel in that SAE standards do not permit ACC to transition to normal cruise control (SAE J2399, 2003). However,
some simulator research suggests that drivers may benefit from a supportive level of automation during a transition
(Gold, Lorenz, Damböck, & Bengler, 2013).
Cross References
Current Automation Mode and Status, 3-2; Suitable Display Properties for Automation Mode and Status Messages,
3-4; Communicating Transfer of Control from System to Driver, 3-8; Message Complexity, 4-4; Developing and
Maintaining Mental Models, 3-10
Topic References
1. Gold, C., Damböck, D., Lorenz, L., & Bengler, K. (2013). “Take over!” How long does it take to get the driver back into the loop? Proceedings of the
Human Factors and Ergonomics Society 57th Annual Meeting, 1938-1942. doi: 10.1177/1541931213571099
2. Blanco, M., Atwood, J., Vasquez, H. M., Trimble, T. E., Fitchett, V. L., Radlbeck, J., ... Morgan, J. F. (2015, August). Human factors
evaluation of level 2 and level 3 automated driving concepts (Report No. DOT HS 812 182). Washington, DC: National Highway Traffic
Safety Administration. Available at www.nhtsa.gov/sites/nhtsa.dot.gov/files/812182_humanfactorseval-l2l3-automdrivingconcepts.pdf
3. Toffetti, A., Wilschut, E. S., Martens, M. H., Schieben, A., Rambaldini, A., Merat, N., & Flemisch, F. (2009). Human factors issues regarding highly
automated vehicles on eLane. Transportation Research Record: Journal of the Transportation Research Board, 2110, 1-8. doi: 10.3141/2110-01

30
4. Sheridan, T. B. and Parasuraman, R. (2005). Human-automation interaction. Reviews of Human Factors and Ergonomics, 1, 89-129.
5. Brookhuis, K. A., van Driel, C. J. G., Hof, T., van Arem, B., & Hoedemaeker, M. (2008). Driving with a congestion assistant; mental
workload and acceptance. Applied Ergonomics, 40, 1019-1025. doi: 10.1016/j.apergo.2008.06.01
0
6. Levitan, L., Bunus, M., Dewing, W. L., Reinhart, W., Vora, P. B., & Llaneras, R. E. (1997). Preliminary human factors guidelines for automated
highway system designers (2nd Ed.) (Report No. FHWA-RD-97-125). McLean, VA: Federal Highway Administration.
7. SAE J2399. (2003). Adaptive cruise control (ACC) operating characteristics and user interface. Warrandale, PA: SAE International.
8. Gold, C., Lorenz, L., Damböck, D., & Bengler, K. (2013, November). Partially automated driving as a fallback level of high automation. Paper
presented at Tagung Fahrerassistenzsysteme: Der weg zum automatischen fahren. Retrieved from http://mediatum.ub.tum.de/doc/1187198/1187198.pdf
Developing and Maintaining Driver Mental Models
Introduction
This topic discusses considerations for designing an automation system that supports drivers developing and
maintaining a functionally accurate mental model of how the automation system operates. A mental model
encompasses the user’s knowledge of an automated system’s purpose, how it functions, and how it is likely to
function in the future (Goodrich & Boer, 2003). Drivers with a functionally accurate mental model of the automation
may be more likely to avoid errors based on incorrect assumptions about system operation, recognize a failure if it
occurs, and use the automation appropriately.
Design Goal (L2, L3): Support the development and maintenance of a functionally accurate mental model of
the automated system through design and training.
Supporting Design Guidance
The best available research on this topic suggests that this design goal can be met when the following points are
considered:
Provide training or information to support the formation and refinement of a functionally accurate
mental model (Redding, Cannon, & Seamster, 1992; Cassidy, 2009).
Provide information about the system at a level of detail that can be understood. The automation may
best be described as a set of tasks or functions, not in terms of sensors and control systems. The
information’s level of specificity may be geared towards relevant details for the DVI and the driver’s
direct experience with the system without the inclusion of unnecessary details. [4]
Automation works in a consistent manner and training material are consistent with the automation’s
operation.

31
Presenting information in a way that supports drivers’ mental models.
Suggested Not Suggested
Example for a Hypothetical
L2 Highway-speed System
Describe automation as a set of tasks
or functions and how they relate to
the driver and driving task.
Describe automation in terms of the
sensors and controllers.
Not Recommended: Training manual
describes the system as using a near-
infrared camera and machine vision
algorithms to detect lane markings.
Better: Training manual describes
the system as looking for lane
markings.
Present information at the most basic
level that provides the needed
information.
Present jargon or complex
information, such as technical
information, unnecessarily.
Not Recommended: Training manual
describes the ACC function as a
sensor fusion between machine
vision- and radar-based sensors.
Better: Training manual describes
the system as constantly measuring
the distance between your vehicle
and objects in front of your vehicle.
Use an appropriate level of
specificity, focusing on relevant
details.
Provide unnecessary details or
needless information.
Not Recommended: DVI provides
status and continuously updated
distance values for lane keeping and
headway separately.
Better: DVI provides a single
presentation of automation status.
32
Discussion
Drivers have mental models that help them understand a system’s current performance as well as extrapolate its
likely future behavior (Goodrich & Boer, 2003). While drivers have existing mental models for common automation
features, such as cruise control, they will have vague or non-existent mental models for the first implementations of
L2 and L3 automation. Thus, mental models will be developed through instruction, training, and use.
Unfamiliar automation can be paired with instruction and training to support the formation, refinement, and
maintenance of the driver’s mental model. Research in human-automation interaction, such as air traffic control, has
identified that having a functionally accurate mental model for automated systems is a central aspect of reaching a
level of expertise with the system (Redding, Cannon, & Seamster, 1992). Additionally, having a functionally accurate
mental model affects an operator’s level of trust in an automated system (Cassidy, 2009). Automated decision aid
research has suggested that operators with a functionally accurate mental model of an automated system are better
able to identify automation errors (Wilkison, 2008).
A simulator study of an L1 automation technology (ACC) examined the formation of drivers’ trust and conceptual
models over 10 days (Kazi, Stanton, Walker, & Young, 2007). Results indicated that drivers’ conceptual models
tended to be consolidated by the fourth day. Additionally, despite specifically stating that the ACC system did not
include a collision avoidance feature, 33 percent of participants incorrectly described collision avoidance as a system
component. Further analysis indicated that some drivers were confusing the headway maintenance feature of ACC
with a collision avoidance maneuver. While not representative of ACC’s real-world performance, this research
highlights the importance of information presentation.
In advanced systems, some complex information cannot be processed until it has been stored in a schematic form in
long-term memory (Pollock, Chandler, & Sweller, 2002). Depending on the implementation, automation may be a
highly complex system from a human-automation interaction perspective. Some best practices from prior human
factors research into automation are applicable, including presenting information at an appropriate level and at the
appropriate level of detail (Wiener, Chute, & Moses, 1999).
Support formation of functionally accurate mental models by having automation work in a consistent manner. In the
case of the L1 ACC automation technology, Goodrich and Boer (2003) note that the utility of the automation is a
function of not only the driver’s understanding of the vehicle-environment interaction but also the driver’s
understanding of the automation. When the ACC system behaves in a manner consistent with that of a reasonable
driver, the driver’s mental model of the system will be supported and the driver will be more likely to intervene when
needed (Goodrich, Boer, & Inoue, 1999). While this research examined the case of an L1 automated system, the same
guidance likely applies to other monitored automation types that fall under L2. Additionally, any information about
the system provided to the driver should be consistent with how the system will function.
Design Issues
A driver’s mental model of how a system operates, performs, and will likely perform helps determine the likelihood
that the system will be ignored, used correctly, or misused/misapplied. Drivers of the first L2 and L3 automated
driving systems will likely have weak, incorrect, or absent mental models of early automated systems. Further, it is
unknown what differences may manifest between drivers’ mental models of L2 and L3 automation. Given the myriad
ways drivers can interact with automation, design should be sensitive to, and supportive of, the formation of
functionally accurate mental models.
Cross References
Current Automation Mode and Status, 3-2; Developing Driver Training Material for Automated Driving System
Applications, 3-14
Topic References
1. Goodrich, M. A., & Boer, E. R. (2003). Model-based human-centered task automation: A case study in ACC system design. IEEE
Transactions on Systems, Man, and Cybernetics, Part A, Systems and Humans, 33(3), 325-336.
2. Redding, R. E., Cannon, J. R., & Seamster, T. L. (1992). Expertise in air traffic control (ATC): What is it, and how can we train for it?
Proceedings of the Human Factors and Ergonomics Society, 36, 1326-1330.
3. Cassidy, A. M. (2009). Mental models, trust, and reliance: Exploring the effect of human perceptions on automation use (Master’s thesis).
Naval Postgraduate School, Monterey, CA.
4. Pollock, E., Chandler, P., & Sweller, J. (2002). Assimilating complex information. Learning and Instruction, 12, 61-68.
5. Wilkison, B. D. (2008). Effects of mental model quality on collaborative system performance (Master’s thesis). Georgia Institute of
Technology, Atlanta, GA.
6. Kazi, T. A., Stanton, N. A., Walker, G. H., & Young, M. S. (2007). Designer driving: Drivers’ conceptual model and level of trust in adaptive
cruise control. International Journal of Vehicle Design, 45(3), 339-360.

33
7. Wiener, E. L., Chute, R. D., & Moses, J. H. (1999). Transition to glass: Pilot training for high-technology transport aircraft (NASA/CR-
1999-208784). Washington, DC: National Aeronautics and Space Administration.
8. Goodrich, M. A., Boer, E. R., & Inoue, H. (1999). A model of human brake initiation behavior with implications for ACC design. Proceedings
of IEE/IEEJ/JASI International Conference on Intelligent Transportation Systems, 86-91.
Special Considerations for Level 2 and Level 3 Automation
Introduction
This topic discusses special considerations associated with L2 and L3 automation. The level of automation can
determine how involved the driver must be in monitoring the environment to ensure the safe operation of the vehicle.
Humans, however, are poor at performing vigilance and monitoring tasks. Automation may benefit from being
designed to provide information to drivers in a way that promotes a level of supervision by the driver that is
appropriate for the level of automation.
Design Goal (L2, L3): Encourage adequate driver supervision relative to the requirements of the level of
automation.
Supporting Design Guidance
Potential challenges to drivers using L2 and L3 automation arise from driver task underload. The following guidance
is based on the best available research on this topic and provide general information related to addressing these
challenges.
Automation that optimizes drivers’ workload may promote situation awareness and assist in
maintenance of an appropriate level of vigilance during automated driving.
Automation that may need driver intervention may benefit from having an awareness of the driver’s
status as part of supporting transitions from automated to manual driving. There may be benefits from
employing strategies that engage the driver’s attention when deemed necessary.
L2 automation may perform best when designed to:
− Clearly indicate the level or mode of automation
− Encourage drivers to attend to forward roadway conditions (Blanco et al., 2015; see Chapter 3)
− Provide alerts for system failures and limitations (Salinger, 2012; Hoeger et al., 2011)
L3 automation may perform best when signals used to indicate or request a transition from
automation to manual control are salient, distinctive, and unambiguous in order to capture drivers’
attention and promote understanding of the automation state.
A. Display indicating request to
reclaim control from automation.
B. Message to capture
inattentive drivers’ attention.
C. Flashing LEDs in the windscreen
at right to capture inattentive
drivers’ attention.
A. Figure 263, use and modification of fifth image, B. and C. from Figure 133]. Adapted from Hoeger et al. (2011). Used with permission.
34
Discussion
L2 automation requires drivers to monitor the road and remain able to take control of the vehicle at any time. L2
automation takes drivers out of the vehicle-control loop and requires them to adopt a supervisory role; however,
humans generally perform poorly in the role of monitors (Kaber, & Endsley, 2004). Out-of-the-loop (OOTL)
problems include complacency, vigilance decrements, loss of situation awareness, and decay of skill when relying on
high-level automation compared with low- or intermediate-level automation (Kaber, & Endsley, 2004; Stanton,
Young, Walker, Turner, & Randle, 2001). Stanton et al. (2001) found that drivers were less able to reclaim control of
the vehicle from the automation in an emergency braking scenario when both ACC and a lane centering system
(LCS) were active. Similarly, drivers’ brake reaction times in a simulator study (Young & Stanton, 2007) were 1.0 s
to 1.5 s longer for OOTL drivers using ACC versus manual headway keeping. Strategies should be adopted that
promote situation awareness and support understanding of the automation state when drivers are out of the control
loop. Such strategies may include interactive, periodic, messages that serve to engage the driver (Widmann, Salinger,
Dufour, and Green, 2011), or messages based on driver monitoring systems (Blanco et al., see Chapter 3; Hoeger et
al., 2011).
L3 automation requires the automation to assume a greater role for the safe operation of the vehicle, and the driver is
not expected to constantly monitor the road. Consequently, the requirements for vigilance and situation awareness are
reduced, but not eliminated, as compared with L2 automation. As drivers do not have to engage in driving, they may
become so involved in secondary tasks (e.g., eating, reading, watching entertainment, or perhaps even sleeping) that
they may entirely miss the transition message. In a driving simulator study, Carsten, Lai, Barnard, Jamson, and Merat
(2012) found that drivers in vehicles with combined ACC and LCS engaged in activities other than driving (e.g.,
eating, listening to the radio, watching DVDs, etc.) when the automation was active, and the level of inattention to the
driving environment increased proportionally with level of automation. Similarly, drivers in simulator and test track
experiments (Salinger, 2012) performed relatively risky tasks, such as cell phone talking, texting, and emailing;
watching DVDs; and reaching into the back compartment, during automated driving. Therefore, it may be of benefit
to understand the driver’s status before alerting them to a forthcoming transition. An important issue for L3
automation, then, is ensuring that the signal presented by the automation to inform drivers of the change of
automation is sufficiently salient, distinctive, and unambiguous that drivers are able to quickly and easily understand
the state of the automation.
Design Issues
Hoc, Young, and Blosseville (2009) assert that automation should be implemented as a human-automation
cooperative system rather than simply using a task-based framework. The goal of a cooperative system is to optimize
the driver’s task load in order to avoid driver overload or OOTL problems. The European HAVEit demonstration
project (Salinger, 2012) adopted a cooperative approach by integrating driver monitoring systems with incremental
levels of automation (L0 through L2). When driver state detection algorithms determined that drivers were drowsy or
inattentive, the system presented visual and/or auditory signals to capture drivers’ attention and bring them back into
the vehicle control or monitoring loop. Another approach to driver monitoring is to periodically provide a message to
which the driver must respond. Widmann, Salinger, Dufour, and Green (2011) used elbow switches, foot switches,
and steering wheel touch sensing as inputs to allow the driver to respond to these messages.
Cross References
Communicating Transfer of Control from Driver to System, 3-6; Communicating Transfer of Control from System to
Driver, 3-8; Message Complexity, 4-4; Developing and Maintaining Mental Models, 3-10; Chapter 5: Visual
Interfaces; Chapter 6: Auditory Interfaces; Chapter 7: Haptic Interfaces
Topic References
1. Blanco, M., Atwood, J., Vasquez, H. M., Trimble, T. E., Fitchett, V. L., Radlbeck, J., ... Morgan, J. F. (2015, August). Human factors
evaluation of level 2 and level 3 automated driving concepts (Report No. DOT HS 812 182). Washington, DC: National Highway Traffic
Safety Administration. Available at www.nhtsa.gov/sites/nhtsa.dot.gov/files/812182_humanfactorseval-l2l3-automdrivingconcepts.pdf
2. Salinger, J. (2012). Human factors for limited-ability autonomous driving systems. Retrieved from
http://onlinepubs.trb.org/onlinepubs/conferences/2012/Automation/presentations/Salinger.pdf
3. Hoeger, R., Zeng, H., Hoess, F., Kranz, T., Boverie, S., Straus, M., Jakobsson, E., … & Nilsson, A. (2011). The future of driving. Deliverable D61.1.
Final report. Version 1.0 (Report for the Highly Automated Vehicles for Intelligent Transport [HAVEit] 7th Framework Programme). Retrieved from
www.haveit-eu.org/displayITM1.asp?ITMID=24&LANG=EN
4. Kaber, D. B., & Endsley, M. R. (2004). The effects of level of automation and adaptive automation on human performance, situation awareness and
workload in a dynamic control task. Theoretical Issues in Ergonomics Science, 5(2), 113-153. doi: 10.1080/1463922021000054335
5. Stanton, N. A., Young, M. S., Walker, G. H., Turner, H., & Randle, S. (2001). Automating the driver’s control tasks. International Journal of Cognitive
Ergonomics, 5(3), 221-236.
6. Young, M. S., & Stanton, N. A. (2007). Back to the future: Brake reaction times for manual and automated vehicles. Ergonomics, 50(1), 46-58. doi:
10.1080/00140130600980789

35
7. Widmann, G., Salinger, J., Dufour, R., & Green, C. (2011). Human factors studies for limited-ability autonomous driving systems (LAADS).
Presentation at the SAE 2011 Government/Industry Meeting. Washington DC. Retrieved from www.sae.org/events/gim/presentations/2011.
8. Carsten, O., Lai, F. C. H., Barnard, Y., Jamson, A. H., & Merat, N. (2012). Control task substitution in semiautomated driving: Does it matter what
aspects are automated? Human Factors: The Journal of the Human Factors and Ergonomics Society, 54(5), 747-761. doi: 10.1177/0018720812460246
9. Hoc, J.-M., Young, M. S., & Blosseville, J.-M. (2009). Cooperation between drivers and automation: Implications for safety. Theoretical Issues in
Ergonomics Science, 10(2), 135-160.
Developing Driver Training Material for Automated Driving System Applications
Introduction
Training is the process by which we acquire knowledge and skill on specific topics, systems, or applications. Many
driver training programs have been developed by using curricula designers that “believe should be there” and have
been minimally influenced by contemporary findings from the behavioral sciences (Brock, McFann, Inderbitzen, &
Bergoffen, 2007). This topic summarizes recent findings from the behavioral research literature on several training
methods that could be used to train drivers on L2 and L3 automated driving systems. This DVI design topic may be
most applicable to automation applications that are especially novel or complex.
Design Goal (L2, L3): Systematically design, develop, and evaluate training for automated systems in a
manner consistent with the goals of the system.
Supporting Design Guidance
The best available research on this topic suggests that this design goal can be met when the following points are
considered:
Provide information on system functionality and system limits in a driver training program (Panou,
Bekiaris, & Touliou, 2010).
For complex systems with many features, variable priority training (VPT) may be used. In VPT,
trainees are presented a complex task divided into subtasks between which they vary their
attentional priority (Boot et al., 2010; Wickens, Hutchins, Carolan, & Cumming, 2013) (e.g.,
divide the task into Parts A and B. Start with the trainee devoting 80% of their attention to Part A
and 20% to Part B. Then, dedicate 20% to Part A and 80% to Part B. Finally, practice with 50%
attention to both.).
Use error-training as a strategy to reduce driver overconfidence in using an automated system and
to influence trainees to generate their own coping strategies for novel situations not covered in
training (Ivancic, & Hesketh, 2000).
Training on the use and function of in-vehicle systems occurs after novice drivers have obtained
the basic and rudimentary skills needed for safe-driving (Panou, Bekiaris, & Touliou, 2010).
Simple 5-stage iterative training design model (Graving, Easterlund, & Manser, 2011).
Content: During the initial design phases of developing a training curriculum, a first step is to obtain
training content and information about general training requirements. This can be obtained through
user interviews, use-case scenarios, focus groups, and task analyses. Literature searches can be useful
for preparing for user-testing and obtaining information about driver tasks (e.g., previous task
analyses, McKnight, & Adams, 1970). The other phases of the iterative design process can also be
used to generate content for training. Prototype: Start by generating simple prototypes (e.g., paper-
based drafts of a training manual) during this phase to test training concepts and ensure the training
Content
Prototype
Hand-off
Training
Test
Next
Cycle
• Literature Review
• Focus group
• One-to-ones
• Task analysis
• Testing
• Training Manual
• Simulator Scenarios
• Focus group
• Pilot test
• Train-the-trainers
• Observe training
36
content is appropriate. During subsequent iterations, generate more complex prototypes (e.g., pilot-
test class-room instruction or develop simulator-based scenarios) to test the functional aspects of the
training program—e.g., timetables for when certain topics are covered, methods of presentation.
Test: The process of testing a prototype can be useful for obtaining additional design requirements as
well as uncovering implementation issues. Testing can include observations of trainers carrying out
the training program.
Next Cycle: A decision phase where the testing results are used to decide if additional iterations are
required.
Hand-off Training: If testing indicates that iterations are no longer required, the training program is
ready to be handed off to trainers.
37
Discussion
While simpler automated systems may not require specific training, some more complex automated systems may
require initial training at vehicle delivery to ensure the driver has a minimum level of operating skills with the
automation prior to use. Training system development should be systematic, deliberate, and informed by research
findings from the instructional system design literature.
A training program may cover all features of the automation (especially if only a single type of automation is present
in the vehicle) or can entail different aspects of the system itself. Training sessions should focus on the functionality
of the system, including information on limitations (including when automation may not be activated or used) and
any potential for malfunction (Panou, Bekiaris, & Touliou, 2010). Such training programs could highlight any
significant limitation of the system for informing the driver of sudden hazards, as well as limitations based on sensing
technologies used. For instance, drivers should be made aware that the highway speed automation will not change
lanes to pass slower moving lead vehicles, or that the traffic jam assist feature will not remain active after a certain
continuous period of time above a set speed.
Training programs should also include information on how to read and interpret the DVI, methods for activating the
system, available action options for manual overrides and input during automated driving (e.g., accelerate, brake,
steer, or a combination of inputs), how the system reacts to manual inputs during automated driving, and what types
of control transfers may be encountered. Proper training should also provide drivers with the ability to transform and
incorporate declarative knowledge (e.g., knowledge about the system) into more automatic-like actions for using the
automation. Such behavioral skills can become relatively immune from deterioration in a broad range of contexts
(Rasmussen, 1983).
Different training strategies may be employed to ensure that drivers gain knowledge on and retain useful driving
strategies. The VPT strategy is an effective training strategy for complex tasks (Graving, Easterlund, & Manser,
2011). The method presents trainees with the whole task, which is maintained during training, but different
components are systematically emphasized or deemphasized to allow more attention to be focused on specific parts
while still preserving the necessary element of time-sharing of attention across the whole task (Wickens, Hutchins,
Carolan, & Cumming, 2013). Drivers trained with this strategy tend to learn faster and reach higher levels of mastery
compared with training programs that emphasize all components equally (Boot et al., 2010; Wickens, Hutchins,
Carolan, & Cumming, 2013). In addition, the error-training strategy where learners acquire information about a task
through exploration, testing self-generated hypotheses, and trial-and-error may be effective in reducing
overconfidence and can help drivers develop coping strategies for scenarios not covered in training (Ivancic, &
Hesketh, 2000).
In some cases, different training settings may be necessary. Drivers 70 to 89 years old benefit more after training is
complete when instructors provide feedback on actual driving in addition to classroom training (Porter, 2013). As
much as possible, training should provide drivers with an ability to manage the traffic events and scenarios presented
during training as well as novel events not encountered during training.
Design Issues
Large in-vehicle displays with additional computing capabilities are becoming more common, providing a potential
platform for embedded training (U.S. Army Training and Doctrine Command, 2003). Embedded training, or training
that is integrated into and provided by the vehicle, can offer drivers the opportunity for training, guided practice, and
coaching at any point in their use of the vehicle. As technologies continue to develop, embedded training may
become an efficient solution to training needs.
Cross References
Developing and Maintaining Driver Mental Models, 3-10
Topic References
1. Brock, J. F., McFann, J., Inderbitzen, R. E., & Bergoffen, G. (2007). Effectiveness of commercial motor vehicle driver training curricula and delivery
methods (CTBSSP Synthesis MC-13). Washington, DC: National Academy Press.
2. Panou, M. C., Bekiaris, E. D., & Touliou, A. A. (2010). ADAS module in driving simulation for training young drivers. Proceedings of the 13th
International IEEE Annual Conference on Intelligent Transportation Systems, 1582-1587.
3. Boot, W. R., Basak, C., Erickson, K. I., Neider, M., Simons, D. J., Fabiani, M., . . . Kramer, A. F. (2010). Transfer of skill engendered by complex task
training under conditions of variable priority. Acta Psychologia, 135, 349-357.
4. Wickens, C. D., Hutchins, S., Carolan, T., & Cumming, J. (2013). Effectiveness of part-task training and increasing-difficulty training strategies: A
meta-analysis approach. Human Factors, 55, 461-470.
5. Ivancic, K., & Hesketh, B. (2000). Learning from errors in a driving simulation: Effects on driving skill and self-confidence. Ergonomics, 43(12), 1966-
1984.
6. Graving, J. S., Easterlund, P. A., & Manser, M. M. (2011). Developing a bus driver training program for a driver assistive system. Proceedings of the
Human Factors and Ergonomics Society 55th Annual Meeting, 1543-1547.
7. McKnight, J., & Adams, B. (1970). Driver education and task analysis, Volume 1: Task descriptions (Report No. DOT HS 800 367). Washington DC:
National Highway Traffic Safety Administration.

38
8. Rasmussen, J. (1983). Skills, rules, and knowledge: Signals, signs, and symbols, and other distinctions in human performance models. IEEE
Transactions on Systems, Man, and Cybernetics, SMC-13(3), 257-266. doi: 10.1109/TSMC.1983.6313160
9. Porter, M. M. (2013). Older driver training using video and global positioning system technology—a randomized controlled trial. Journals of
Gerontology Series A: Biomedical Sciences and Medical Sciences, 68(5), 574-580. doi:10.1093/Gerona/gls160. Epub 2012 Aug 9
10. U. S. Army Training and Doctrine Command. (2003). Objective force embedded training (OFET): User’s functional description (TRADOC Pamphlet
No. 350-37). Fort Monroe, VA: Author.
Incorporating Etiquette Into the Design of Automated Systems
Introduction
This topic provides information on presenting the automation to the driver in a manner that may support a driver’s
calibrated trust of the automated system. A strategy, often referred to as etiquette, is a set of heuristics that may
enhance and improve a driver’s interaction with the system, possibly leading to higher levels of acceptance and
performance.
Design Goal (L2, L3): Provide driver-automation interactions that are interactive and collaborative in nature.
Supporting Design Guidance
Below is a list of considerations for designing automation that is collaborative and may support the driver-automation
interaction process. These considerations were adapted from work by Lee and Seppelt (2012), itself based on Miller
and Funk (2001). The “Corresponding Topics” column refers to a topic in this document that can provide more detail
on the consideration for designing with an etiquette approach. Considerations without a corresponding topic will be
discussed further in the Discussion section of this topic.
Considerations for Designing with an Etiquette Approach Corresponding Topics
a) Make it very easy for the driver to override the automation. Communicating Transfer of Control From
System to Driver (3-8)
b) Avoid enabling interaction features just because they are
possible.
Special Considerations for Level 2 and Level 3
Automation (3-12)
c) When appropriate, explain what is being done and why. Current Automation Mode and Status (3-2)
d) When appropriate, allow driver selection of what functions
are automated.
See Discussion (next page)
e) Be aware of what the driver is doing and avoid repeating or
providing gratuitous and unnecessary messages.
See Discussion (next page)
f) Use multiple modalities to communicate. Suitable Display Properties for Automation
Mode and Status Messages (3-4);
Multimodal Messages (4-8)
g) Be casual or informal only to the extent that it furthers the
driver-automation interaction.
See Discussion (next page)
39
Discussion
Using an etiquette approach in automation has been shown to be beneficial for human-automation interactions and
user task performance in various domains and various forms. The use of an etiquette approach can affect a user’s trust
or reliance on the automation system (Spain & Madhavan, 2009). The considerations listed on the previous page can
be followed to design an automation system with an etiquette approach. However, every system is different and this
is not a prescriptive approach to the driver-automation interaction. In all cases, designers should consider using the
approach that best fits the scenario (Miller & Funk, 2001). Below, the considerations without a corresponding topic
are discussed.
When appropriate, allow driver selection of what functions are automated: To facilitate a collaborative relationship
between the user and the automation system, the automation system should be able to take instruction from the user
about the activities it should be engaged in Miller and Funk (2001). Specifically, this means that the user should be
able to change the function allocation between him/herself and the automation to fit the current situation without
interference from the automation system.
Be aware of what the driver is doing and do not repeat or provide gratuitous and unnecessary messages: An example
of this etiquette approach can be found in L2 and higher levels of automation in which the automation system has
communicated the need for the driver to reclaim control of the vehicle by placing his/her hands on the steering wheel.
Once there is positive indication that the driver has assumed control, the automation should not send another take
over request to the driver. If this etiquette approach is not considered, drivers may not feel comfortable trusting the
automation system because it is telling him/her information he/she already knows or is aware of, which is not
assisting the driver any further than what they are already capable of without the automation. Results of a study by
Parasuraman and Miller (2004) show that users rated the automation system as “rude” when it offered redundant,
task-specific information because they felt like the system was telling them to “hurry up.” When utilized in a military
field exercise, minimizing interruptions from non-urgent messages at critical times enabled the soldier to maintain
performance on the most critical tasks (Dorneich, Ververs, Mathan, Whitlow, & Hayes, 2012).
Be casual or informal only to the extent that it furthers the driver-automation interaction: When introducing a new
form of guided interaction, developers have sometimes tried to be informal in the interaction format, such as the use
of the anthropomorphized Microsoft Office Assistant (Horvitz, 1999). While helpful in some domains, driving is a
serious, safety-critical activity and it is important to show a clear benefit to being casual, natural, or informal before
introducing unnecessary embellishments and extra information.
Cross References
Current Automation Mode and Status, 3-2; Suitable Display Properties for Automation Mode and Status Messages,
3-4; Communicating Transfer of Control from System to Driver, 3-8; Special Considerations for Level 2 and Level 3
Automation, 3-12; Multimodal Messages, 4-8
Topic References
1. Lee, J. D., & Seppelt, B. D. (2012). Human factors and ergonomics in automation design. In G. Salvendy (Ed.), Handbook of Human Factors
and Ergonomics, Fourth Edition (pp.1615-1642). Hoboken, NJ: Wiley & Sons.
2. Miller, C. A., & Funk, H. B. (2001). Associated with etiquette: Meta-communication to make human-automation interaction more natural,
productive, and polite. Proceedings of the 8th European Conference on Cognitive Science Approaches to Process Control. Munich, Germany.
3. Spain, R. D., & Madhavan, P. (2009). The role of automation etiquette and pedigree in trust and dependence. Proceedings of the Human
Factors and Ergonomics Society 53rd Annual Meeting, 339-343.
4. Parasuraman, R., & Miller, C.A. (2004). Trust and etiquette in high-criticality automated systems. Communications of the ACM, 47(4), 51-55.
5. Dorneich, M. C., Ververs, P. M., Mathan, S., Whitlow, S., & Hayes, C.C. (2012). Considering etiquette in the design of an adaptive system.
Journal of Cognitive Engineering and Decision Making, 6 (2), 243-265.
6. Horvitz, E. (1999). Principles of mixed-initiative user interfaces. Proceedings of CHI ’99, ACM SIG-CHI Conference on Human Factors in
Computing Systems, Pittsburgh, PA.
40
Chapter 4. Message Characteristics
This chapter provides design guidance for developing messages that are effective for both safety
and non-safety applications. For safety messages, in particular for situations where the driver is
not actively monitoring the forward roadway or driving situation (as in L3 automation), drivers
need to respond quickly at a time when the driving situation could potentially require high
cognitive demand. Research suggests that messages presented under these conditions are most
effective when they capture drivers’ attention without being distracting, are clear and easily
understood, aid the driver in focusing attention on the roadway and/or the potential hazard, and
support the driver in making an appropriate response. In addition to safety messages, it is
expected that non-critical messages may also be presented on integrated displays. Central displays
in passenger vehicles may include integrated “infotainment” and navigation applications. The
guidelines in this chapter discuss the issues associated with DVI messages and how to present
them in a way that will enhance safety and optimize driver responses.
The following topics are included in this chapter.
• Designing Messages for Driver Comprehension
• Message Complexity
• Selection of Sensory Modality
• Multimodal Messages

41
Designing Messages for Driver Comprehension
Introduction
This topic provides guidance for enhancing the comprehensibility of messages. Comprehension refers to the
perceptual and cognitive processes by which drivers interpret the meaning of a message presented through a DVI.
Broader conceptual frameworks that address the comprehension of in-vehicle messages are scarce, but such a process
for design and evaluation is described by Campbell, Richman, Carney, and Lee (2004), which can give a foundation
for this topic.
Design Goal (L2, L3): Develop and present messages that support accurate and timely comprehension by the
driver.
Supporting Design Guidance
The best available research on this topic suggests that this design goal can be met if the following questions are
considered when designing messages:
Design considerations for each stage of message comprehension.
Stage of Message
Comprehension
Key Design Parameters to Consider
Extraction*
Visual messages: Character or symbol height, font, character height-to-
width/stroke-width/spacing ratios, luminance and luminance uniformity,
contrast, color, text labels (for icons and symbols).
Auditory messages: Sound level, display type, loudness, fundamental
frequencies, pitch.
Haptic messages: Type, location, amplitude/intensity/frequency.
Recognition
Temporal characteristics, level of realism and detail (for icons &
symbols), flash rate.
Interpretation
Use of color, cues to relative urgency, cues to external locations
(e.g., sound localization), use of combined cues/messages (e.g., an
auditory tone that accompanies a visual alert).
*Legibility for visual messages, complete and accurate perception of auditory and haptic messages.
42
Discussion
Developing effective in-vehicle messages requires a conceptual approach that applies a theoretical understanding of
driver perception and performance. As discussed in Campbell, Richman, Carney, and Lee (2004), there are three
stages associated with message comprehension and use: extraction, recognition, and interpretation. Extraction reflects
the relationships among the driver, the message, and the environment, and is essential for a complete and accurate
perception of the message. Recognition reflects the relationships among the driver, the message, and other messages
or message elements. Interpretation reflects the relationships among the driver, the message, and the referent or
underlying meaning associated with the message.
Also, as a result of familiarity, comprehension will be more likely when internationally agreed-upon icons, symbols,
words, acronyms, and abbreviations are used in the DVI (Alliance of Automobile Manufacturers, 2006)..
Design Issues
Factors affecting comprehension: Message comprehension is affected by several factors including: semantic
organization and complexity of the message, the context in which the message is presented, drivers’ familiarity with
the message, driver expectations and experience, memory limits, and workload. Familiarity has been found to be
strongly associated with comprehension. A study reported by NHTSA (2011) found that drivers responded more
slowly to a driving event (e.g., forward collision event) when they experienced an unfamiliar auditory alert. In some
cases, this difficulty remained even after reading the user manual. In short, after exposure and extended use, drivers
can learn to comprehend virtually any message. While even “bad” messages can eventually be effective, however,
they may promote errors, require training, or involve extensive trial-and-error learning.
Testing comprehension: Comprehension tests are evaluation techniques that provide a means to determine whether a
candidate message design is likely to be properly understood by typical roadway users. Several procedures can be
used to measure driver comprehension of messages, including SAE J2830 Process for Comprehension Testing of In-
vehicle Icons, which is an SAE Information Report within the SAE Standards series (SAE J2830, 2008). Given the
possible complexity of in-vehicle messages and the real possibility of multiple safety systems within a vehicle that
can present safety-critical information to the driver, it is also necessary to evaluate integrated warning systems.
Cullinane and Kirn (2012) describe a laboratory methodology that can help identify comprehension/distinguishability
issues prior to full system development in a controlled, repeatable, and safe setting.
Cross References
Developing Driver Training Material for Automated Driving System Applications, 3-14; Message Complexity, 4-4
Topic References
1. Campbell, J. L., Richman, J. B., Carney, C., & Lee, J. D. (2004). In-vehicle display icons and other information elements, Volume I:
Guidelines (Report No. FHWA-RD-03-065). McLean, VA: Federal Highway Administration. Retrieved from
www.fhwa.dot.gov/publications/research/safety/03065/index.cfm
2. Alliance of Automobile Manufacturers (AAM). (2006). Statement of principles, criteria and verification procedures on driver interactions
with advanced in-vehicle information and communication systems, including 2006 updated sections [Report of the Driver Focus-Telematics
Working Group]. Retrieved from www.autoalliance.org/index.cfm?objectid=D6819130-B985-11E1-9E4C000C296BA163
3. National Highway Traffic Safety Administration. (2011). Crash warning interface metrics, Phase 2 (Traffic Safety Facts Vehicle Safety
Research Note. Report No. DOT HS 811 471). Washington, DC: Author.
4. SAE J2830. (2008). Process for comprehension testing of in-vehicle icons. Warrendale, PA: SAE International.
5. Cullinane, B., & Kirn, C. (2012). Timely comprehension: A methodology for evaluating integration of in-vehicle warning systems. Presented
at SAE 2012 World Congress & Exhibition. doi:10.4271/2012-01-0100

43
Message Complexity
Introduction
This topic provides information on design characteristics that affect the complexity of messages. Specifically, it
provides a discussion of driver needs associated with message complexity and identifies characteristics of visual,
auditory, and haptic messages that affect complexity. While there is limited research specifically examining this topic
in L2 and L3 automated driving systems, designing interfaces with an understanding of well-established guidance
from past DVI research is advisable. Message complexity refers to the quantity and variety of basic information
elements contained within a message, as well as the relationships between these elements. Message complexity is an
important topic in DVI design, as messages that are too complex may not be properly perceived, comprehended, or
acted upon by the driver. The information in this topic can be used by designers to determine the level of complexity
that is appropriate for a DVI message and to implement DVI messages that are appropriately complex.
Design Goal (L2, L3): Present messages to the driver in the simplest form possible so the driver can readily
perceive, comprehend, and act upon the information.
Supporting Design Guidance
The best available research on this topic suggests that this design goal can be met when:
In General, information is presented in as simple of a manner as possible while ensuring messages
support and add value for the driver.
Visual Messages consist of simple icons and fonts with only the necessary detail included. In text
displays, the number of lines of text per-message is minimized.
Auditory Messages are simple when an immediate response is required. This could be single or
grouped frequencies presented simultaneously; such as a simple tone that consists of a square wave.
Haptic Messages are simple and perceptible. Research relevant to the topic of haptic message
complexity is limited.
Number of glances as a function of message complexity (McDougall, Tyrer, & Folkard, 2006).
Data recreated from Hoffman, Lee, McGehee, Marcias, and Gellatly (2005). Visual sampling of in-vehicle text messages: Effects of number of
lines, page presentation, and message. In Transportation Research Record: Journal of the Transportation Research Board, No. 1937, Figure 2, p. 25
and Figure 3, p. 26. Copyright, National Academy of Sciences, Washington, DC, 2005. Reproduced with permission of the Transportation
Research Board.
Automatic
Manual
Mea n Number of Glances
Line/Page
1 Line
Line Page
2 Lines
Line Page
4 Lines
Automatic
Manual
Mean Glance Duration(s)
Line/Page
1 Line
Line
Page
2 Lines
Line
Page
4 Lines
44
Discussion
Complexity in DVI messages generally refers to the amount of information provided in the message, but must also
include consideration of how the information will be used by the driver as well as the value of the information to the
driver.
Overall, the consequences of presenting DVI messages to the driver that are too complex can include:
disruption of attention toward the driving task (potentially an issue during transitions between automated and manual
driving), increased eyes-off-road time, increased driver workload and possible distraction, and increased response
time to critical road events.
Complexity in visual messages: Increasing the complexity of DVI messages increases cognitive demand. In Hoffman
et al. (Hoffman, Lee, McGehee, Marcias, & Gellatly 2005), a medium-fidelity simulator was used to examine how
message complexity (the number of text lines of a message) influenced visual sampling behaviors. Mean glance
duration, variability of glance duration, and the number of glances greater than two seconds all increased as the
number of lines of textual messages displayed. Visual demand was especially increased when the scrolling was
manually controlled by the driver. In another study (McDougall, Tyrer, & Folkard, 2006), the speed with which
participants searched icon arrays for a target was slower when icons were visually complex and when information
features in icons were not grouped together to form a single object. In general, icons should be simple, with only the
necessary detail included. Excessive and unnecessary amounts of detail contribute to clutter and can lead to slower
and poorer comprehension (see also Campbell, Richman, Carney, & Lee, 2004, and Easterby, 2007). These findings
are consistent with those from basic research going back at least 40 years that investigated—for example—reading
performance as a function of various characteristics of the visual stimuli (Rayner, Pollatsek, & Alexander, 2005).
Complexity in auditory messages: Simple tones are good for gaining the attention of the driver and, if properly
implemented, can be used effectively to warn of an imminent danger. Simple tones have also been shown to produce
shorter reaction times than speech messages when used in conjunction with a visual display (Kiefer, LeBlanc,
Palmer, Salinger, Deering, & Shulman, 1999). A recommendation from the CityMobil project was to limit auditory
message length to 3 or 4 information units, with messages requiring immediate reactions being as short as possible
(Martens et al., 2008). Based on the limited research in the topic, it is prudent to rely upon prior research findings and
guidance (Kiefer, LeBlanc, Palmer, Salinger, Deering, & Shulman, 1999) and limit complex auditory messages to
non-time critical situations.
Complexity in haptic messages:
Research on haptic displays in automobiles is relatively recent and has focused on
understanding what makes haptic displays perceivable to the driver and which kind of haptic warning is most
compatible with the driver response appropriate for the driving hazard (see also Lerner, Kotwal, Lyons, & Gardner-
Bonneau, 1996).
Design Issues
Reducing unnecessary message complexity is challenging in situations where multiple forms of vehicle automation
capabilities operating at multiple automation levels (e.g., L2 highway speed driving assist and L3 traffic jam assist)
are included.
Inadvertent increases in message complexity can occur in the vehicle as automation capabilities are included without
integrating the DVI components in a way that supports safe driver behaviors. In the context of discussing some
challenges to building and maintaining situational awareness in complex systems, Endsley (2012) discusses the
problem of “complexity creep,” referring to the practice of adding features and capabilities over time to systems, and
how such practices complexity can reduce the interpretability of information, reduce the predictability of the system,
and slow response time.
Cross References
Designing Messages for Driver Comprehension, 4-2; Selecting Character Height for Icons and Text, 5-10
Topic References
1. Hoffman, J. D., Lee, J. D., McGehee, D. V., Macias, M., & Gellatly, A. W. (2005). Visual sampling of in-vehicle text messages: Effects of number of
lines, page presentation, and message control. Transportation Research Record: Journal of the Transportation Research Board, 1937, 22-30.
2. McDougall, S., Tyrer, V., & Folkard, S. (2006). Searching for signs, symbols, and icons: Effects of time of day, visual complexity, and grouping.
Journal of Experimental Psychology, 12(2), 118-128. doi: 10.1037/1076-898X.12.2.118
3. Campbell, J. L., Richman, J. B., Carney, C., & Lee, J. D. (2004). In-vehicle display icons and other information elements, Volume I: Guidelines (Report
No. FHWA-RD-03-065). McLean, VA: Federal Highway Administration. Retrieved from
www.fhwa.dot.gov/publications/research/safety/03065/index.cfm
4. Easterby, R.S. (1970). The perception of symbols for machine displays. Ergonomics, 13(1), 149-158.
5. Kiefer, R., LeBlanc, D., Palmer, M., Salinger, J., Deering, R., & Shulman, M. (1999). Development and validation of functional definitions and
evaluation procedures for collision warning/avoidance systems (DOT HT 808 964). Washington, DC: National Highway Traffic Safety Administration.
6. Martens, M., Pauwelussen, J., Schieben, A., Flemisch, F., Merat, N., Jamson, A. H., & Caci, R. (2008). Human factors’ aspects in automated and semi-
automatic transport systems: State of the art (Report 3.2.1). Brussels: European Commission.

45
7. Lerner, N. D., Kotwal, B. M., Lyons, R. D., & Gardner-Bonneau, D. J. (1996, January). Preliminary human factors guidelines for crash avoidance
warning devices (Report No. DOT HS 808 342). Washington, DC: National Highway Traffic Safety Administration. Available at
https://archive.org/stream/preliminaryhuman00lern#page/n1/mode/2up
8. Endsley, M. R. (2012). Situation awareness. In G. Salvendy (Ed.), Handbook of Human Factors and Ergonomics, Fourth Edition (Chapter 19).
Hoboken, NJ: John Wiley & Sons.
9. Rayner; K., Pollatsek, J., & Alexander, B. (2005). Eye movements during reading. In M. J. Snowling & C. Hulme (Eds.), The Science of Reading: A
Handbook (pp. 79–97). Oxford, UK: Blackwell Publishing. doi: 10.1002/9780470757642.ch5
Selection of Sensory Modality
Introduction
This topic provides heuristics and a discussion of relevant literature to support the selection of sensory modalities
(i.e., visual, auditory, or haptic) for presenting messages in the vehicle environment. The mode of presentation can
influence driver responses and behavior. The type of modality that is appropriate for a message depends on the
driving environment (e.g., expected vehicle/cab noise and vibration, hazard scenario), the criticality of the message
(e.g., hazard vs. non-hazard situations), location of visual displays, and other factors. Further, based on current
industry trends, it is expected that many messages in L2 or L3 automated systems will be multimodal (presenting an
auditory or haptic message accompanied by a visual message). In general, much more research and analyses are
available on visual and auditory messages than on haptic. Also, haptic messages share many of the advantages and
limitations as auditory messages. This topic provides information that will help designers determine which
presentation modes are most appropriate for various messages.
Design Goal (L2, L3): Match the modality of messages with driver tasks, needs, and expectations in order to
enhance drivers’ comprehension and performance.
Supporting Design Guidance
The best available research on this topic suggests the following:
Visual messages are best for presenting more complex information that is non-safety-critical and does not call for
immediate action, and can be used to:
Provide continuous lower-priority information such as automation status, navigation-related, or
cautionary information.
Provide spatial information. In this regard, head-up displays (HUDs) and high head-down displays
(HHDDs) also have potential for presenting critical information, especially if the message has a
spatial component. (e.g., location in space relative to the driver’s vehicle).
Provide redundant or supplemental information that accompanies auditory or haptic messages.
Auditory messages are capable of quickly capturing the driver’s attention and can be used to:
Present short, simple messages requiring quick or immediate action.
Present high priority alerts and warnings (e.g., take control messages); in this instance, can be used
in conjunction with visual or haptic messages to provide redundant cues to the driver.
In an L2 system, provide an important message to drivers in situations in which they may be
distracted or looking away from a visual display (note: this may apply to haptic messages as well).
Indicate the onset of a system notification, malfunction, or limitation.
Haptic messages are capable of quickly capturing the driver’s attention and can be used if:
It is likely that the driver is in contact with the haptic display source (e.g., drivers will usually feel
a seat vibration, but will likely not be in contact with the pedal assembly or steering wheel during
L2 or L3 automated operation).

46
Discussion
Much has been written on the selection of visual versus auditory modes for various types of driving information and
signals. Many authors have relied on the original work of Deatherage (1972), who laid out a series of useful rules for
assisting designers in this task. The table below lists the original eight rules providing guidance for the selection of
auditory and visual mode presentations.
General rules for selecting auditory vs. visual display modes (Deatherage, 1972).
Use Auditory When…
Use Visual When…
The message is simple.
The message is complex.
The message is short.
The message is long.
The message will not be referred to later.
The message will be referred to later.
The message deals with events in time.
The message deals with locations in space.
The message calls for immediate action.
The message does not call for immediate action.
The visual system is overburdened.
The auditory system is overburdened.
The receiving location is too bright or dark.
The receiving location is too noisy.
The user must move about.
The user can stay in one place.
Most research on automotive displays focus on presenting safety-critical messages. While this is applicable for
presenting safety-critical information in automated driving systems (particularly in L2 operations), research is needed
to understand how to optimally present non-safety critical information.
The advantage of auditory and haptic displays is that they are omnidirectional signals that can command attention
regardless of where the driver is looking. In a simulator study, Stanley (2006) examined haptic, auditory, and
multimodal (haptic and auditory) displays for a lane departure warning (LDW) system. Drivers in the haptic modality
had faster reaction times than either auditory or multimodal modalities, and perceived the haptic display to be less
annoying. However, driver trust and overall preference was highest for the multimodal display. Similar findings have
been reported in other simulator studies (Scott & Gray, 2008). Likewise, a study of L2 vehicles found that drivers
both reacted and took control of the vehicle faster when receiving multimodal (visual and haptic) alerts as compared
to visual-only alerts (Blanco et al., 2015; see Chapter 2). Further research is needed to understand the implications of
using haptic displays in automotive settings, especially in non-safety critical displays.
Design Issues
Most of the relevant literature (Kiefer et al., 1999; ISO [ISO/TR 16352}, 2005; Campbell, Richman, Carney, & Lee,
2004) suggests that operator performance can be improved by combining auditory and visual messages when
presenting warnings. In addition to the above, Williges and Williges (1982) have pointed out another advantage of
visual versus auditory presentation. That is, that a visual message can be referred to until it is understood and
“encoded,” not simply referred to again later to aid with memory; an auditory signal, in contrast, is heard once
(typically), and if it is not comprehended at that time, there is not a second chance for encoding.
Cross References
Multimodal Messages, 4-8; Chapter 5: Visual Interfaces; Chapter 6: Auditory Interfaces; Chapter 7: Haptic
Interfaces
Topic References
1. Deatherage, B. H. (1972). Auditory and other sensory forms of information presentation. In H. P. Van Cott & R. G. Kinkade (Eds.), Human
engineering guide to equipment design (rev. ed.) (pp. 123-160). Washington, DC: U.S. Government Printing Office.
2. Stanley, L. M. (2006). Haptic and auditory cues for lane departure warnings. Proceedings of the Human Factors and Ergonomics Society
Annual Meeting, 50, 2405-2408. doi: 10.1177/154193120605002212
3. Scott, J. J., & Gray, R. (2008). A comparison of tactile, visual, and auditory warnings for rear-end collision prevention in simulated driving.
Human Factors, 50(2), 264-275. doi: 10.1518/001872008X250674
4. Blanco, M., Atwood, J., Vasquez, H. M., Trimble, T. E., Fitchett, V. L., Radlbeck, J., ... Morgan, J. F. (2015, August). Human factors
evaluation of level 2 and level 3 automated driving concepts (Report No. DOT HS 812 182). Washington, DC: National Highway Traffic
Safety Administration. Available at www.nhtsa.gov/sites/nhtsa.dot.gov/files/812182_humanfactorseval-l2l3-automdrivingconcepts.pdf
5. Kiefer, R., LeBlanc, D., Palmer, M., Salinger, J., Deering, R., & Shulman, M. (1999). Development and validation of functional definitions
and evaluation procedures for collision warning/avoidance systems (Report No. DOT HT 808 964). Washington, DC: National Highway
Traffic Safety Administration.
6. International Organization for Standardization. (2005). Road vehicles—Ergonomic aspects of in-vehicle presentation for transport information
and control systems—Warning systems (ISO/TR 16352). Geneva: Author.
7. Campbell, J. L., Richman, J. B., Carney, C., & Lee, J. D. (2004). In-vehicle display icons and other information elements, Volume I:
Guidelines (Report No. FHWA-RD-03-065). McLean, VA: Federal Highway Administration.

47
8. Williges, B. H., & Williges, R. C. (1982). Structured human/computer dialogue using speech technology. Proceedings of the Workshop on
Standardization for Speech I/O Technology (pp. 143-151). Gaithersburg, MD: National Bureau of Standards.
Multimodal Messages
Introduction
A multimodal DVI consists of more than one type of signal from the visual, haptic, and auditory modalities and is
quite suitable for delivering messages to drivers. This topic provides information on how to create multimodal driver
messages.
Design Goal (L2, L3): Present simultaneous auditory, haptic, or visual signals that enhance driver messages
and are quickly and reliably detected by the driver.
Supporting Design Guidance
The best available research on this topic suggests that this design goal can be met when:
Safety-critical messages are multimodal (either bimodal or trimodal), and consist of an effective
combination of auditory, haptic, or visual signals.
Non-safety critical messages are presented in a multimodal fashion in order to increase the likelihood
of the driver receiving the message.
Multiple, simultaneously activated, signals are used to enhance temporal redundancy, maximizing the
likelihood a driver will receive an alert (Fricke, 2007; Hecht & Reiner, 2009).
If used as an alert, visual components of a multimodal message can persist beyond the duration of
auditory or haptic signals to provide post-alert information regarding the nature of the alert (ISO,
2005).
A sequential change in modality is used for different stages of a graded system—e.g., an early
auditory tone alert to call driver attention to a less invasive signal like a visual display.
Example considerations for specific functions of different display types used for a
multimodal display that deliver imminent warning messages.
Modality
Description
Visual
Displays
Head-up Display (HUD): Used in conjunction with auditory or haptic alerts to encourage drivers to
attend to the forward roadway in safety critical situations (Lind, 2007); safety concerns may arise if HUD
images block the driver’s view of forward hazards.
High Head-down Display (HHDD): Used to improve noticeability of the visual aspects of a message for
drivers who are unable to hear or feel the signals from the other modalities that are used (ISO, 2005).
Low Head-down Display (LHDD): Used to present visual messages; these are paired with auditory or
haptic signals (ISO, 2005). For safety critical messages, the presentation period may begin after the
warning criterion is no longer exceeded, following an auditory or haptic signal (ISO, 2005).
Instrument Panel (IP) Display: Used to present visual messages. However, the use of this space as part
of a multimodal display for safety critical information is not recommended (Perez, Kiefer, Haskins, &
Hankey, 2009; SAE J2400, 2003).
Auditory
Displays
Speech Messages: Speech can also be used to supplement or more clearly indicate information provided
in a visual or haptic display, such as providing messages or instruction to the driver.
Simple Tones (Conventional Auditory): Simple tones are commonly paired with haptic and visual.
Spatial messages using simple tones are enhanced greatly when coupled with spatial haptic messages
(e.g., Fitch, Kiefer, Hankey, & Kleiner, 2007).
Haptic
Displays
Vibrotactile Seat: Commonly paired with auditory or visual displays, e.g., the addition of audio or visual
displays may facilitate driver comprehension of more complex vibrotactile seat displays.
Other Haptic/Tactile Displays: May be implemented as part of a multimodal warning system. However,
limited research is available regarding the use of seat belt pre-tensioning or brake pulses as a component
of a multimodal display.
48
Discussion
Many vehicle displays are bimodal and can present both visual and auditory signals. A bimodal presentation scheme
can be employed for in-vehicle tell-tale messages using a tone, to alert the driver to a system issue, coupled with a
visual component (e.g., the tell-tale visual icon) to convey the nature of the system problem (ISO, 2005). The use of
multimodal displays may also help ensure messages are delivered to drivers with unisensory deficits (e.g., older
populations; see Laurienti, Burdette, Maldjian, & Wallace, 2006) or drivers who are not engaged with the driving
task (e.g., distracted or operating in highly automated conditions).
Auditory and haptic signals are beneficial when used to deliver a message for a multimodal display because they are
detectable even when drivers are glancing away from the roadway or information displays. A study comparing
visual-only to combination visual and haptic messages in L2 vehicles demonstrated that drivers reacted and took
control of the vehicle faster when receiving multimodal take control messages (Blanco et al., 2015, see Chapter 2).
Visual messages can serve as “back-up” communication channels if there is high ambient noise/vibration or if a
driver is hearing impaired, as well as a method for portraying the nature of the alert (ISO, 2005).
The reference to Fitch, Kiefer, Hankey, and Kleiner (2007) is included because their results were obtained using
laboratory methods that have broader application. They investigated a multimodal presentation format for providing
directional alerts for collision avoidance systems and had their participants simply indicate the direction participants’
felt the interface was indicating.
Design Issues
Correspondence and Redundancy: Forming a full correspondence between stimuli across multiple modalities that are
not normally associated with one another is unlikely to occur without significant training (Spence, Ngo, Lee, & Tan,
2010) or experience. Therefore, messages need to be intuitive and easily learned so that drivers can straightforwardly
begin to integrate multimodal signals over time. For higher priority messages, early timing is recommended to give
drivers adequate time for processing and responding to multimodal displays that deliver complex messages (e.g.,
spatial cues). Redundant temporal cues (e.g., simultaneous signals at the same time) may be adequate to pique the
attention of a driver.
Cross References
Developing Driver Training Material for Automated Driving System Applications, 3-14
Topic References
1. Fricke, N. (2007). Effects of adaptive information presentation. Proceedings of the 4th International Driving Symposium on Human Factors in
Driver Assessment, Training and Vehicle Design, 292-298.
2. Hecht, D., & Reiner, M. (2009). Sensory dominance in combinations of audio, visual and haptic stimuli. Experimental Brain Research, 193,
307-314.
3. International Organization for Standardization. (2005). Road vehicles—Ergonomic aspects of in-vehicle presentation for transport information
and control systems—Warning systems (ISO/TR 16352). Geneva: Author.
4. Lind, H. (2007). An efficient visual forward collision warning display for vehicles (SAE Technical Paper 2007-01-1105). Warrendale, PA:
SAE International. doi:10.4271/2007-01-1105.
5. Perez, M. A., Kiefer, R. J., Haskins, A., & Hankey, J. M. (2009). Evaluation of forward collision warning system visual alert candidates and
SAE J2400. SAE International Journal of Passenger Cars- Mechanical Systems, 2(1), 750-764. doi:10.4271/2009-01-0547
6. SAE J2400 (2003). Human factors in forward collision warning systems: Operating characteristics and user interface requirements.
Warrendale, PA: SAE International.
7. Fitch, G. M., Kiefer, R. J., Hankey, J. M., & Kleiner, B. M. (2007). Toward developing an approach for alerting drivers to the direction of a
crash threat. Human Factors, 49(4), 710-720.
8. Laurienti, P. J., Burdette, J. H., Maldjian, J. A., & Wallace, M. T. (2006). Enhanced multisensory integration in older adults. Neurobiology of
Aging, 27, 1155-1163.
9. Blanco, M., Atwood, J., Vasquez, H. M., Trimble, T. E., Fitchett, V. L., Radlbeck, J., ... Morgan, J. F. (2015, August). Human factors
evaluation of level 2 and level 3 automated driving concepts (Report No. DOT HS 812 182). Washington, DC: National Highway Traffic
Safety Administration. Available at www.nhtsa.gov/sites/nhtsa.dot.gov/files/812182_humanfactorseval-l2l3-automdrivingconcepts.pdf
10. Spence, C., Ngo, M. K., Lee, J.-H., & Tan, H. (2010). Solving the correspondence problem in haptic/multisensory interface design. In M. H.
Zadeh (Ed.). Advances in Haptics (pp. 47-74). Available from: www.intechopen.com/books/advances-in-haptics/solving-thecorrespondence-
problem-in-haptic-multisensory-interface-design
49
Chapter 5. Visual Interfaces
This chapter contains topics on visual displays. The visual modality is of primary importance in
the driving task, and is amenable to the use of various sensory dimensions such as color,
luminance and contrast, as well as stimulus dimensions such as location, size and shape and
periodicity (e.g., flashing). Additionally, vision is the channel for presenting written information,
and so is appropriate for messages from the vehicle automation involving semantic content that
benefits from persistence, as distinct from auditory linguistic warnings, which tend to be obtrusive
if they persist.
While vision provides a rich field for information coding and potentially complex messages that
can help interpret messages provided by the DVI of automated driving systems, some challenges
must be addressed in order to ensure their effectiveness. Visual warnings must be seen to be
effective, and placing them in optimal locations in the cab can facilitate rapid detection of visual
signals and promote faster responses to them. In addition, characteristics such as display type,
color, size, spacing, and temporal characteristics (e.g., flashing or apparent motion) can be chosen
to maximize the conspicuity, legibility, and comprehensibility of warning messages.
Glare from strong light sources presents another challenge to visibility, conspicuity, and legibility
of warning messages. Effective warnings depend on the display having sufficient contrast that
drivers can easily detect and read the images presented thereon. Glare on the display reduces the
contrast of images presented on the display, while glare emanating from the display reduces
contrast sensitivity in the eye. Both sources of glare can potentially reduce the effectiveness of
warning displays by limiting the visibility of messages. This chapter discusses methods for
mitigating glare, both on the display and from the display, in order to prevent loss of contrast.
Head-up displays have the potential to provide drivers with critical, forward-oriented information
while minimizing glance times away from the forward roadway scene, potentially reducing eye
movement and accommodation time. Images presented on the HUD, however, have the potential
to be distracting and can partially occlude important visual cues outside the cab. Consequently,
warning displays presented on HUDs should be designed with care. Nevertheless, the HUD can
be an effective display for presenting time-critical messages.
Design topics addressed in this chapter:
• Locating a Visual Display
• Display Glare
• Head-Up Displays
• Using Color
• Selecting Character Height for Icons and Text
• Temporal Characteristics of Visual Displays

50
Locating a Visual Display
Introduction
The location of a visual display is a key factor affecting the ease with which drivers can obtain information. The
placement of the visual component of a DVI will facilitate access to the information. The main focus of this topic is
locations for visual displays, some attention is devoted to techniques to minimize glare for increased readability.
Design Goal (L2, L3): Place the visual interface in a location that facilitates rapid extraction of information
while minimizing eyes-off-road glances and negative impacts on driving performance.
Supporting Design Guidance
The best available research on this topic suggests that this design goal can be met when:
Critical displays for continuous vehicle control or critical warnings related to vehicle forward path are
within ±15 degrees of the central line of sight but as close to the central line of sight as practicable.
ISO (1984) recommends that messages that require immediate detection be located within 5 degrees
of the forward view when possible.
Displays are designed and located to minimize glare from external sources or other displays in the
vehicle (e.g., in the instrument panel or under a protective cover.
Examples of potential visual display locations (indicated by red squares and callouts).
Display Locations in Image:
A. Head-Up Display
B. High Head-Down Display
C. Head-Down Display/Instrument Panel
D. Center Console
51
Discussion
In general, placing a visual display near the forward line of sight to the primary driving task may increase the
likelihood that it will be seen, and will reduce the time needed to glance at that information, when drivers are looking
out of the windscreen. The example display location of 15 degrees within the line of is taken from the ComSIS
preliminary guidelines (Lerner, Kotwal, Lyons, & Gardner-Bonneau, 1996), but the relevance to L2 and L3
automated driving has yet to be validated. ISO (2005) recommends that visual displays intended to send critical
messages to the driver be located as near to the driver’s line of sight as possible, particularly if color is used. ISO
(1984) recommends that critical visual messages that require immediate detection should be located within 5 degrees
of the driver’s line of sight.
Lind (2007) compared a collision warning HUD displayed in the central driver view in response to critical road
hazards, with displays on the upper dashboard (HHDD), instrument cluster, and a steering wheel array of light
emitting diodes (LEDs). This study involved a strictly visual HUD, i.e., there was no associated auditory cue. The
salient attentional signal was flashing of the LED matrix (presenting at 4 Hz for 1.2 s). This type of HUD is different
than more conventional implementations of HUDs, which may use alphanumerics, graphics or icons.
Design Issues
Although there is limited research on locations for L2 and L3 automated driving system messages exists, it can
generally be assumed that drivers will expect key visual information to be presented in the general vicinity of the
instrument panel. However, existing guidance is based upon the assumption that the driver is generally looking
towards the forward roadway. L3 automated driving systems operate with the assumption that drivers will not be
looking towards the road [5], and extended eyes off road time is possible in L2 operations. Further research is needed
as to how drivers sample information from displays during both L2 and L3 automated driving.
Cross References
Multimodal Messages, 4-8
Topic References
1. International Organization for Standardization (ISO) (1984). Development and principles for application of public information symbols.
(ISO/TR 7239). Geneva: Author.
2.
Lerner, N. D., Kotwal, B. M., Lyons, R. D., & Gardner-Bonneau, D. J. (1996, January). Preliminary human factors guidelines for crash avoidance
warning devices (Report No. DOT HS 808 342). Washington, DC: National Highway Traffic Safety Administration. Available at
https://archive.org/stream/preliminaryhuman00lern#page/n1/mode/2up
3. International Organization for Standardization. (2005). Road vehicles—Ergonomic aspects of in-vehicle presentation for transport information
and control systems—Warning systems (ISO/TR 16352). Geneva: Author.
4. Lind, H. (2007). An efficient visual forward collision warning display for vehicles (SAE Technical Paper 2007-01-1105). Warrendale, PA:
SAE International. doi:10.4271/2007-01-1105
5. Llaneras, R. E., Salinger, J., & Green, C. A. (2013). Human Factors issues associated with limited ability autonomous driving systems:
Drivers' allocation of visual attention to the forward roadway. Proceedings of the International Driving Symposium on Human Factors in
Driver Assessment, Training, and Vehicle Design, 7, 92-98.
Display Glare
Introduction
Glare on visual displays can originate from a variety of sources in the driving environment and can make visual
displays difficult to read. In addition, light emanating from displays can be glaring at night causing discomfort, or in
some conditions, reduced visibility of the external driving environment. This topic discusses ways to mitigate both the
reduced legibility and conspicuity of display information due to glare on the display and the reduced visibility of the
environment and increased physical discomfort caused by glare from in-vehicle displays.

52
Design Goal: Minimize glare, both on and from, visual displays.
Supporting Design Guidance
The best available research on this topic suggests that this design goal can be met through the following strategies:
Mitigating glare on the display in daytime driving:
Provide sufficient display luminance and use high contrast display technologies to ensure adequate
contrast.
Place safety-critical displays in a location that minimizes exposure of the display sunlight.
Use designs or locations that provide shading, such as a cowling or an inset bezel.
Use anti-glare coatings or films to filter incoming light and reduce glaring reflections from the
display.
In some configurations, smaller display sizes can be easier to shade; however, care must be taken to
ensure that other important design considerations, such as symbol size and conspicuity, are not
compromised.
Mitigating glare that emanates from the display while driving in darkness:
Provide a control that allows drivers to adjust the display intensity but do not allow drivers to turn the
display off completely.
Use light sensors to automatically reduce display luminance in darkness.
Display content using a dark background to minimize the luminance emanating from the display.
Locate and orient the display to minimize reflections on windows.
Consider locating non-safety-critical displays in highly eccentric locations relative to the forward
gaze (e.g., center stack) to increase the glare angle. Do not use this approach for critical safety
messages.
Examples of mitigations for glare incident on and emanating from the display.
Glare on the Display
in Daylight
A. Display embedded
in the instrument
panel to protect
from sunlight
B. Display mounted in
recess above the
center stack
A & B. Display
luminance is
sufficient to ensure
adequate contrast
Glare from the Display
in Darkness
C. Display intensity is
adjustable to allow
drivers to control
amount of luminance
The CIE veiling luminance model to
the left shows that veiling
luminance (
) increases as (1)
glare intensity (
) increases and
(2) glare angle () decreases.
Increased veiling luminance results
in reduced visibility
Adapted from (Vos, et al., 2002). Used with permission.
=
10
+
5
1 +
62.5
Where
=
=
=
=
53
Discussion
Glare on the display: Intense light, such as sunlight, that falls on a visual display superimposes a uniform luminance
onto the display, essentially “filling in” the darker areas of the displayed image, thereby reducing image contrast (i.e.,
the luminance ratio of the light to dark areas is reduced). The image on the display becomes increasingly difficult to
read as the contrast decreases, until eventually the image can no longer be detected ((Vos, et al., 2002; Human Factors
and Ergonomics Society, 2007). This reduction in contrast could be a particular problem for applications that rely on
visual displays to present time-critical safety messages because lower contrast can increase drivers’ reaction times or
they may not see the display altogether.
Glare from the display: Glare from a visual display occurs when the intensity of the display within the visual field is
substantially greater than the visual adaptation level, causing physical discomfort or pain (discomfort glare) and/or
reduced visibility (disability glare). A portion of the light entering the eye is scattered in the transparent media of the
eye (i.e., cornea, lens, and vitreous fluids) and by the tissues in the ocular fundus (Adrian & Bhanji, 1991). Some light
also diffuses through the sclera and iris tissues. The scattered light superimposes a uniform veiling luminance onto the
retinal image, reducing its overall contrast. If the contrast of the image falls below the contrast threshold for visibility
under these conditions, it will be rendered invisible (Vos et al., 2002). Veiling luminance is influenced primarily by the
intensity of light, the surface area of the lighted areas of the display, and the angle at which the glaring luminance
enters the eye.
Design Issues
Glare on the display: Preventing glare from sunlight falling on an in-vehicle display can be extremely challenging to
designers. Kiefer et al. (1999) recommend that one way to mitigate glare on a display is to provide sufficient
luminance from the display in daytime driving to ensure adequate contrast. High-contrast display technologies can also
reduce the effects of glare on the display. (Wreggit, Powell, Kirn, & Hayes, 2000) found that an electroluminescent
display provided sufficient contrast for legibility, and drivers reported no washout or glare from sunlight. Because
vehicles are not stationary, it may be difficult (or perhaps impossible) to locate a display in a location that will never
receive direct sunlight. Nevertheless, placing the display in the instrument panel, in a custom recess, or within a
shading bezel, etc., can help reduce exposure to glaring light. In some configurations, smaller displays may be easier to
protect from direct light because they have less surface area to shade; however, it is important to ensure that other
aspects of DVI design (e.g., text and icon legibility, conspicuity) are not compromised when using a smaller display.
Glare from the display: Several mathematical models have been developed that estimate the amount of veiling
luminance developed by a glare source (e.g., Vos et al., 2002; Adrian & Bhanji, 1991; Farber & Matle, 1989). These
models show that veiling luminance is directly proportional to intensity and inversely proportional to the angle at
which glaring luminance enters the eye relative to the forward gaze. Thus, there are two primary solutions for reducing
the effects of glare emanating from in-vehicle displays: (1) reduce the amount of light emanating from the display
and/or (2) increase the eccentricity of the display location. A preferred approach for reducing the effects of glare from
displays is to provide a control that is used to adjust the display intensity This can be a manually operated control that
drivers manipulate or an automated control that adjusts display luminance based on sensors that detect ambient light
levels. Regardless of how the control is implemented, however, the amount of control provided should be limited,
however, to prevent drivers from turning off the display completely (Kiefer et al., 1999). Another way to reduce
display luminance is to present content on a dark background in order to minimize the overall surface area of high-
intensity portions of the image. Finally, locating the display further into peripheral vision can reduce the effects of
glare, but with important tradeoffs with regard to reductions in warning conspicuity and detection.
Cross References
Locating a Visual Display, 5-2
Topic References
1. Vos, J. J., Cole, B. L., Bodmann, H.W., Colombo, E., Takeuchi, T., & van den Berg, T.J.T.P. (2002). CIE equations for disability glare (CIE
146:2002). Vienna: International Commission on Illumination [CIE].
2. Human Factors and Ergonomics Society (2007). Human factors engineering of computer workstations. Santa Monica, CA: Author.
3. Adrian, W., & Bhanji, A. (1991). Fundamentals of disability glare: A formula to describe stray light in the eye as a function of glare angle and
age. Proceedings of the First International Symposium on Glare (pp. 185-193). New York: Lighting Research Institute.
4. Kiefer, R., LeBlanc, D., Palmer, M., Salinger, J., Deering, R., & Shulman, M. (1999, August). Development and validation of functional
definitions and evaluation procedures for collision warning/avoidance systems (Report No. DOT HT 808 964). Washington, DC: National
Highway Traffic Safety Administration. Available at
www.nhtsa.gov/DOT/NHTSA/NRD/Multimedia/PDFs/Crash%20Avoidance/1999/HS808964_Report-1999-08.pdf
5. Wreggit, S. S., Powell, J., Kirn, C., & Hayes, E. (2000). Human factors evaluation of the truck productivity computer’s electroluminescent
display (Paper No. 2000-01-3409). Warrendale, PA: SAE International.
6. Farber, E., & Matle, C. (1989). PCDETECT: A revised version of the DETECT seeing distance model. Transportation Research Record:
Journal of the Transportation Research Board, 1213, 11-20.

54
Head-Up Displays
Introduction
Head-up displays (HUDs) have the potential to provide drivers with critical information while minimizing glance
times away from the forward roadway scene. This can increase the speed of information access by the driver by
reducing eye movement and visual accommodation time. HUDs have been used and studied extensively in
aviation (Prinzel & Risser, 2004) and, as costs have reduced, are being used more frequently in automobiles. HUDs
also have the potential to expand display space within the vehicle. Application of the technology may proceed
conservatively, however, while impacts of factors such as potential distractions and driver individual differences are
further evaluated. Designers can consider the necessity of the information with regard to the current driving situation
when deciding what information to provide via HUD. However, there exists a sufficient body of information on
HUDs - both in aviation and, more recently, in automotive applications - to establish design guidance.
Design Goal (L2, L3): Use HUDs to present simple indications of critical safety situations in the driver’s
forward view.
Supporting Design Guidance
The best available research on this topic suggests that this design goal can be met when:
Information presented via HUD is interpretable within the HUD and does not require visual reference
to other head down displays.
Information relevant to the driving situation is prioritized over presentation of non-driving related
information.
The use of continuously presented stable-value information on a HUD is minimized.
The use of symbols, text, or indicators that continuously change in value is limited.
The HUD is located 5 degrees to the right and 5 degrees below the center line of driver view.
Two potential uses and implementations of HUD displays.
HUD providing a warning.
Only present during alert
Used in conjunction with
other modalities
Removed after scenario
resolved
HUD providing navigation information.
Only provides
driving/navigation relevant
information
Does not provide stable-
value information (e.g.,
“Navigation Active”)
Minimal number of
dynamic elements
Driver may disable if
desired
55
Discussion
While HUD use in L2 and L3 automation applications remains an unexplored topic from the standpoint of publically
available literature, guidance from automotive HUD use in safety applications are useful. These principles are
primarily applicable during L2 operations or when the driver’s attention must be reoriented due to a pending transfer
from automated to manual control.
HUDs have been studied in a number of different configurations and conditions, including comparisons with
HHDDs, traditional instrument clusters, and under various traffic load, secondary task and hazard detection
conditions. The clearest result to emerge from this work is the advantage of the HUD in reducing braking time and
increasing warning detections for critical road events (Lind, 2007; Kieffer, 1996).
The balance of evidence suggests that under test conditions, HUDs or HHDDs (located slightly lower than HUDs, yet
above the instrument cluster) tend to improve driver performance as measured by vehicle headway distance, response
time to critical events, and other measures of driving behavior (Lind, 2007; (Charissis & Papanastasiou, 2010;
Horrey, Wickens, & Alexander, 2003; Perez, Kiefer, Haskins, & Hankey, 2009).
Location of a HUD is the variable with the most consistent findings across a range of experiments, which suggest that
the HUD should be located approximately 5 degrees to the right and 5 degrees below the driver’s central visual focus
(Yoo, Tsimhoni, Wantanabe, Green, & Shah, 1999). There is some evidence that display HUDs are preferred by
drivers in simulator studies, and they yield better driving performance and information detection than a head-down
display (HDD) (Charissis & Papanastasiou, 2010).
Design Issues
As a platform for safety-critical messages, HUDs are most appropriate for providing drivers with information
relevant to the forward roadway or attracting the driver’s attention during an automated to manual transition. This
approach reserves the HUD location for critical information that is unlikely to be extraneous or distracting. The
designer should carefully consider what information is presented in the HUD and only provide information that is
relevant to the driver, minimizing presentation of non-driving related information. Presentation of stable-value
information, especially when not directly related to the driving task, should be minimized. Likewise, dynamic
elements that are not critical to the driving task or system status should not be incorporated.
Other approaches, such as providing vehicle or automation system status, are more complex and involve a much
larger range of display elements and properties. While there seems to be no documented detrimental effect of these
types of displays in laboratory and limited on-road testing for passenger vehicles, they may have the effect of
reducing the impact or salience of critical forward warnings, or worse, lead to an excessively cluttered field of view.
Cross References
Display Glare, 5-4
Topic References
1. Prinzel, L.J., III, & Risser, M. (2004). Head-up displays and attention capture (Report No. NASA/TM-2004-213000). Retrieved from the
NASA Technical Reports Serverwebsite at
http://naca.larc.nasa.gov/search.jsp?R=20040065771&qs=N%3D4294966788%2B4294724598%2B4294323833
2. Lind, H. (2007). An efficient visual forward collision warning display for vehicles (SAE Technical Paper 2007-01-1105). Warrendale, PA:
SAE International.doi:10.4271/2007-01-1105
3. Kiefer, R. J. (1996). A review of driver performance with head-up displays. Third World Congress on Intelligent Transport Systems
[CD-ROM]. Washington, DC: ITS America.
4. Charissis, V., & Papanastasiou, S. (2010). Human-machine collaboration through vehicle head up display interface. Cognition, Technology
and Work, 12(1), 41-50.
5. Horrey, W. J., Wickens, D. D., & Alexander, A. L. (2003). The effects of head-up display clutter and in-vehicle display separation on
concurrent driving performance. Proceedings of the Human Factors and Ergonomics Society 47th Annual Meeting, p. 1880-1884.
6. Perez, M. A., Kiefer, R. J., Haskins, A., & Hankey, J. M. (2009). Evaluation of forward collision warning system visual alert candidates and
SAE J2400. SAE International Journal of Passenger Cars- Mechanical Systems, 2(1), 750-764. Warrendale, PA: SAE International.
doi:10.4271/2009-01-0547
7. Yoo, H., Tsimhoni, O., Wantanabe, H., Green, P., & Shah, R. (1999). Display of HUD warnings to drivers: Determining an optimal location
(Report No. UMTRI-99-9). Ann Arbor: University of Michigan Transportation Research Institute.
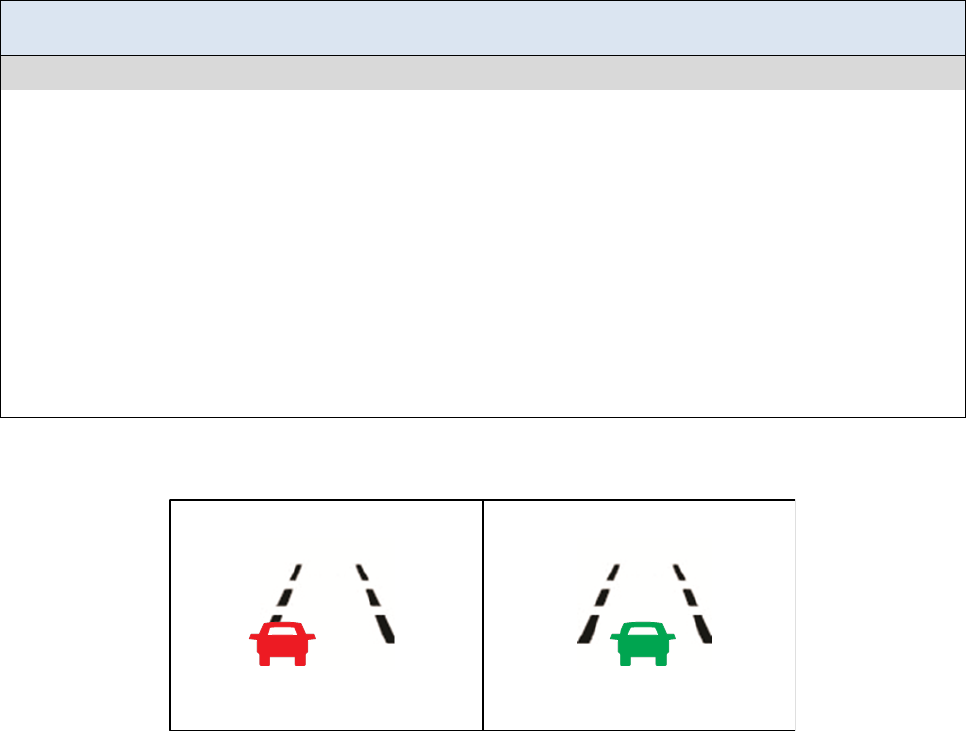
56
Using Color
Introduction
Color is a characteristic of visual displays that can be useful for conveying meaning or urgency of alerting signals.
Color has certain advantages over text and symbols in terms of immediacy of recognition, and can serve to reinforce
meaning conveyed by other methods. Color is a complex variable, however, and issues of luminance, hue, contrast
and potential conflicts with other messages must be considered during design.
Design Goal: Use color to augment visual information presented in the displays to attract attention and/or to
convey the urgency of conditions or situations.
Supporting Design Guidance
The best available research on this topic suggests that this design goal can be met when:
The color is associated with the level of warning:
− Red is normally associated with danger or critical situations
− Yellow is normally associated with caution
− Green is normally associated with normal operation; however, other considerations about warning
conspicuity may necessitate using a different color (see Design Issues on the next page).
The colors that are used are compatible with symbols based on prior association, such as red for
octagonal stop signs, and yellow for triangular or diamond warnings.
The quantity of colors used to code information is minimize; do not to exceed 4 color codes.
Color is used to create a “pop-out” effect in forward collision warnings to show the area of concern
more distinctly from the background scene.
The following color contrast combinations are avoided: green/red, green/blue, yellow/red,
yellow/blue, violet/red.
Example illustrating a potential use of color as part of a system status display.
This image shows a hypothetical lane centering status display. The left
image indicates that the car is not centered in the lane. The non-centered
status is provided through position of the car on the lane display, as well
as through the red color of the car. The right image indicates that the car
is centered in the lane. The centered status is portrayed through showing
the car in the center of the lane display and through the green color of the
car.
57
Discussion
The stereotyped interpretation of certain colors can be used in combination with other information to convey or
provide messages to the driver, and, importantly, to promote appropriate and timely responses when compatible with
stereotypical stimulus-response pairings. The traditional association of the color red with “danger or critical
situation,” yellow with “caution,” and green with “normal” can be used to compliment auditory or haptic signals, and
to convey urgency (ISO, 2005). While there have been some recent findings that the association of red with “danger”
is stronger than the association of yellow with “caution” (Leonard, 1999), the context of driving would tend to
reinforce the stereotype interpretation based on the frequency with which such colors are encountered in the roadway
environment.
During development of the air bag warning label, NHTSA focus groups (49 C.F.R. pt. 571.208, 2011), did not
associate orange with the word “danger.” To reduce potential ambiguity, and to maximize perceived color
distinctiveness, yellow should be used to indicate a discrete system warning or cautionary state (however, see Design
Issues below). The color green should not be used to provide a warning to the driver because it is associated with safe
or normal operating conditions (ISO, 2005).
Color and shape combinations are used for specific types of warnings and traffic regulation on road signs, and use of
the same combinations for in-vehicle messages will help to maintain consistency between the road infrastructure and
in-vehicle information environments. For example, use of a diamond shaped symbol with yellow background and
black text is the accepted standard for warning signs (FHWA, 2012), and application of these conventions for specific
automated driving system warning messages is appropriate. Color-shape combinations can increase reaction times
when signs utilize shape as well as text because additional decision elements are used; thus if a shape is associated
with a highly stereotyped response, additional text may lead to longer reaction times (Tijus, Barcenilla, Cambon de
Lavalette, & Maunier, 2007).. Designers should avoid incompatible or unconventional shape and color combinations,
such as octagonal shape (conventional meaning = stop) presented with a yellow background (conventional meaning =
caution).
Color contrast can affect the perception of both the background and message content through complex interactions of
luminance and visual system effects. Avoidance of the specific combinations described in the Design Guidance above
will preclude this problem (ISO, 2005). For messages requiring the presentation of text, green text has the advantage
of being at the frequency of maximum spectral sensitivity of the eye (NASA, n.d.). Similarly, green-yellow text (534
nm) best accommodates both light- or dark-adapted eyes.
Design Issues
Color should not be used as the primary or exclusive means by which information is conveyed, but instead a
supplementary element or alternative cue to meaning. When approached in this way, designers can think of
appropriate location and symbol-shape means to convey the principal message content, and color can be used as a
means to more quickly draw attention and reinforce meaning through traditional associations. Furthermore, relying
on characteristics other than color will convey to drivers with color-blindness important information that might
otherwise be missed if color were used exclusively to communicate the information.
Keeping the number of color codes within human cognitive limits is important in the driving environment. Four
colors is the recommended maximum, as this corresponds generally to the warning levels of danger, warning, caution
and normal operation (ISO, 2005).
Cross References
Designing Messages for Driver Comprehension, 4-2; Locating a Visual Display, 5-2
Topic References
1. International Organization for Standardization. (2005). Road vehicles—Ergonomic aspects of in-vehicle presentation for transport information
and control systems—Warning systems (ISO/TR 16352). Geneva: Author.
2. Leonard, S. D. (1999). Does color of warning affect risk perception? International Journal of Industrial Ergonomics, 23, 499-504.
3. 49 C.F.R. pt. 571.208. (2011, October 1). Federal Motor Vehicle Safety Standard (FMVSS) No. 208, Occupant crash protection
4. Federal Highway Administration (FHWA). (2012). Manual on uniform traffic control devices, 2009 edition with revisions 1 and 2.
Washington, DC: Author. Available at https://mutcd.fhwa.dot.gov/pdfs/2009r1r2/mutcd2009r1r2edition.pdf
5. Tijus, C., Barcenilla, J., Cambon de Lavalette, B., & Maunier, J.-G. (2007). The design, understanding and usage of pictograms. In
G. Rijlaarsdam (Series Ed.) Vol. 21. Studies in Writing: Written Documents in the Workplace (pp. 17-31). Netherlands: Kluwer.
6. NASA Ames Research Center Color Usage Research Lab. (n.d.) Using color in information display graphics. Retrieved from the NASA Ames
Research Center Color Usage Research Lab website at http://colorusage.arc.nasa.gov/index.php

58
Selecting Character Height for Icons and Text
Introduction
Optimum text and graphic symbols presented in the driver-vehicle interface are legible under a large range of
viewing distances, viewing angles, and environmental conditions. Legibility goes beyond visibility or detection; it
implies being able to discern shape or character identity based on appearance. An important factor that influences
legibility of an icon is the size of the symbols that comprise the icon—both graphical symbols and text. This topic
addresses symbol size, which refers to the visual angles subtended by the icon, its graphical elements, text within the
icon, and free-standing text.
Design Goal (L2, L3): Select sizes for text and icons that support rapid message legibility.
Supporting Design Guidance
The best available research on this topic suggests that this design goal can be met when:
Icon Size:
Optimal visual angle of primary graphical elements
1
: 86 arcminutes
Minimum visual angle of primary graphical elements
1
: 41 arcminutes for time-critical applications
34 arcminutes for non-time-critical applications
Text Size (both within the icon and free-standing text—see the discussion):
Optimal height: 20 arcminutes
Minimum height: 16 arcminutes for time-critical applications
12 arcminutes for non-time-critical applications
1
Primary graphical elements provide the primary information needed to encode or detect the icon. Secondary
graphical elements provide additional context or clarifying information. Optimum visual angle refers to the angle
at which the primary graphical elements are both conspicuous and legible. Minimum visual angle refers to the
smallest angle at which the primary graphical elements are legible but not necessarily conspicuous [2].
The table below provides equations for calculating the sizes of the icon, its graphical elements, text within the icon,
and free-standing text. Note that the equations assume the visual angle is measured in arcminutes, symbol height is in
millimeters, viewing distance is in meters, and the trigonometric functions (tangent and arctangent) accept and return
values in degrees rather than in radians. Appropriate conversion factors must be applied for different units.
Equations for calculating symbol height, visual angle, and viewing distance.
If Known…
Use These Equations for Calculating These Unknowns
Visual Angle (V)
in arcminutes
Symbol Height (H)
in millimeters
Viewing Distance (D)
in meters
Viewing Distance (D) and
Symbol Height (H)
= 60 Arctan
1000
— —
Viewing Distance (D) and
Visual Angle (V)
—
= 1000
Tan
60
—
Visual Angle (V) and
Symbol Height (H)
— —
=
1000 ∙ Tan
60
Definitions of Variables Used in the Equations
Figures adapted from Campbell et al. (2007)
Examples of Symbol Elements in an Icon
Eyepoint
V
Visual
Angle
Symbol
Height
(Distance from Viewer to Display)
D
H
H = Symbol height in millimeters
D = Viewing distance in meters (0.5–1.1 m)
V = Visual angle subtended in arcminutes
Border
Background
Secondary Graphical
Element
1
Text label
WARNING
Symbol
WARNING
Primary Graphical
Element
1
59
Discussion
Icon size: The design guidance above for icon size are consistent with the recommendations made by
ISO/TR7239 (ISO, 1984), which were based on a variety of research related to detection and resolution thresholds.
The optimum visual angle suggested (86 arcminutes) is aimed at ensuring conspicuity, while the minimum visual
angle (41 arcminutes) simply ensures legibility. It is important to note that the recommendations made by ISO
(1984)—and therefore the supporting design guidance on the previous page—are based on the assumption that the
icon will not be placed outside a 15-degree angular displacement from the central line of the normal direction of
user’s vision. ISO (1988) specifies that the minimum size of graphical symbols for use on equipment should be
1/100th their viewing distance, which corresponds to 34 arcminutes of visual angle. The larger sizes in ISO (1984)
are recommended for time-critical applications in order to ensure both conspicuity and legibility in the driving
environment.
Text size: ISO 15008 (ISO, 2009) recommends that character heights for in-vehicle display text should subtend at
least 20 arcminutes of visual angle, but 16 arcminutes is acceptable. Furthermore, the minimum visual angle for text
should be no less than 12 arcminutes, but text of this size should be reserved for situations with only modest
requirements for reading speed and accuracy. More recent research by O’Day and Tijerina (2011) verifies these
values. They found that the highest accurate reading rate occurred with the largest text height they tested (20
arcminutes) and the lowest accurate reading rate for text that subtended 12 arcminutes. In addition, the greatest
variability in accurate reading rate was associated with the smallest text. Taken as a whole, ANSI (HFES, 2007),
Mourant and Langolf (2007), Howell and Kraft (1959), and Giddings (1972) agree with the ISO (2009) standard,
recommending a minimum character height of 16 arcminutes and optimal character heights for high legibility in the
range of 20 to 30 arcminutes. The recommendation given in this design principle reflects the specifications for text
height found in ISO (2009) because it is an international standard that applies directly to the presentation of textual
information in vehicle-based applications.
It should be noted that the literature did not provide any information that suggested the size of text within an icon
should be different than the size of free-standing text in terms of legibility. Therefore, the design principle above does
not differentiate between these implementations.
Design Issues
The size of in-vehicle displays is often limited by the available real-estate in the cab, which in turn limits the size of
the symbols presented on the displays. This limitation can result in a tradeoff between symbol size and legibility.
When designing in-vehicle displays, it is important to consider legibility when determining the sizes of symbols,
especially in safety-critical applications where the time available to read and interpret the symbols is limited. O’Day
and Tijerina (2011) found that a wide variety of character heights can be legible if the character width and stroke
width are carefully chosen. Nevertheless, size is only one of the characteristics of graphical and textual symbols that
affect legibility. The legibility of icons and text is determined by factors such as the size, stroke width, contrast, and
luminance (Howell and Kraft, 1959; Carney, Campbell, & Mitchell, 1998).
Cross References
Using Color, 5-8
Topic References
1. Campbell, J. L., Richard, C.M., Brown, J. L., & McCallum, M. (2007). Crash warning system interfaces: Human factors insights and lessons
learned, final report (Report No. DOT HS 810 697). Washington, DC: National Highway Traffic Safety Administration. Available at
www.nhtsa.gov/DOT/NHTSA/NRD/Multimedia/PDFs/Crash%20Avoidance/2007/CWS_HF_Insights_Task_5_Final_Rpt.pdf
2. International Organization for Standardization (1984). Development and principles for application of public information symbols. (ISO/TR
7239). Geneva: Author.
3. ISO (1988). General principles for the creation of graphical symbols, Part I: Graphical symbols for use on equipment (ISO ISO 3461-1).
Geneva: Author.
4. ISO (2009). Road vehicles—Ergonomic aspects of transport information and control systems—Specifications and test procedures for in-
vehicle visual presentation (ISO 15008). Geneva: Author.
5. O’Day, S., & Tijerina, L. (2011). Legibility: Back to the basics. SAE International Journal of Passenger Cars—Mechanical Systems, 4(1),
591-604.
6. Human Factors and Ergonomics Society (2007). Human factors engineering of computer workstations (ANSI/HFES 100-2007). Santa
Monica, CA: Author.
7. Mourant, R. R. & Langolf, G. D. (1976). Luminance specifications for automobile instrument panels. Human Factors, 18(1), 71-84.
8. Howell, W. C., & Kraft, C. L. (1959). Size, blur, and contrast as variables affecting the legibility of alphanumeric symbols on radar-type
displays (WADC Technical Report 59-536). Wright-Patterson Air Force Base, OH: Wright Air Development Center.
9. Giddings, B. J. (1972). Alpha-numerics for raster displays. Ergonomics, 15(1), 65-72.
10. Carney, C., Campbell, J. L., & Mitchell, E. A. (1998). In-vehicle display icons and other information elements: Literature review (Report No.
FHWA-RD-98-164). Washington, DC: Federal Highway Administration.
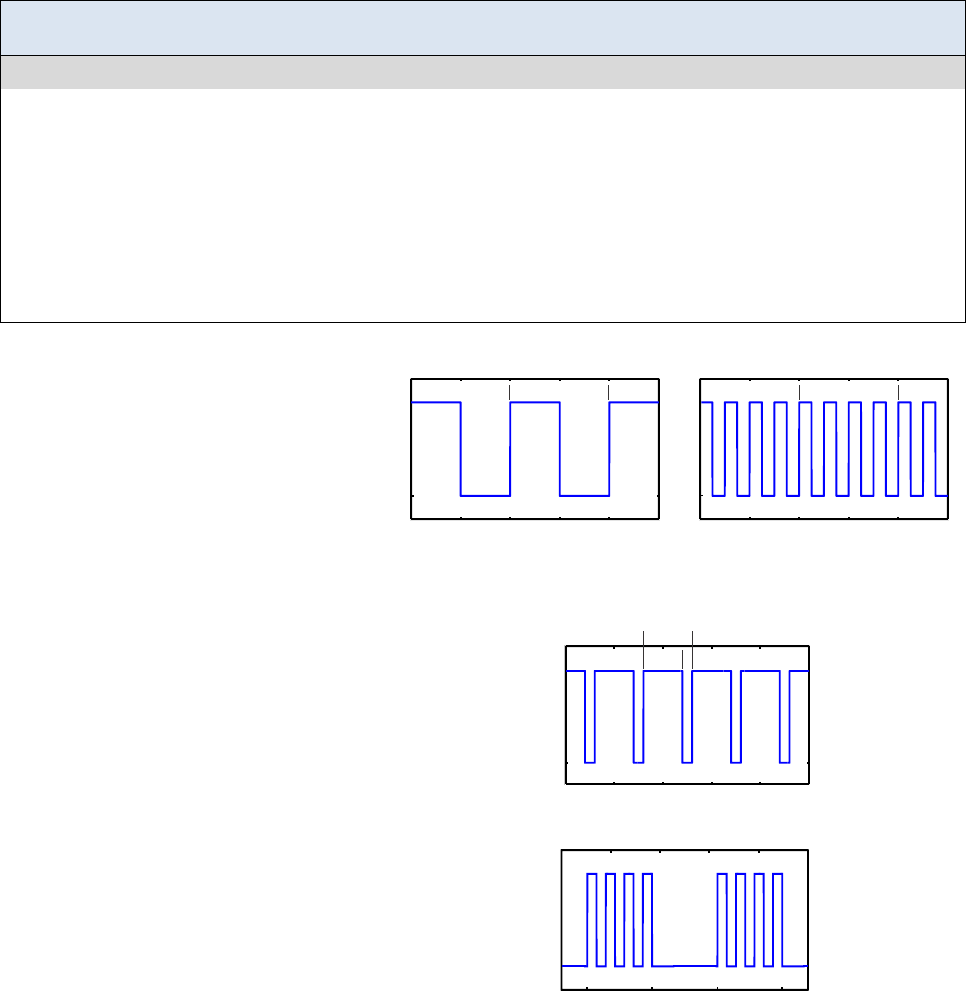
60
Temporal Characteristics of Visual Displays
Introduction
The temporal characteristics of visual messages can involve the use of flashing, blinking and motion in order to draw
attention toward a particular visual display. The use of temporal characteristics, such as flash and motion, takes
advantage of features of the human visual system that are especially sensitive to these features. This topic covers the
design of in-vehicle messages that use temporal and movement features.
Design Goal (L2, L3): Use changes in the temporal characteristics of visual displays, such as flashing, blinking
or apparent motion, to command visual attention.
Supporting Design Guidance
The best available research on this topic suggests that this design goal can be met when:
Flashing is used for important, suddenly-occurring, situations (optimal rate is 3-4 times/s).
Multiple flash mode is used for more urgent situations (this mode uses rapid pulses of flash for each
flash cycle).
Flash rate and duty cycle (on-off period) are adjusted as needed to ensure driver comprehension.
Sequential illumination is used to convey motion and/or direction, but keep text stationary.
Other motion cues such as bouncing or zooming are discouraged while in manual driving or during
transitions to or from automated driving because they may unnecessarily increase driver eyes-off-
road time.
Examples of flash rate and duty cycle.
Flash Rate (Frequency): The number of
flashes per second. Example (a) shows lower
flash rate (one flash per second), and
example (b) shows higher flash rate (four
flashes per second).
A high flash rate can be used to convey high
urgency.
Duty Cycle: The percent of time within a cycle
that the sign is in the “on” state. The example
shows a signal with 80% duty cycle (“on” for
0.8s and “off” for 0.2s).
A higher duty cycle can be used for presenting
icons with accompanying text in order to
provide sufficient time for the driver to read the
text.
Complex Flash: Presentation of multiple
flashes with varying “on” and “off” times. The
example shows two one-second bursts with
four pulses per burst. Each burst is separated by
one second of “off” time.
Complex flashes can be used to further increase
perception of urgency.
0
0.5 1
1.5 2 2.5
Off
On
Time (seconds)
b) High Frequency
1s
1
2
3
4
0
0.5
1
1.5
2
2.5
Time (seconds)
a) Low Frequency
1s
1
Off
On
80% Duty Cycle
On
Off
0 1 2 3 4 5
Time (seconds)
0.8s
1s
Off
On
Time (seconds)
0 1 2 3 4
61
Discussion
Use of flashing signals is a standard practice in warning system design (ISO, 2005). Much of this basic guidance may
be useful for the construction of DVIs for L2 and L3 automated driving systems. The basic parameters of a flashing
warning are the frequency, contrast, and duty cycle. Frequency refers to the number of times per second the signal
flashes; a considerable amount of human factors research suggests that for conveying urgency, an optimal flash rate is
3-4 times per second (ISO, 2005; Chan & Ng, 2009). It is possible also to modulate each flash within a cycle via a
multiple “fast flash” mode—this has been found to further increase perception of urgency (Chan & Ng, 2009).
Contrast refers to the change in illumination between the “on” and “off” portions of the flash. The duty cycle of the
flash period refers to the relative amount of “on” and “off” time for the flashing signal—this is a relevant parameter if
symbolic and verbal information are conveyed on a flashing warning because drivers require sufficient “on” time to
view the information.
Sequential illumination of display elements can be used to create apparent motion, which can convey directional
information pertinent to warning systems. ISO (2005) provides examples of movement in association with icons to
convey dangerous situations such as emergency vehicles, icy roadways, etc. Motion should only be applied to icons
or symbols; text should be stationary to reduce potential distraction or implied meaning associated with text motion.
Motion cues may affect cognitive load. (Doshi, Cheng, and Trivedi (2009) used a number of motion cues in a HUD,
including bouncing triangular warning signs, zooming warning signs and moving graphical indicators with a bounce
to show excessive speed. The results suggested that motion without contextual information about speed led drivers to
spend more time looking down at the instrument cluster to determine why the alert was being provided than they did
with no alert.
Design Issues
Flashing and motion can be compelling visual display elements and are appropriate for use in higher priority
situations if the message can be provided in appropriate temporal relationship to the message cause so that nuisance
alarms are not perceived. The increasing ease of presenting visual effects such as zooming and bouncing of visual
elements lead to an expanded interpretation of the “flash” concept. Type of motion, however, should not be used as a
code in and of itself; instead, supplementary information should be provided (such as current speed or speed limit),
without requiring the driver to visually refer to other instruments or displays.
Cross References
Multimodal Messages, 4-8; Locating a Visual Display, 5-2; Display Glare, 5-4
Topic References
1. International Organization for Standardization. (2005). Road vehicles—Ergonomic aspects of in-vehicle presentation for transport information
and control systems—Warning systems (ISO/TR 16352). Geneva: Author.
2. Chan, A. H. S., & Ng, A. W. Y. (2009). Perceptions of implied hazard for visual and auditory alerting signals. Safety Science. 47, 346-352.
3. Doshi, A., Cheng, S. U., & Trivedi, M. M. (2009). A novel active heads-up display for driver assistance. IEEE Transactions on Systems, Man,
and Cybernetics—Part B: Cybernetics, 39(1), 85-93.
62
Chapter 6. Auditory Interfaces
This chapter provides guidance for the design of auditory interfaces. Auditory interfaces are
useful for capturing and directing drivers’ attention and for presenting information to drivers
when they are not attending to a visual display. Consequently, these interfaces are particularly
useful for presenting time-sensitive messages to drivers. Auditory signals can be used to convey
three forms of information (Catchpole, McKeown, & Withington, 2004). First, urgency cues
provide information regarding the criticality of the situation or how quickly drivers need to
respond to the warning. Second, location information identifies where the hazard is located or
where it is coming from. Third, the semantic meaning associated with the signal provides
information to the driver about what is happening or what actions to take in order to avoid a
crash. Even though all three forms of information do not necessarily need to be included in a
single message, each of these components can provide useful information for facilitating rapid
and correct responses.
As drivers of L2, and especially L3, automated driving systems may be engaged in non-driving
related tasks, it cannot be assumed that the driver’s visual attention will be directed towards the
roadway. Auditory signals can be effective for presenting information to the driver because they
can be perceived regardless of the direction of visual attention. These signals can be very
effective in when they are salient, appropriately obtrusive, and their meaning can be understood.
Various characteristics of auditory messages can be modulated to affect the level of salience and
obtrusiveness as well as the perception of urgency, and the type of signal used can facilitate
comprehension of the information being displayed.
There are design tradeoffs, however, that need to be considered in order to avoid unwanted side
effects and ensure the message has its intended effect. Salient, obtrusive sounds can be annoying
if they are presented often, too loudly, or if their characteristics are perceived as annoying. Yet
sounds that are not obtrusive or loud enough may go unnoticed. Also, the meaning of some
auditory signals, such as speech messages and auditory icons (auditory signals that sound like a
real object or event, such as a screeching tire), can be easy to understand, while the meaning of
other types of sounds, such as pure tones, must be learned.
The following topics are included in this chapter.
• Perceived Urgency of Auditory Warnings
• Perceived Annoyance of Auditory Warnings
• Loudness of Auditory Warning Signals
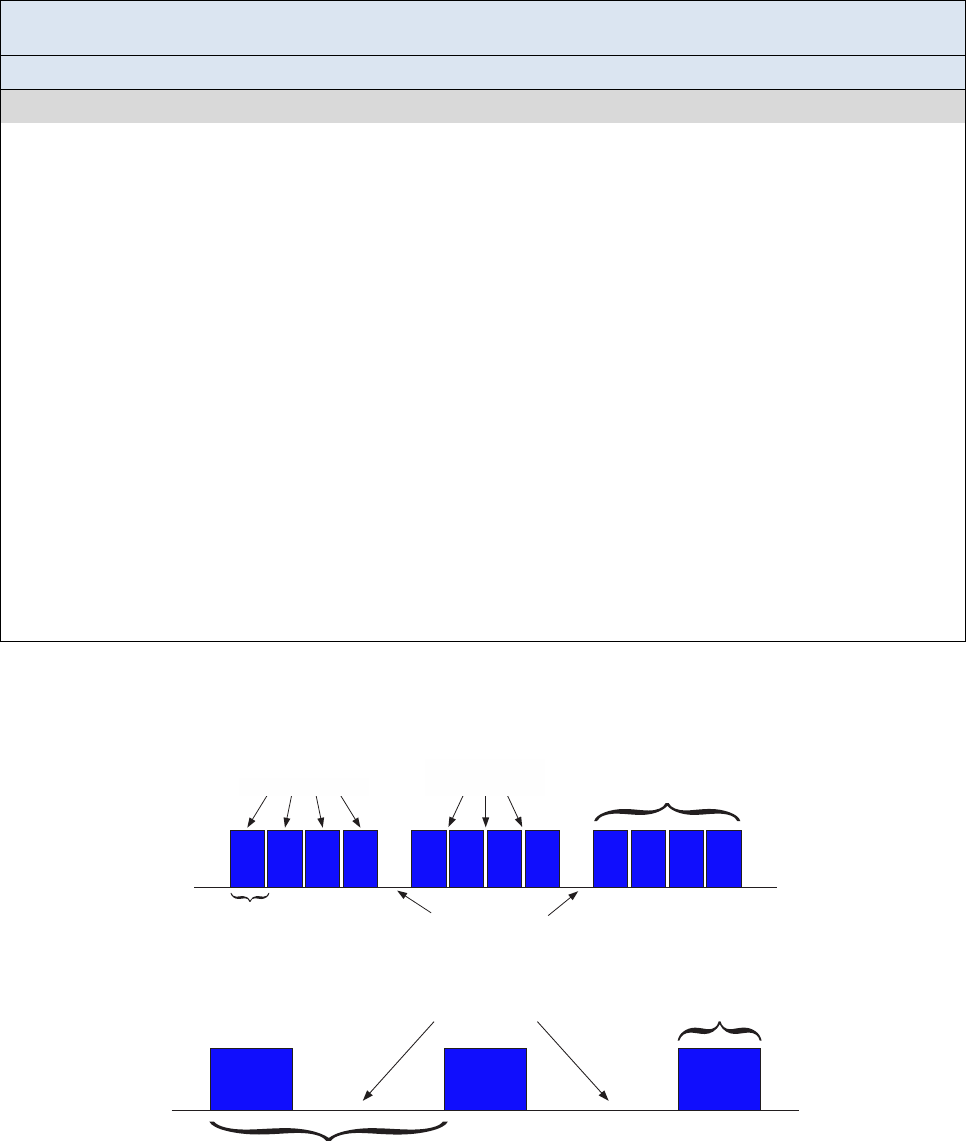
63
Perceived Urgency of Auditory Warnings
Introduction
This topic provides information for designing auditory warning messages that convey a level of urgency that
matches the urgency of the hazard situation.
Design Goal (L2, L3): Use an auditory warning to clearly communicate a level of urgency consistent with the
urgency of the task, event, or situation.
Supporting Design Guidance
The literature suggests that the attributes listed below may be manipulated in support of the design goal. Note that
this list is not intended to be comprehensive.
To increase the perceived urgency: To decrease the perceived urgency:
Use faster auditory signals (e.g., 6
pulse/s).
Use regular rhythms (all pulses
equally spaced).
Use a greater number of pulse burst
units (e.g., 4 units).
Use auditory signals that speed up.
Use high fundamental frequencies
(e.g., 1000 Hz).
Use random or irregular overtones.
Use a large pitch range (e.g., 9
semitones).
Use a random pitch contour.
Use an atonal musical structure
(random sequence of pulses).
Use more urgent words
(e.g., “Danger”).
Use slower auditory signals (e.g., 1.5
pulse/s).
Use irregular rhythms (pulses not
equally spaced).
Use a fewer number of pulse burst
units (e.g., 1 unit).
Use auditory signals that slow down.
Use low fundamental frequencies
(e.g., 200 Hz).
Use a regular harmonic series.
Use a small pitch range (3 semitones).
Use a down or up pitch contour.
Use a resolved musical structure (from
natural scales).
Use less urgent words
(e.g., “Caution”).
Examples of auditory signals (tones) with urgent (top)
and less urgent (bottom) characteristics.
Many pulses per burst
Long burst duration
Short interburst
interval
Fast pulse rate
Short pulse width
High fundamental
frequency
Short interpulse
interval
Low fundamental
frequency
Few (one) pulses
per burst
Slow pulse/burst rate
Long interburst
interval
64
Discussion
Varying certain acoustical properties has a strong and consistent effect on a person’s subjective impression of the
urgency of an auditory warning. Accurate portrayal of urgency helps drivers to understand the warning and respond
more effectively. Scaling of the urgency of the warning must be selected with understanding the potential for the
driver to be engaged in a non-driving related task, possibly for an extended period of time prior to warning issuance.
In general, greater perceived urgency of a warning is associated with faster reaction times (Campbell, Richman,
Carney, & Lee, 2004; Suied, Susini, & McAdams, 2008) however, signals that are perceived as more urgent than is
warranted by the situation can result in confusion, distraction, or inappropriate responses, such as overly aggressive
responses. If auditory signals are designed with the proper level of urgency in mind, more effective warnings can be
developed.
Design Issues
Signal attributes that can provide urgency cues include time-varying characteristics, frequency characteristics, and
signal complexity (Campbell, Richman, Carney, & Lee, 2004; Suied, Susini, & McAdams, 2008; Department of
Defense, 2012; Pomerleau et al., 1999; Tan & Lerner, 1995; Marshall, Lee, & Austria, 2007). Some specific
characteristics that affect urgency are pulse rate, fundamental frequency, harmonic content, and (potentially)
intensity. Several studies and guideline documents (e.g., Campbell, Richman, Carney, & Lee, 2004; Suied, Susini, &
McAdams, 2008, (Gonzalez, Lewis, Roberts, Pratt, & Baldwin, 2012, 2007) suggest that increasing the pulse rate
can increase perceived urgency; similarly, increasing the fundamental frequency also increases urgency.
Furthermore, Edworthy, Loxley, & Dennis (1991) found that signals with irregular overtones increased perceived
urgency, while those with regular harmonics decreased urgency. Some studies and guidelines (e.g., MIL-STD-
1472G [Department of Defense, 2012], Pomerleau et al., 1999; Tan & Lerner, 1995) suggest that increasing the
intensity (volume) increases the level of perceived urgency; however, intensity as an urgency cue should be used
with caution. Although intensity can affect perceived urgency, it is not always clearly the case—at least one source
(Lee, McGehee, Brown, & Reyes, 2002). showed that increasing the intensity as a means of presenting higher levels
of urgency did not have a significant effect on the performance of the forward crash warning (FCW). More
importantly, high-intensity auditory signals can be perceived as annoying, which can negatively impact driver
performance as well as acceptability (Wiese & Lee, 2004).
Message semantics can also influence the perceived urgency of an auditory warning. A laboratory study (Guilluame,
Drake, Rivenez, Pellieux, & Chastres, 2002). found that familiar, real alarms used in military aircraft were rated
with different levels of urgency than their synthesized counterparts that had similar acoustic characteristics,
suggesting that the mental representation of the sequence interacts with the acoustic properties in the perception of
urgency. Similarly, the semantic content of speech messages has been shown to interact with loudness in simulated
driving (Baldwin &., & May, 2011). The fewest crashes occurred when drivers received collision warning messages
that included either the low-urgency word “Caution” presented at high intensity or the high-urgency word “Danger”
presented at low intensity, while the most crashes occurred when the word “Danger” was presented at high intensity.
These findings suggest that overall perceived urgency can be elevated without substantially increasing the annoying
effects associated with high-urgency acoustic properties by incorporating high-urgency semantics (whether with
speech or with familiar non-speech signals) into auditory messages that have lower-urgency acoustic characteristics.
Cross References
Perceived Annoyance of Auditory Warnings, 6-4
Topic References
1. Campbell, J. L., Richman, J. B., Carney, C., & Lee, J. D. (2004). In-vehicle display icons and other information elements, Volume I: Guidelines
(Report No. FHWA-RD-03-065). McLean, VA: Federal Highway Administration. Retrieved from
www.fhwa.dot.gov/publications/research/safety/03065/index.cfm
2. Suied, C., Susini, P., & McAdams, S. (2008). Evaluating warning sound urgency with reaction times. Journal of Experimental Psychology: Applied,
14(3), 201-212.
3. Department of Defense. (January 11, 2012). MIL-STD-1472G. Department of Defense Design Criteria Standard: Human Engineering. Washington,
DC: U.S. Government Printing Office. Available at http://everyspec.com/MIL-STD/MIL-STD-1400-1499/download.php?spec=MIL-STD-
1472G.039997.pdf
4. Pomerleau, D., Jochem, T., Thorpe, C., Batavia, P., Pape, D., Hadden, J., . . . Everson, J. (1999). Run-off-road collision avoidance using IVHS
countermeasures (Report No. DOT HS 809 170). Washington, DC: National Highway Traffic Safety Administration.
5. Tan, A. K., & Lerner, N. D. (1995). Multiple attribute evaluation of auditory warning signals for in-vehicle crash avoidance warning systems (Report
No. DOT HS 808 535). Washington, DC: National Highway Traffic Safety Administration. Available at https://rosap.ntl.bts.gov/view/dot/13554
6. Marshall, D. C., Lee, J. D., & Austria, P. A. (2007). Alerts for in-vehicle information systems: Annoyance, urgency, and appropriateness. Human
Factors, 49(1), 145-157.
7. Gonzalez, C., Lewis, B. A., Roberts, D. M., Pratt, S. M., & Baldwin, C. L. (2012). Perceived urgency and annoyance of auditory alerts in a driving
context. Proceedings of the Human Factors and Ergonomics Society Annual Meeting, 56(1), 1684-1687.
8. Edworthy, J., Loxley, S., & Dennis, I. (1991). Improving auditory warning design: Relationship between warning sound parameters and perceived
urgency. Human Factors, 33(2), 205-231.
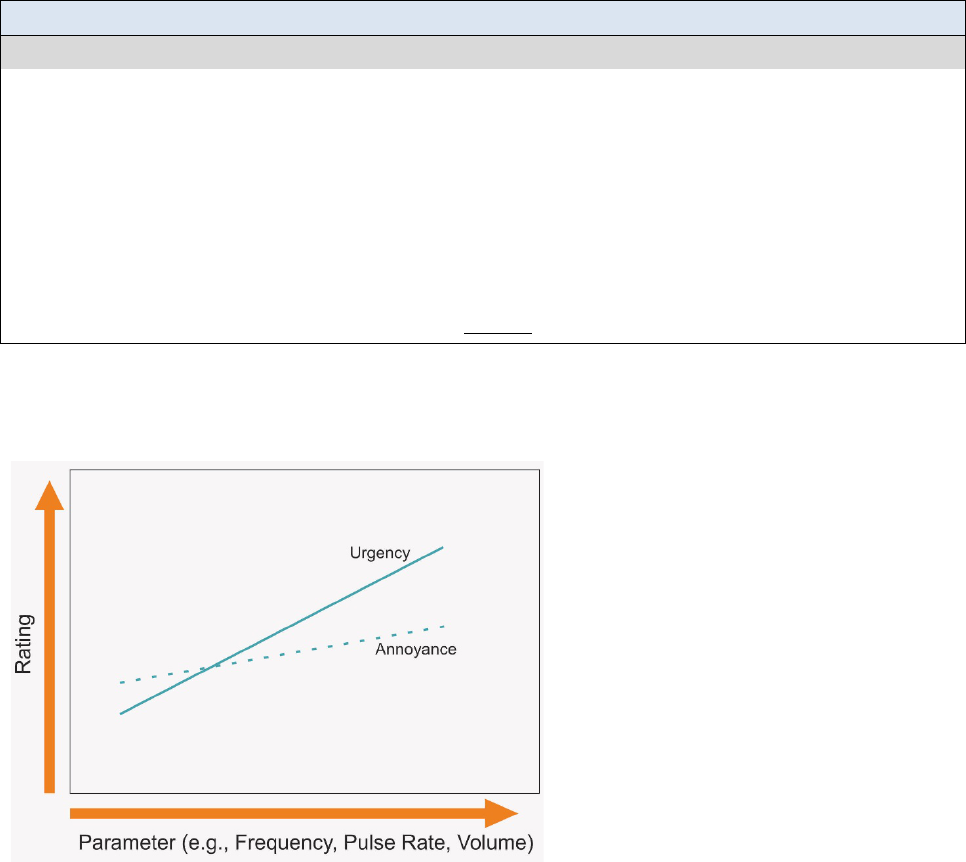
65
9. Lee, J. D., McGehee, D. V., Brown, T. L., & Reyes, M. L. (2002). Driver distraction, warning algorithm parameters, and driver response to imminent
rear-end collisions in a high-fidelity driving simulator (Report No. DOT HS 809 448). Washington DC: National Highway Traffic Safety
Administration.
10. Wiese, E. E., & Lee, J. D. (2004). Auditory alerts for in-vehicle information systems: The effects of temporal conflict and sound parameters on driver
attitudes and performance. Ergonomics, 47(9), 965-986. doi: 10.1080/00140130410001686294
11. Guilluame, A., Drake, C., Rivenez, M., Pellieux, L., & Chastres, V. (2002). Perception of urgency and alarm design. Proceedings of the 8th
International Conference on Auditory Display.
12. Baldwin, C. L., & May, J. F. (2011). Loudness interacts with semantics in auditory warnings to impact rear-end collisions. Transportation
Research Part F: Traffic Psychology and Behaviour, 14(1), 36-42.
Perceived Annoyance of Auditory Warnings
Introduction
This topic provides information for designing auditory warning messages that are less likely to annoy drivers yet
still convey an appropriate level of urgency. Urgent sounds often have characteristics that can also be perceived as
annoying. Note that the presentation of other auditory information to the driver (e.g., navigation updates) is not
covered by this topic.
Design Goal (L2, L3): Select auditory warnings that minimally annoy drivers.*
Design Guidance
The best available research on this topic suggests that this design goal can be met when:
The perceived urgency of a sound is matched with the urgency of its referent. Drivers who perceive
the benefits of an obtrusive signal will be less likely to be annoyed by it.
Low annoyance sounds are used for benign situations.
Minimize the rate of false or nuisance alarms to reduce the potential for annoyance.
Repetitious Speech-based warnings are minimally repeated and no more than three times per crash
avoidance situation, and in immediate succession.
Systems use sounds with characteristics that promote perceived urgency more than perceived
annoyance.
*This topic does not apply to auditory warnings that are intended to annoy drivers, e.g., seat belt reminder.
Example of one analytical method for estimating the effect on
perceived urgency and annoyance by varying sound parameters.
The figure on the left illustrates the
relationship between urgency and
annoyance when varying a signal
characteristic, such as frequency, pulse rate,
or volume, of an example auditory warning.
The graph shows linear regressions of
subjective ratings of urgency and annoyance
as described in (Gonzalez, Lewis, Roberts,
Pratt, & Baldwin, 2012).
In this example, the greater slope
of the urgency line indicates that
urgency increases more than
annoyance does when the
parameter is increased.
This graph suggests that, for the
particular auditory warning tested,
the parameter under test should be
increased to convey higher urgency
because it has less impact on
annoyance than on urgency.
66
Discussion
An important tradeoff exists between alerting and annoying when using auditory warnings. Highly urgent signals
can also be perceived as annoying, and while many sound parameters that increase urgency also increase annoyance,
careful design can create highly urgent sounds that are not overly annoying. The goal is to minimize the annoyance
associated with a warning, balanced by the need to match the urgency of the signal to the urgency of the situation.
This is called “annoyance tradeoff” and should be considered in signal design.
Auditory signals that are perceived to be annoying can increase workload (Wiese & Lee, 2004), be distracting, or
cause the driver to disable the warnings altogether. This problem may potentially be compounded when more than
one safety application, each with its attendant warning, is available in the vehicle. Consequently, designers should
consider the potential for “alarm fatigue” when designing systems with multiple auditory warnings, even when the
individual warnings are designed to minimize annoyance. General Motors Corporation and Delphi-Delco Electronic
Systems (2002) found that forward crash waring (FCW) systems that produce a high number of false alarms can be
considered annoying by drivers, even when the tone is appropriate for a system with a low number of false alarms.
Similarly, although participants in one study (Kiefer, Cassar, Flannagan, Jerome, & Palmer, 2005) considered the
auditory tone to convey the right level of urgency, more than half indicated they would turn off the alert suggesting
that the sound was annoying.
Design Issues
Some sources (Campbell, Richman, Carney, & Lee, 2004; Marshall, Lee, & Austria, 2007; Hellier & Edworthy,
1989) indicate that certain quantifiable sound parameters such as inter-pulse interval (time between pulses), number
of repetitions, duty cycle, and frequency have a greater effect on urgency than on annoyance. Other studies (Wiese
& Lee, 2004; Gonzalez, Lewis, Roberts, Pratt, & Baldwin, 2012), however, found that increasing signal intensity,
frequency, or duty cycle increased annoyance more than urgency. Results from (Gonzalez, Lewis, Roberts, Pratt, &
Baldwin, 2012) suggest that if a signal parameter’s psychophysical relationship with urgency is not stronger than its
relationship with annoyance, it is likely not a viable parameter. The figure on the previous page demonstrates a
method for quantifying the level of annoyance or urgency as a means of determining the relationship between
urgency, annoyance, and the signal characteristics.
While this guidance applies to warnings, many of the concepts may be applied to the design of non-warning
information for the driver of L2 or L3 automated driving systems. For instance, avoiding unnecessary repetition of a
message, and careful selection of sound characteristics can lessen the potential for driver annoyance due to system
messages. However, some uncertainty remains about the specific characteristics that a driver will find annoying in
either the L2 or L3 automated driving environment. Also at issue is the fact that, especially in L3 operations, it will
not be possible to know what the driver is doing. Drivers who are monitoring the road may find an alert annoying,
whereas a driver engaged in some non-driving task may find the same alert helpful.
Topic References
1. Gonzalez, C., Lewis, B. A., Roberts, D. M., Pratt, S. M., & Baldwin, C. L. (2012). Perceived urgency and annoyance of auditory alerts in a
driving context. Proceedings of the Human Factors and Ergonomics Society Annual Meeting, 56(1), 1684-1687.
2. Wiese, E. E., & Lee, J. D. (2004). Auditory alerts for in-vehicle information systems: The effects of temporal conflict and sound parameters
on driver attitudes and performance. Ergonomics, 47(9), 965-986. doi: 10.1080/00140130410001686294
3 General Motors Corporation & Delphi-Delco Electronic Systems. (2002). Automotive collision avoidance system field operation test: Warning
cue implementation summary report (Report No. DOT HS 809 462). Washington, DC: National Highway Traffic Safety Administration.
4. Kiefer, R. J., Cassar, M. T., Flannagan, C. A., Jerome, C. J., & Palmer, M. D. (2005). Surprise braking trials, time-to-collision judgments,
and “first look” maneuvers under realistic rear-end crash scenarios: Forward Collision Warning Requirements Project, Tasks 2 and 3a
Final Report( Report No. DOT HS 809 902). Washington, DC: National Highway Traffic Safety Administration,. Available at
https://one.nhtsa.gov/DOT/NHTSA/NRD/Multimedia/PDFs/Crash%20Avoidance/2005/FCWTask2and3aFinal.pdf
5. Campbell, J. L., Richman, J. B., Carney, C., & Lee, J. D. (2004). In-vehicle display icons and other information elements, Volume I:
Guidelines (Report No. FHWA-RD-03-065). McLean, VA: Federal Highway Administration. Available at
www.fhwa.dot.gov/publications/research/safety/03065/index.cfm
6. Marshall, D. C., Lee, J. D., & Austria, P. A. (2007). Alerts for in-vehicle information systems: Annoyance, urgency, and appropriateness.
Human Factors, 49(1), 145-157.
7. Hellier, E., & Edworthy, J. (1989). Quantifying the perceived urgency of auditory warnings. Canadian Acoustics, 17(4), 3-11.

67
Loudness of Auditory Warning Signals
Introduction
This topic provides guidance and information regarding the intensity levels for presenting auditory warnings that are
clearly perceivable. In order to be effective, auditory warnings must be loud enough to be heard in the noisy driving
environment. The information below may assist designers in determining appropriate volume levels for presenting
clearly audible warnings to drivers.
Design Goal (L2, L3): Select auditory warning signals that are loud enough to overcome masking sounds from
road noise, the cab environment, and other equipment.
Supporting Design Guidance
The best available research on this topic suggests that this design goal can be met when:
The amplitude of auditory signals is in the range of 10-30 dB above the masked threshold (MT), with
a recommended minimum level of 15 dB above the MT. Alternatively, the signal is at least 15 dB
above the ambient noise.
The signal does not exceed a maximum intensity of 90 dBA.
Designers avoid presenting auditory warnings at more than 30 dBA above the MT to avoid startling
or annoying drivers.
The auditory warning signal includes frequency components in the range of 500-2500 Hz, and the
signal includes at least two dominant components in the subset range of 500-1500 Hz.
The intensity of cautionary warning signals is less than the intensity of the imminent collision
warning signals; however, if doing so will limit the ability of drivers to perceive the cautionary
warning, other signal characteristics could be used to convey lower urgency.
Other sounds produced by the vehicle (e.g., radio or HVAC fans) are muted or disabled while the
warnings are presented, to enhance the audibility of warnings.
Relationship between masked threshold and recommended signal intensity range.
Adapted from Edworthy & Hellier (2000).
This graph shows the frequency domain of a
hypothetical warning signal superimposed
on the MT for noise conditions while
driving
1
.
A. Signal limited to 90 dB above the MT
B. Dominant frequency components in
500−2500 Hz range with two in the
500−1500 Hz range
C. Signal has potential to be startling or
annoying because 3 kHz component is
greater than 30 dB above MT
D. Frequency component will likely not
be heard
E. Frequency component may not be
perceived by some
1
This graph shows a hypothetical scenario for illustrative purposes only. The signal itself is likely to be annoying, and the noise spectrum may
not represent noise in real driving conditions.
0
10
20
30
40
50
60
70
80
90
100
0 1000 2000 30 00 4000 5000
Power in d
B SPL
Frequency in Hz
Recommended Signal Intensity Range
(10 to 30 dB above Masked Threshold)
Auditory Warning Signal
Masked Threshold
Ideal Minimum Signal Intensity
(15 dB above Masked Threshold)
E
D
B
A
C
68
Discussion
Little published research examining the loudness of warning messages for automated driving systems is available.
The guidance listed here are based on research examining imminent collision warnings (ICWs) and cautionary
collision warnings (CCWs) and should be generally applicable to presenting urgent (e.g., take control now) and
cautionary (e.g., take control soon) messages in L2 and L3 automated driving systems. Additionally, standards on
the maximum presentation limits of ICWs in an automobile (ISO 7731, 2003) are applicable in this setting.
In order for an auditory warning to be clearly perceived, it must be presented at an intensity that is substantially
greater than the MT. The MT represents the minimum intensity level at which a sound presented among masking
“background” noises is audible to a listener. It is important to note that the MT is not necessarily the same as the
ambient noise level, and several factors influence the MT.
Two sources (Lerner, Kotwal, Lyons, & Gardner-Bonneau, 1996); Campbell, Richman, Carney, & Lee, 2004)
recommend the warning intensity should be at least 20 dB and no more than 30 dB above the MT; however, other
sources (ISO, 2005; Lee et al., 2004) indicate that drivers can discern auditory warnings at as little as 10 dB above the
MT, and they recommend that auditory ICWs should be 10
-15 dB above the MT in order for the warning to be
reliably detected. Furthermore, the standards in MIL-STD-1472G (Department of Defense, 2012) require that caution
signals exceed the ambient noise environment by at least 15 dB and that alerting signals exceed ambient noise by at
least 20 dB. An ISO standard (ISO 7731, 2003) regarding danger signals in workplaces requires that at least one of
the following criteria are met in order for non-speech signals to be clearly audible: (1) the A-weighted sound pressure
level (SPL) of the signal must exceed the SPL of the ambient noise by more than 15 dB, (2) the SPL level must
exceed the MT by at least 10 dB in at least one octave band, or (3) the SPL must exceed the MT by at least 13 dB in
at least one 1/3-octave band. Most sources agree that the amplitude of auditory signals for ICWs should not exceed
the MT by more than 30 dB in order to avoid startling or annoying the driver. In any case, the maximum amplitude of
the warning should be limited. For auditory warnings in workplaces, ISO (2005) recommends a limit of 90 dBA.
Design Issues
Meeting these criteria can be challenging in noisy driving environments. If the MT in the vehicle is more than
75 dBA, the warning sound cannot meet the recommended 15 dB above the MT without violating the 90 dBA limit.
One strategy for improving audibility of auditory warnings is to mute in-vehicle systems that generate competing
auditory information or noise (e.g., stereo system or fans) (Kieffer et al., 1999) during warning presentation. Also,
auditory signals comprised of multiple frequencies will increase the likelihood that at least one frequency will be
detected. The ISO standard (ISO 7731, 2003) requires that the signal include frequency components in the range of
500-2500 Hz, and they recommended that there be two dominant components in the range of 500-1500 Hz.
Frequencies in this range fall within the range of hearing that is most sensitive in humans and are most likely to be
detected.
Lee et al. (2004) and Campbell, Bittner, Lloyd, Mitchell, and Everson (1997) recommend that the intensity of
cautionary crash warning (CCW signals should be less than the intensity of ICW signals in order to communicate a
lower level of urgency. Nevertheless, auditory CCWs should follow the same topics for minimum and maximum
intensity as the auditory ICW to ensure that the warning can be detected above other auditory signals in the vehicle
without being annoying or harmful. Signal characteristics other than intensity can be used to convey lower urgency
if lower intensity signals cannot be reliably detected (see 7-4).
Cross References
Perceived Urgency of Auditory Warnings, 6-2
Topic References
1. Edworthy, J., & Hellier, E. (2000). Auditory warnings in noisy environments. Noise Health, 2(6), 27-40.
2. ISO 7731 (2003). Danger signals for public and work areas—auditory danger signals. Geneva: International Organization for
Standardization.
3.
Lerner, N. D., Kotwal, B. M., Lyons, R. D., & Gardner-Bonneau, D. J. (1996, January). Preliminary human factors guidelines for crash avoidance
warning devices (Report No. DOT HS 808 342). Washington, DC: National Highway Traffic Safety Administration. Available at
https://archive.org/stream/preliminaryhuman00lern#page/n1/mode/2up
4. Campbell, J. L., Richman, J. B., Carney, C., & Lee, J. D. (2004). In-vehicle display icons and other information elements, Volume I:
Guidelines (Report No. FHWA-RD-03-065). McLean, VA: Federal Highway Administration. Available at
www.fhwa.dot.gov/publications/research/safety/03065/index.cfm
5. International Organization for Standardization. (2005). Road vehicles—Ergonomic aspects of in-vehicle presentation for transport
information and control systems—Warning systems (ISO/TR 16352). Geneva: Author.
6. Lee, S. E., Knipling, R. R., DeHart, M. C., Perez, M. A., Holbrook, G.T., Brown, S.B., . . . Olson, R.L. (2004). Vehicle-based
countermeasures for signal and stop sign violations: Task 1. Intersection control violation crash analyses. Task 2. Top-level system and
human factors requirements (Report No. DOT HS 809 716). Washington, DC: National Highway Traffic Safety Administration.
69
7. Department of Defense. (January 11, 2012). MIL-STD-1472G. Department of Defense Design Criteria Standard: Human Engineering. Washington,
DC: U.S. Government Printing Office. Available at http://everyspec.com/MIL-STD/MIL-STD-1400-1499/download.php?spec=MIL-STD-
1472G.039997.pdf
8. Kiefer, R., LeBlanc, D., Palmer, M., Salinger, J., Deering, R., & Shulman, M. (1999). Development and validation of functional definitions
and evaluation procedures for collision warning/avoidance systems (Report No. DOT HT 808 964). Washington, DC: National Highway
Traffic Safety Administration.
9. Campbell, J. L., Bittner, A. C., Jr., Lloyd, M., Mitchell, E., & Everson, J. H. (1997). Driver-vehicle interface (DVI) design guidelines for the
intersection collision avoidance (ICA) system. Seattle, WA: Battelle Human Factors Transportation Center.
70
Chapter 7. Haptic Interfaces
This chapter contains human factors design guidance on the use of haptic interfaces. There are
two types of haptic interfaces that are discussed in this chapter: vibrotactile and kinesthetic.
Although a full understanding of haptics is not necessary to use the guidance and topics in this
chapter, it will be valuable for users of this document to understand that vibrotactile and
kinesthetic interfaces have fundamental differences that impact how well drivers detect and
understand haptic messages.
Vibrotactile interfaces provide information to the driver using vibrations. Vibrotactile interfaces
need to be in physical contact with the driver to deliver information and, for L2 and L3 vehicles
where the driver is not contacting the pedals or steering wheel during automated driving, likely
work well when included in seat belts or the seats. The term vibrotactile is a combination of two
words, vibration and tactile. The word tactile is used to describe perception of being touched.
Tactile perception is a passive sense as tactile sensations are not necessarily associated with body
movements. This is a defining characteristic between vibrotactile interfaces and kinesthetic
interfaces and it has implications for detectability and understanding. Vibrotactile interfaces are
often used to deliver information that is abstract from haptic signal. In general, people can sense
when (e.g., temporal cue) and where on the body vibrations occur.
Kinesthetic interfaces provide information by causing limb or body motion. An example of this
type of interface is when brake pulse displays cause a sudden jerk motion of the vehicle, causing
the driver’s body to move. The word kinesthetic is used in relation to the ability to sense static
and dynamic body posture (e.g., knowing where your hands are located). Some kinesthetic
display types may help enhance awareness (e.g., vehicle brake pulses alert drivers by causing
entire body motions).
Vibrotactile and kinesthetic interfaces for automated driving systems are discussed throughout
this chapter. The topics addressed in this chapter include:
• Selecting a Haptic Display
• Improving Distinctiveness of Haptic Displays
• Accommodating for Vibrotactile Sensitivity Across the Body
• Generating a Detectable Signal in a Vibrotactile Seat

71
Selecting a Haptic Display
Introduction
This topic provides information about different types of haptic displays, high-level descriptions, and their potential
uses for safety-critical messages. The additional topics in this chapter provide important information that may be
used when selecting the type of display.
Design Goal (L2, L3): Integrate haptic displays with vehicle controls, seats, motion, or other elements of the
vehicle.
Supporting Design Guidance
The literature suggests that these haptic displays may be used in support of the design goal.
Types, implementations, and potential benefits and drawbacks of different haptic display types.
Haptic Display
Type
Implementation Potential Benefits Potential Drawbacks
Vehicle Brake
Pulse
One or more short
applications of the brakes to
create pulses of deceleration.
Effective, highly detectible,
may result in lower peak
deceleration.
Disruptive; likely to be rated
as annoying.
Vibrotactile
Seat
Vibration provided through
the seat or portion of the
seat.
Large display contact area;
driver likely to be in contact
with display; provides
general alert or temporal cue.
Difficult to provide
directional alerts; complex
alerts require
training/experience.
Seat Belt
Vibration
Vibration provided through
the fabric of a seat belt.
Moderate display contact
area; Most drivers are likely
to be in contact with display;
provides general alert or
temporal cue.
Not every driver wears their
seat belt; difficult to provide
directional alerts; complex
alerts require
training/experience.
Seat Belt
Pre-tensioner
Tightening or tugging of the
seat belt.
Helps orient driver to
forward roadway.
Not every driver wears their
seat belt; may be confused
with other events; alert may
be viewed as disruptive or
annoying.
Note: Vehicle brake pulses and vibrotactile seat displays are most likely to be detected by the majority of drivers. This
is due to the potential for large variability in driver seat positions during automated driving and overall seat belt use
trends in the United States.
Tip for making trade-off decisions between display effectiveness and user acceptance.
Use this heuristic: Intrusive and annoying haptic displays may lead to better response compliance but may reduce
overall user satisfaction.
Note: Vibrotactile haptic displays are often rated to be less annoying and less intrusive compared to auditory displays
and kinesthetic haptic displays like brake pulses and steering wheel torque rotation. Brake pulses more frequently
result in faster reaction times or better selection of appropriate driving maneuvers.
72
Discussion
Automotive haptic and tactile displays are an emerging area of research and development, especially in regards to
automated driving system driver-vehicle interfaces. The information in this chapter is primarily based on findings
from research examining the use of haptic displays in collision warning systems, international standards for displays,
and expert judgment. This section provides an overview of haptic display types and some of their key
characteristics.
Vehicle brake pulses as a haptic display have been tested in both simulator and on-road studies. One study showed
that brake pulses can be quite effective at getting a driver’s attention and drivers are more likely to detect a brake
pulse if it produces a sensation of “jerk” or “self-motion” (Lee, McGehee, Brown, & Nakamoto, 2012; Brown et al.,
2005). Overall, brake pulses may lead to lower peak deceleration because the vehicle is physically being slowed by
the brake pulses; as a result, drivers may not have to act out hard braking. One usability drawback is that drivers
tend to report that vehicle brake pulses are too disruptive, which can lead to annoyance ratings that are unfavorable.
Vibrotactile seats will be discussed in greater detail in other topics within this chapter. The implication from the
literature is that vibrotactile seat displays may function best as a general alert or temporal cue. Many design issues
limit the use of haptic displays for delivering complex messages; the topic on spatialized vibrotactile seat displays in
this chapter addresses this issue.
The use of seatbelt vibrations as a haptic display may only serve drivers as a temporal cue or general alert. The
correspondence between the warning and where the hazard is located is too tenuous for assuming that locations such
as “forward” are automatically implied.
Seat belt pre-tensioning can prompt the driver to the forward roadway for forward crash warning (FCW) systems
(Forkenbrock et al., 2011). However, the extent that these messages may be confused with other messages or events
must be considered before application in L2 or L3 automated driving settings. Additionally, providing information
through the seat belt must be done with the understanding that seat belt use is only 87 percent in the United States
(Pickrell & Liu, 2014); thus some users will not benefit from this type of display.
Auditory and visual displays can specify the meaning of a message through direct or indirect means. In-vehicle
haptic displays can only deliver messages indirectly, which leaves drivers to interpret the intended meaning. Some
haptic display characteristics can enhance how well drivers interpret the meaning of a haptic signal. There is some
general agreement across the literature that there should be adequate time for drivers to respond if the warning
messages are to be at all more useful than contextual cues from the environment (Lee, McGehee, Brown &
Marshall, 2006; Abe & Richardson, 2006). Adequate timing may help considerably when drivers need to derive a
message from an indirect signal. When haptic signals are in temporal correspondence with a lane departure, general
vibrations from the seat (ISO 17387, 2008) can be quite effective.
Design Issues
Although earlier guidelines generically indicate that tactile warnings may be used to indicate the direction of the
hazard and that this directional cue should be reserved for use during imminent situations (Lerner, Kotwal, Lyons, &
Gardner-Bonneau, 1996), there is no indication that there is an automatic cognitive process that supports this claim.
Studies on tactile warnings provide participants with a large amount of training (Fitch, Hankey, Kleiner, & Dingus,
2011; Jones, Gray, Spense, & Tan, 2008), and experience (Ho, Tan, & Spence, 2005).
Cross References
Selection of Sensory Modality, 4-6; Multimodal Messages, 4-8
Topic References
1. Lee, J. D., McGehee, D. V., Brown T. L., & Marshall, D. (2006). Effects of adaptive cruise control and alert modality on driver performance. Transportation
Research Record: Journal of the Transportation Research Board, 1980, 49-56.
2. Abe, G., & Richardson, J. (2006). The influence of alarm timing on driver response to collision warning systems following system failure. Behaviour &
Information Technology, 25(5), 443-452.
3. Abe, G., & Richardson, J. (2004). The effect of alarm timing on driver behaviour: an investigation of differences in driver trust and response to alarms according
to alarm timing. Transportation Research Part F: Traffic Psychology and Behaviour, 7(4-5), 307-22.
4. ISO 17387 (2008). Intelligent transport systems—Lane change decision aid systems (LCDAS)—Performance requirements and test procedures. Geneva:
International Organization for Standardization.
5. De Groot, S., de Winter, J. C. F., López-García, J. M., Mulder, M., & Wieringa, P. A. (2011). The effect of concurrent bandwidth feedback on learning the lane-
keeping task in a driving simulator. Human Factors, 53(1), 50-62.
6. Fitch, G. M., Hankey, J. M., Kleiner, B. M., & Dingus, T. A. (2011). Driver comprehension of haptic seat alerts intended for use in an integrated collision
avoidance system. Transportation Research Part F: Traffic Psychology and Behaviour, 14, 278-290.
7. Lee, J. D., McGehee, D. V., Brown, T. L., & Nakamoto, J. (2012). Driver sensitivity to brake pulse duration and magnitude. Ergonomics, 50(6), 828-836.
8. Brown, S. B., Lee, S. E., Perez, M. A., Doerzaph, Z. R., Neale, V. L., & Dingus, T. A. (2005). Effects of haptic brake pulse warnings on driver behavior during
an intersection approach. Proceedings of the Human Factors and Ergonomics Society 49th Annual Meeting, 1892-1896.
9. Forkenbrock, G., Snyder, A., Heitz, M., Hoover, R. L., O'Harra, B., Vasko, S., & Smith, L. (2011). A test track protocol for assessing forward collision warning
driver-vehicle interface effectiveness (Report No. DOT HS 811 501). Washington, DC: National Highway Traffic Safety Administration.
10. Pickrell, T. M., & Liu, C. (2014). Seat belt use in 2013: Overall results (Report No. DOT HS 811 875). Washington, DC: National Highway Traffic Safety
Administration.
11. Lerner, N. D., Kotwal, B. M., Lyons, R. D., & Gardner-Bonneau, D. J. (1996). Preliminary human factors guidelines for crash avoidance warning devices.
Interim report (Report No. DOT HS 808 342). Washington, DC: National Highway Traffic Safety Administration.

73
12. Jones, C. M., Gray, R., Spense, C., & Tan, H. Z. (2008). Directing visual attention with spatially informative and spatially noninformative tactile cues.
Experimental Brain Research, 186(4), 659-669.
13. Ho, C., Tan, H. Z., & Spence, C. (2005). Using spatial vibrotactile cues to direct visual attention in driving scenes. Transportation Research Part F: Traffic
Psychology and Behaviour, 8(6), 397-412.
Improving Distinctiveness of Haptic Displays
Introduction
This topic contains information on how to make haptic displays perceptively distinct. The design goal below
originates from ISO 17387 (2008) that indicates, “…warnings [should be] clearly distinguishable from other signals
of the same type within the vehicle.” This topic describes how designers could comply with the ISO standard when
using haptic displays.
Design Goal (L2, L3): Ensure haptic warnings are clearly distinguishable from other haptic signals in the
vehicle.
Supporting Design Guidance
The best available research on this topic suggests that this design goal can be met when:
Designers select haptic signals of higher intensity than the natural vibrations that also reach the driver
through the vehicle component used to deliver the signal (Ryu, Chun, Choi, & Han, 2010). Note, the
duration of high intensity signals can affect driver comfort levels.
Haptic displays are incorporated in those areas of the vehicle where the driver will remain in contact
with (e.g., seat pan, seat belt).
The duration of high intensity signals is within driver comfort levels.
Multiple simultaneous vibrations across the body are not used (Gallace, Ho, & Spence, 2007).
Apparent motion within vibrational surfaces is used to enhance distinctiveness; apparent motion can
be accomplished by sequentially activating vibrating motors in time-series. Note that for apparent
motion, the minimum distance between tactors motors needs to exceed the two-point threshold (see
Accommodating for Vibrotactile Sensitivity Across the Body, 7-6).
Sufficient training or documentation about function is provided for single systems with multiple
vibrotactile haptic signals used to represent different messages.
Examples of perceptibly different vibrotactile signals in the driver seat
(Fitch, Hankey, Kleiner, & Dingus, 2011).
Warning Type Haptic Signal
Forward Crash Warning (FCW) Two front tactors in the seat-pan simultaneously activated 5 times in a pulse
pattern (200 ms on, 50 ms off pattern).
Curve Speed Warning (CSW) Front tactors simultaneously activate for 1 second.
In-Vehicle Warning (IVW) Two front tactors in the seat-pan simultaneously activated 8 times in a double
pulse pattern (200 ms on, 50 ms off, 300 ms on, 200 ms off).
Lane Change Warning (LCW) Left or right tactor in the backrest activation in a pulse pattern.
Lane Departure Warning (LDW) Left or right tactor in the backrest activate for 1 second.
Note that there is a high degree of training required for drivers to be able to identify multiple unique vibratory
messages.
74
Discussion
This topic uses examples from the existing literature to illustrate how haptic displays could be designed to comply
with ISO standard 17387 (2008). The design methods mentioned in this topic are not mentioned within the standard.
Drivers may be engaged in a variety of non-driving related tasks while operating in either L2 or L3 automated driving
states (Llaneras, Salinger, & Green, 2013). This may lead to differences in gross body position, in addition to the driver
ceasing to have contact with the vehicle controls (i.e., steering wheel and pedal assembly). Areas such as the seat pan
(see topic 7-6) and seat belt should retain reliable levels of driver physical contact during automated operation.
Research on FCW systems has indicated that seat belt pre-tensioning can prompt the driver to the forward roadway
(Forkenbrock et al., 2011). However, the potential for this message to be confused with other messages or events
must be considered before application in L2 or L3 automated driving settings. Additionally, providing information
through the seat belt must be done with the understanding that seat belt use in the United States is only 87 percent
(Pickrell & Liu, 2014); thus some users will not obtain information from this type of display.
To ensure that vibrational signals from haptic displays are perceptively different from naturally occurring vibrations,
vibrational measurements of the vehicle component that will be used for the haptic display need to be obtained
under natural conditions, and then used to determine the vibrational parameters. In designing vibrotactile displays, it
is important to note that human sensitivity to vibration is highest at frequencies of 200-250 Hz; frequencies above or
below that range require larger amplitude vibrations (Kandel, Schwartz, & Jessell, 2000).
Specific instructions to the driver that indicate there are multiple haptic display information sources within any display
or vehicle may lead to better identification and usage of the signal (Ryu, Chun, Choi, & Han, 2010), but without this
instruction drivers may still benefit from general alerting properties (Fitch, Hankey, Kleiner, & Dingus, 2011).
Apparent motion can be used to cause contrast between the vibrational signals from a haptic display and any natural
vibrations. Natural vibrations do not cause apparent motion for in-vehicle components. Creating apparent motion by
progressively activating tactors within a vibrotactile seat display aids driver responses by enhancing detection (Lee,
McGehee, Brown, & Marshall, 2006).
Design Issues
Vehicle vibrations provide information about vehicle behavior, road conditions, etc. Additional haptic information
should be presented in a manner that is not masked by normal vehicle vibrations.
During L2 or L3 automated driving system operation, drivers may not be optimally positioned to view visual
displays and may not detect some auditory signals. Haptic displays can provide a method of alerting the driver in
these situations.
Avoid sending simultaneous haptic signals to the driver since humans are poor at processing multiple simultaneous
tactile signals (Gallace, Ho, & Spence, 2007). For example, when simultaneous tactile signals are delivered to the
hands and gluteus, a driver may only be able to pay attention to one of those signals. There are some cases when
multiple vibrating surfaces may be helpful for creating temporal redundancy.
Cross References
Designing Messages for Driver Comprehension, 4-2; Accommodating for Vibrotactile Sensitivity Across the Body,
7-6
Topic References
1. ISO 17387 (2008). Intelligent transport systems—Lane change decision aid systems (LCDAS)—Performance requirements and test procedures.
Geneva: International Organization for Standardization.
2. Ryu, J., Chun, J., Choi, S., & Han, S. H. (April, 2010). Vibrotactile feedback for information delivery in the vehicle. IEEE Transactions on Haptics,
3(2), 138-149.
3. Gallace, A., Ho, T. Z., & Spence, C. (2007). Multisensory numerosity judgments for visual and tactile stimuli. Perception & Psychophysics, 69, 487-
501.
4. Fitch, G. M., Hankey, J. M., Kleiner, B. M., & Dingus, T. A. (2011). Driver comprehension of haptic seat alerts intended for use in an integrated
collision avoidance system. Transportation Research Part F: Traffic Psychology and Behaviour, 14, 278-290.
5. Llaneras, R. E., Salinger, J., & Green, C. A. (2013). Human Factors issues associated with limited ability autonomous driving systems: Drivers'
allocation of visual attention to the forward roadway. Proceedings of the International Driving Symposium on Human Factors in Driver Assessment,
Training, and Vehicle Design, 7, 92-98.
6. Forkenbrock, G., Snyder, A., Heitz, M., Hoover, R. L., O'Harra, B., Vasko, S., & Smith, L. (2011). A test track protocol for assessing forward
collision warning driver-vehicle interface effectiveness (Report No. DOT HS 811 501). Washington, DC: National Highway Traffic Safety
Administration.
7. Pickrell, T. M., & Liu, C. (2014). Seat belt use in 2013: Overall results (Report No. DOT HS 811 875). Washington, DC: National Highway Traffic
Safety Administration.
8. Kandel, E. R., Schwartz, J. H., & Jessell, T. M. (2000). Principles of neural science (4th Ed.). New York: McGraw-Hill Health Professions.
9. Lee, J. D., McGehee, D. V., Brown, T. L., & Marshall, D. (2006). Effects of adaptive cruise control and alert modality on driver performance.
Transportation Research Record: Journal of the Transportation Research Board, 1980, 49-56.

75
Accommodating for Vibrotactile Sensitivity Across the Body
Introduction
This topic describes how a vibrotactile display corresponds to the body’s sensitivity to vibration. A driver’s ability
to perceive a haptic display is a function of vibration amplitude, frequency, duration, surface size, and the body
location where the vibrating surface of the vibrotactile display contacts the driver. Designers need to keep this in
mind when using vibration to deliver information to drivers.
Design Goal (L2, L3): Select a vibration intensity consistent with the sensitivity of the targeted body location.
Supporting Design Guidance
The best available research on this topic suggests that this design goal can be met when:
A larger vibrating surface area is used; this increases perceived intensity for low sensitivity body
regions.
Optimal vibration frequencies are selected; tactile sensitivity is optimal between 200 and 250 Hz
(Kandel, Schwartz, & Jessell, 2000), and highest between 150 and 300 Hz (Jones & Sarter, 2008).
Vibration intensity is increased or decreased by adjusting the vibration frequency or amplitude, but
not both. Note that only relative settings of amplitude and vibration are possible for some types of
vibrotactile displays (e.g., amplitude and frequency are coupled for most tactors that use an eccentric
rotating mass).
Proper tactor placement is used. For vibrotactile seats, use the ratio of the area of the seat where the
message will be presented to the two-point separation threshold between tactor motors to determine
the minimum density of vibrating motors within the vibrating surface area (e.g., Reiner, 2003).
Examples of locations for varying vibrotactile intensity.
Vibration sensitivity across body locations Minimum density of vibrating motors
This graphic is a generalization of vibration sensitivity.
Specifics are left out because of variability due to the
following:
• Individual differences in body mass will impact how
well vibrations are perceived.
• Clothing (e.g., shoes) will also impede vibrations and
affect how well vibrations are perceived.
• Drivers in L2 and higher levels of automation will not
necessarily have contact with the wheel or pedals.
The ratio between seat size and two-point threshold for
the area of the seat picture above results in a 6x4
matrix of tactor motors using the following:
( )
(
)
= ~
( )
(
)
= ~
Least Sensitive
1 - back
1 - gluteus
4 - mid-foot
3 - heel
2 - abdominal area
4 - hand
Most Sensitive
1 2 3 4
76
Discussion
The information in this topic was assembled using information from physiological research and a synthesis of
research on automotive vibrotactile displays. Basic physiology indicates that mechanoreceptors are distributed
differentially throughout the body, and skin density is not the same across the body. Both these factors influence
how vibrations are felt. Although there are several examples of in-vehicle vibrotactile displays that contact various
body sites (e.g., hands, feet, back, gluteus), empirical research is limited in regards to explaining how to form the
correspondence between vibrations from a vibrotactile display with the sensitivity of body sites. There is general
agreement from both basic and applied research that indicates detection performance improves when vibration
intensity from a vibrotactile display corresponds with physiological sensitivity to vibration.
Basic research has shown that increasing the vibrational surface area of a vibrotactile display increases perceived
intensity (Jones & Sarter, 2008; Cholewiak & Craig, 1984). One way this can be accomplished is by activating more
tactor motors within a larger array of tactors. There is a linear relationship between the number of tactors used to
generate a vibrating surface and a driver’s ability to detect the vibrating surface. More active tactors leads to higher
perceived intensity. This may be a result of the vibration reaching more of the mechanoreceptors within the skin.
When frequency is kept constant but amplitude gets increased, drivers perceive the frequency of the signal to
increase. This perceptual phenomenon is why there are large individual differences across people for their sensitivity
to vibration (Jones & Sarter, 2008). Amplitude and frequency of vibration can be used differentially within certain
vibrotactile displays (e.g., Rosario et al., 2010) but not all (e.g., Ji, Lee, & Hwang, 2011). When testing vibration
parameters, it will be important to note the vibrational elements that accomplish end-user performance goals.
Reiner (2003) calculated the tactor density for a vibrotactile display using the ratio of the size of the driver seat to a
two-point discrimination threshold distance for the driver’s back (e.g., 4 cm). It is advisable that designers measure
the two-point threshold using the seat that will contain the vibrotactile display. This is advised because the two-point
threshold will depend on characteristics that dampen and diffuse the vibration (e.g., seat fabric, cushioning).
Design Issues
There are some additional considerations when selecting the body site that will receive the information. Large body
areas like the gluteus, back and abdominal regions are not often used by people to pick-up information from their
environment (Gallace, Tan, & Spence, 2007). Although the research is limited on how this effects vibrotactile
display types, other haptic displays that deliver messages to the driver through the vehicle control elements
(e.g., steering wheel; Suzuki & Jansson, 2003) tend to enhance response time as a result of better correspondence
between the warning and the required maneuver.
In addition, the correlated effect of frequency and amplitude in perceiving vibration is different across the body.
Displacement has a stronger influence at some locations (e.g., the abdomen) and frequency has a stronger influence
at other locations (e.g., the fingertips) (Jones & Sarter, 2008). This will become a design consideration when
determining whether or not to increase intensity by changing vibration frequency or amplitude, but relevant research
on this consideration is very limited. To support display redundancy, use large vibrating surfaces to ensure the haptic
display makes contact with the driver; e.g., this can be accomplished using multiple vibrating motors embedded in
the seat (Fitch, Hankey, Kleiner, & Dingus, 2011).
Cross References
Selection of Sensory Modality, 4-6
Topic References
1. Kandel, E. R., Schwartz, J. H., & Jessell, T. M. (2000). Principles of neural science (4th Ed.). New York: McGraw-Hill Health Professions.
2. Jones, L. A., & Sarter, N. B. (2008). Tactile displays: Guidance for their design and application. Human Factors, 50(1), 90-111.
3. Reiner, A. (2010). Sensor-actuator supported implicit interaction in driver assistance systems. Wiesbaden, Germany: Vieweg+Teubner.
4. Cholewiak, R. W., &. & Craig, J. C. (1984). Vibrotactile pattern recognition and discrimination at several body sites. Perception and
Psychophysics, 35(6), 503-514.
5. Rosario, H., Louredo, M., Diaz, I., Soler, A., Gil, J. J., Solaz, J. S., & Jordi, J. (2010). Efficacy and feeling of a vibrotactile frontal collision
warning implemented in a haptic pedal. Transportation Research Part F: Traffic Psychology and Behaviour, 13(2), 80-91.
6. Ji, Y. J., Lee, L., & Hwang, W. (2011). Haptic perception in the vehicle seat. Human Factors and Ergonomics in Manufacturing and Service
Industries, 21(3), 305-325.
7. Gallace, A., Tan, H. Z., & Spence, C. (2007). The body surface as a communication system: The state of the art after 50 years. Presence, 16
(6), 655-676.
8. Suzuki, K., & Jansson, H. (2003) An analysis of driver’s steering behavior during auditory or haptic warnings for designing of lane departure
warning system. JSAE Review, 24, 63-70.
9. Fitch, G. M., Hankey, J. M., Kleiner, B. M., & Dingus, T. A. (2011). Driver comprehension of haptic seat alerts intended for use in an
integrated collision avoidance system. Transportation Research Part F: Traffic Psychology and Behaviour, 14, 278-290.
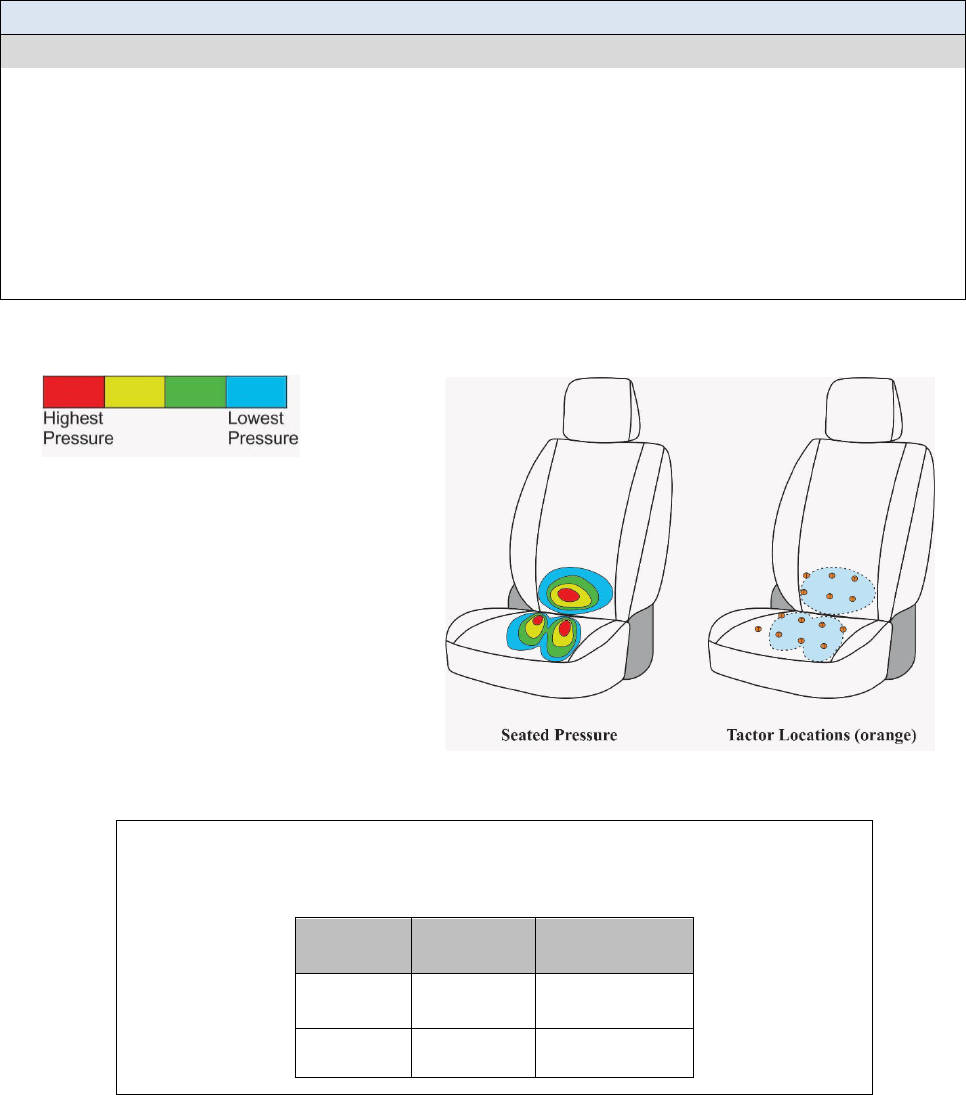
77
Generating a Detectable Signal in a Vibrotactile Seat
Introduction
This topic contains information on where to place vibrating motors to create a vibrotactile haptic display within the
driver seat. Vibrotactile seat displays appear across the literature for a wide variety of applications. A critical design
element is to ensure the vibration signal is detectible across drivers and the situations they encounter.
Design Goal (L2, L3): Ensure drivers can feel the vibrations from the vibrotactile seat.
Supporting Design Guidance
The best available research on this topic suggests that this design goal can be met when:
There is contact between the driver and the tactile display. To do this, place tactors where seated
pressures are the highest. Use measurements of pressure for an average driver in the seated position
for the seat that will contain the vibrotactile display. Seat pan pressure distribution plots may be
sufficient.
Vibrations are measured at the surface of the seat where the intended message is to occur. This will
help to ensure that the selected intensity surpasses any attenuation accounted by seat materials.
The selected combination of frequency and amplitude has high detectability.
A diverse sample of people is used to test different vibration settings.
Illustration of seat pressure distribution for selecting vibrating surfaces.
The left image depicts a hypothetical seat
pressure distribution and the right image
depicts where tactor motors could be
placed to ensure contact with a driver in
this seat.
Note on the illustration: the pressure distribution shown in
the left image is an artistic rendition. It does not reflect
real data. The tactors in the right image are not to scale.
Examples of the vibration frequency and amplitude for vibrotactile display types at two seat regions.
Detectable vibration measurements from seat pan and and back rest surfaces of a
vibrotactile seat display [1]:
Seat
Region
Frequency
Range
Amplitude
Range
Seat Pan 26 to 30 Hz 2.02 to 2.65 g
Back Rest 30 to 34 Hz 2.65 to 3.38 g
78
Discussion
The practice of using seat pressure distributions to place vibratory signals at locations of greater seat pressure is
common (Ji, Lee, & Hwang, 2011; Fitch, Kiefer, Hankey, & Kleiner, 2007; Hogema, Sjoerd, Van Erp, & Kiefer,
2009; Reiner, 2010). Three potential reasons for designers and researchers to do this are:
1) Seat-pressure distribution provides an indication of where on the seat the driver is likely to be seated
(Reiner, 2010),
2) The transfer of vibrational energy from the vibrating surface to the receptors in the skin that sense vibration
is more efficient when friction is highest between the vibrating surface and the driver (Dobbins &
McKinley, 2008), and
3) The weight of the driver on the vibrating motor will change the vibration frequency it supplies; this has
implications for the amount of frequency and amplitude that should be used to overcome variability in
driver size and weight and retain a detectable signal. The response of tactors to this loading effect is not
uniform across all tactor types.
Although there are only a few studies where the researchers used an accelerometer to measure vibration at the
surface of the seat (Ji, Lee, & Hwang, 2011; Hogema, Sjoerd, Van Erp, & Kiefer, 2009; Higuchi &
Raksincharoensak, 2010), this is a far better practice than relying on the operating frequency reported by
manufacturers of vibrating tactor motors. Vibrational energy from an embedded tactor has to travel through seat
materials to reach the driver. The attenuation of this energy will correspond with the amount of and type of material
that the vibration has to travel through to reach the driver. Any adjacent material that absorbs the vibrational energy
will cause a similar problem. Thus, any seat material that is positioned between and around the vibrating motor
should be of an appropriate impedance to ensure adequate propagation of the vibrational energy (Dobbins &
McKinley, 2008).
Although only a few relevant studies demonstrate that both vibration frequency and amplitude are important for
making an effective vibrotactile display (Rosario et al., 2010; Ji, Lee, & Hwang, 2011), this concept is well
supported and universally accepted.
There are many individual differences that impact how well people detect vibrations. Some known factors are body
composition and attire. These elements need to be considered when selecting test participants during the design test
phases. Skin mass and clothing impede as well as diffuse vibrational energy.
Design Issues
Vibration Frequency and Amplitude are not always Separately Controllable: Many actuators that are used for
vibrotactile seat displays (e.g., a tactor with a spinning eccentric mass controlled by a motor) have only a voltage
input. With these types of vibrating motors, frequency and amplitude can only be measured rather than controlled
independently (Ji, Lee, & Hwang, 2011). Due to their differing actuation methods, different tactor types have
different operating properties. In addition to the peak frequency of the vibrotactile display, the rise time, duty cycle,
and amplitude range should be considered. Also, properties such as the response of the display to loading (e.g., a
person sitting atop the display) and its surrounding material should be carefully considered as some types of
vibrotactile displays rely upon rotation of an eccentric mass to operate and do not respond as well under loaded
conditions as other vibrotactile display types.
Postural changes while driving may affect the detectability of a vibrotactile display: One researcher suggests the
continual variability in posture can be accounted for by using built-in pressure sensors that detect postural changes.
A system can then subsequently adjust the vibrational surface area to correspond to changes in seated pressure. This
ensures the tactors located at the highest seated pressure zone are active and the signal is appropriately intense
(Reiner, 2010). However, particularly in L3 automated driving systems, the driver’s position and posture are less
certain than in other vehicles where the driver is in a typical driving posture. This change in loading upon the seat
pan may affect the efficacy of a vibrotactile display.
The physical distance between the driver and the vibrating motor plays a role in how much of the signal actually
reaches the driver (Dobbins & McKinley, 2008). The greater the distance, the less of the actual signal reaches the
driver.
Cross References
Accommodating for Vibrotactile Sensitivity Across the Body, 7-6
Topic References
1. Ji, Y. J., Lee, L., & Hwang, W. (2011). Haptic perception in the vehicle seat. Human Factors and Ergonomics in Manufacturing and Service
Industries, 21(3), 305-325.
2. Fitch, G. M., Kiefer, R. J., Hankey, J. M., & Kleiner, B. M. (2007). Toward developing an approach for alerting drivers to the direction of a
crash threat. Human Factors, 49(4), 710-720.
79
3. Hogema, J. H., Sjoerd, C. D. V., Van Erp, J., & Kiefer, R. J. (2009). A tactile seat for direction coding in car driving: Field evaluation. IEEE
Transaction on Haptics, 2(4), 181-188.
4. Reiner, A. (2010). Sensor-actuator supported implicit interaction in driver assistance systems. Wiesbaden, Germany: Vieweg+Teubner.
5. Dobbins, T., & McKinley, A. (2008). Integration issues of tactile displays in military environments. In J. B. F. van Erp & B.P. Self (Eds.),
Tactile displays for orientation, navigation and communication in air, sea and land environments (RTO Technical Report TR-HFM-122).
NATO Science and Technology Organization.
6. Higuchi, M., & Raksincharoensak, P. (2010). Seat vibrotactile warning interface for forward vehicle collision avoidance. Proceedings of the
SICE Annual Conference 2010, 1370-1373.
7. Rosario, H., Louredo, M., Diaz, I., Soler, A., Gil, J. J., Solaz, J. S., & Jordi, J. (2010). Efficacy and feeling of a vibrotactile frontal collision
warning implemented in a haptic pedal. Transportation Research Part F: Traffic Psychology and Behaviour, 13(2), 80-91.
80
Chapter 8. Driver Inputs
This chapter provides information related to driver inputs to automated driving system control
functions. Automated driving is an emerging topic and, as such, limited information is available
on specific driver input methods. Therefore, the topics included in this chapter were created from
basic human factors information, previously published guidelines, and current interface
standards.
At a high level, automation controls that must be used while in manual driving (such as those
used to activate automation) can be designed with consideration to reducing the frequency and
complexity of driver interactions when the vehicle is moving. This will minimize driver
distraction and eyes-off-road time during the manual-to-automated driving transition. Optimal
systems can support drivers’ quickly and easily finding the control, discerning how it is used,
and performing the operation with minimal error. Also, the optimal system response following
the driver input is timely and intuitive.
It is difficult to definitively guide the design of controls for automated driving system DVI due to
the multitude of ways that the systems could be implemented. The system may be designed for
one or more specific use cases (e.g., highway speed automation, traffic jam assist, or automated
valet parking), could depend on controls that have multiple uses, and could be designed to
interface with a nomadic device. Each of these system implementations has its own specific
constraints that it imposes on the interface controls.
The following topics are included in this chapter.
• General Guidance for Driver-DVI Interactions
• Control Placement
• Voice Recognition Inputs

81
General Guidance for Driver-DVI Interactions
Introduction
This topic provides specific information about the design of L2 and L3 automation controls to benefit driver safety
and usability. Ideally, the purpose and operation of well-designed controls will be obvious to drivers ((Lerner,
Kotwal, Lyons, & Gardner-Bonneau, 1996). Controls that are easy to understand and operate minimize distraction
from the driving task during manual to automated driving transitions. Poorly designed controls may adversely affect
or impair the operation of primary driving controls. Therefore, designers’ carefully consider of the placement and
operation of controls in relation to other controls and displays is important (Pomerleau et al, 1999; Stevens et al.,
2005). Since this is a broad topic and little published or publically available research specifically addressing L2 and
L3 automation control design is available, this guideline is primarily supported by basic human factors information.
Design Goal (L2, L3): Provide controls allowing for operation with minimal mental effort, eye glances, and
hand/finger movement.
Supporting Design Guidance
The best available research on this topic suggests that this design goal can be met when controls:
Provide feedback is timely and clear visual, tactile, or auditory feedback for control activation (AAM
2006; Bhise, 2011).
Have identifiable labels (symbols or text) that are visible and located close to the control (Bhise,
2011).
Are easily understood and interpretable (Bhise, 2011).
Placement does not adversely affect or interfere with other critical system components or primary
driving controls.
Size provides a sufficient grasp area and space for hand/finger clearance (Bhise, 2011).
Interaction pacing does not require an uninterruptible series of visual-manual interactions (AAM
2006).
Usage does not compromise the driver’s choice to keep at least one hand on the steering wheel at all
times. AAM principles state that controls on the steering wheel should not require simultaneous
inputs from both hands unless one of the hands only requires a single finger input (AAM 2006).
Methods of control evaluation (Bhise, 2011).
1. Reference and apply available methods, tools, models, customer feedback databases, design guidelines,
principles, and standards.
2. Develop and apply ergonomic checklists.
3. Conduct a task analysis of activities involving the control operation, to break down tasks into subtasks, and to
look for areas of improvement or situations where driver errors may occur.
4. Conduct in-vehicle evaluations where drivers perform a set of tasks using the control. Data collected can include:
time to use the control, errors made, driver likes and dislikes, etc.
5. Include other competitor’s products in the above evaluations to provide benchmarking information.
82
Discussion
Feedback: The feedback or confirmation provided by the system following driver input should be timely and clearly
perceptible (AAM 2006). Feedback could include a response to control activation, such as the physical and auditory
click of a button press, or a response from a system display, such as an informational dialog box or a system status
indicator icon. Timely and perceptible responses allow the driver to quickly determine that the system is reacting as
expected and that the change in the system is in reaction to their input. This allows drivers to understand when they
have successfully activated automated driving without making second (and perhaps conflicting) inputs or having
uncertainty about the system status.
Identification: Controls are often labeled with the control function, its settings, or both. SAE Recommended Practice
J1138 (SAE, 2009) provides information on when control functions or settings should be labeled.
Interpretation: Automation controls should be intuitive to operate. The control design and movement should match
the driver’s expectations of how the system and application function, especially if mapped with similar functions
such as ACC or lane keeping.
Placement: Automation controls should be placed such that the operation of the control does not adversely affect the
operation of a primary driving control, especially during the transition into or out of automated driving. More
information can be found in Control Placement, 8-4.
Size: The controls themselves need to be physically usable by the driver. This includes designing space for the driver
to grasp the control and space around the control to allow the driver to operate it. As L2 and L3 systems can support
mobility across multiple user groups, additional testing with different populations may be required to ensure controls
are adequately sized.
Pacing: AAM (2006) provides a range of guidance regarding the pacing of control interactions; these “principles”
are generally applicable to the design of the automation DVI. Drivers should be able to control the pace of their
interaction with the system and the timing of the system prompts should be predictable for the task operation.
Drivers should have the option to not respond, delay a response, or temporarily suspend system prompts altogether.
The prompts should not convey that a response is needed urgently and that only one response is possible. If drivers
are interrupted, they should be able to resume at the point of interruption or another logical point. If the system times
out after a reasonable length of time, it should default in a predictable and appropriate way.
Usage: Overall, manual adjustment of controls should not interfere with a driver’s ability to drive safely. In many
driving situations, the vehicle can be driven safely with only one hand on the steering wheel, provided the other
hand is immediately available for steering if it becomes necessary. Interactions should be designed to require that
only one hand at a time needs to be removed from the steering wheel (Stevens et al., 2005).
Design Issues
Complex interactions, such as initial control settings, should be reserved for times when the vehicle is stopped. One
way to prevent certain interactions when the vehicle is moving is to use variable-function keys (i.e., keys that are
mapped to more than one function based on context) on a keypad or touch-screen. Since these keys are
programmable, complex control functions can be made available only at appropriate times. The designer must use
good judgment to determine which interactions should be allowed or denied while the vehicle is in motion
(Pomerleau et al., 1999; Campbell, Carney, & Kantowitz, 1998). The system should clearly indicate those functions
that are not for use while driving and when they are inaccessible (AAM 2006).
Cross References
Control Placement, 8-4; Voice Recognition Inputs, 8-6
Topic References
1. Lerner, N. D., Kotwal, B. M., Lyons, R. D., & Gardner-Bonneau, D. J. (1996, January). Preliminary human factors guidelines for crash avoidance
warning devices (Report No. DOT HS 808 342). Washington, DC: National Highway Traffic Safety Administration. Available at
https://archive.org/stream/preliminaryhuman00lern#page/n1/mode/2up
2. Pomerleau, D., Jochem, T., Thorpe, C., Batavia, P., Pape, D., Hadden, J., . . . Everson, J. (1999). Run-off-road collision avoidance using
IVHS countermeasure (Report No. DOT HS 809 170). Washington, DC: National Highway Traffic Safety Administration.
3. Stevens, A., Hallen, H., Pauzie, A., Vezier, B., Gelau, C., Eckstein, L., . . . Höfs, W. (2005). European statement of principles on the design
of human machine interaction (ESoP 2005, Draft). Directorate-General Information Society Technologies and Media of the European
Commission.
4. Alliance of Automobile Manufacturers (AAM). (2006). Statement of principles, criteria and verification procedures on driver interactions
with advanced in-vehicle information and communication systems, including 2006 updated sections [Report of the Driver Focus-Telematics
Working Group]. Retrieved from www.autoalliance.org/index.cfm?objectid=D6819130-B985-11E1-9E4C000C296BA163
5. Bhise, V.D. (2011). Ergonomics in the automotive design process. Boca Raton, FL: CRC Press.

83
6. SAE. (2009). SAE J1138: Design criteria—Driver hand controls location for passenger cars, multipurpose passenger vehicles, and trucks
(10,000 GVW and under). Warrendale, PA: SAE International.
7. Campbell, J. L., Carney, C., & Kantowitz, B. H. (1998). Human factors design guidelines for advanced traveler information systems (ATIS)
and commercial vehicle operations (CVO) (Report No. FHWA-RD-98-057). Washington, DC: Federal Highway Administration.
Control Placement
Introduction
This topic provides information about the placement of automation-specific controls in the vehicle. The application
and placement of these controls must not interfere with the primary task of driving the vehicle. Drivers are best-
supported when they can find, reach, and comfortably use controls in the location that they are placed. There is a
lack of published research on the placement of automation controls; therefore, this topic primarily reflects more
general in-vehicle control placement information and design convention.
Design Goal (L2, L3): Ensure control placement and operation does not interfere with the driving task or the
use of other driving controls.
Supporting Design Guidance
The best available research on this topic suggests that this design goal can be met when controls:
• Are easy for drivers to reach and find (Bhise, 2011).
• Are located in a visible area or able to be found blindly (Bhise, 2011).
• Do not obstruct the driver’s field-of-view, vehicle displays, or other vehicle controls (AAM, 2006).
• Are placed such that they are not obstructed by other vehicle controls or displays (Bhise, 2011).
• Do not require the driver to reach their whole hand through the steering wheel (AAM, 2006).
The following figure shows the ideal zone for locating controls within the vehicle.
Diagram of ideal control placement region relative to the driver (Bhise, 2011).
Adapted from Bhise (2011). Copyright 2011 From Ergonomics in the automotive design process by V. D. Bhise. Reproduced by permission of
Taylor and Francis Group, LLC, a division of Informa plc.
Midpoint of centroids of
left and right eyel lipses
35 Degree down angle line
Straight-ahead si ghtline
(horizontal )
H
35°
(See Discussion)
H
C
C
V
Vertical axis
of the cone
V
Maximum reach envelope
84
Discussion
Little published research on the placement of L2 and L3 automated driving system specific controls is available.
However, guidance from standards-setting organizations (AAM, 2006; SAE, 2007; ISO, 2005) and current industry
practices with regard to L1 automated systems (specifically, ACC) can provide helpful information for the
placement of automation controls.
Controls should be easy for the driver to reach and operate. As shown in the figure on the previous page, controls
should be located within the driver’s maximum reach envelope. A reach envelope is a depiction of the area that
drivers can reach within the vehicle, usually represented by a sector of a circle drawn in front of the seated driver.
The values for the maximum reach envelope are described in SAE Recommended Practice J287 (SAE, 2007). The
reach distance data in that standard reflects a distance at which drivers can grasp a knob, rather than simply touch a
control.
Controls should ideally be located above the 35-degree down-angle cone, which is constructed by a line 35 degrees
below the horizontal straight-ahead sightline, through the midpoint of the two eyellipse centroids, and rotated around
the vertical axis through that midpoint. A 30- to 35-degree cone is the limit of the area where drivers can look down
for a control and still detect stop lamps of lead vehicles (Bhise, 2011). Stevens et al. (2005) and ISO (2005) agree
that controls that require lengthy interactions should be placed within 30 degrees of the driver’s normal field of
view. Controls outside of that area should be able to be found blindly. In addition, frequently used controls should
be placed within easy reach and in alignment with the forward view in order to reduce glance times.
Automation controls should not obstruct or interfere with the use of other controls or displays. Stevens et al. (2005)
provides good and bad examples of control design. A good design would incorporate controls that are located within
fingertip reach of the steering wheel. In contrast, a poorly designed control might include a rotary control
concentrically mounted on the steering wheel that requires enough activation force to inadvertently induce a change
in steering angle when activated. There is an area of the instrument cluster that can be viewed through the steering
wheel; however, if controls are placed in this area, drivers must be able to operate them without reaching their hand
through the steering wheel.
The implementation of ACC controls provides useful lessons. Common configurations for ACC controls in
production vehicles, including controls for changing headway settings, are found on the outer edge of the steering
wheel. This location allows for drivers to more easily manipulate the controls. Placing frequently used low-priority
controls (e.g., radio station seek controls) directly adjacent to safety-related controls, such as a gap sensitivity
control, is not recommended. The reason for this is that in the course of using the low-priority control, drivers could
inadvertently and unknowingly change the settings of the automation control, which could result in the vehicle
operating differently than how the driver expects.
Design Issues
Nomadic device (i.e., smartphone) vehicle integration and pass-through voice recognition is becoming more
common in new vehicles. When coupled with an L2 or L3 automated driving system, nomadic devices have the
potential to directly interact with automation functions, such as providing a means of inputting a navigation
destination. These devices provide unique challenges for the DVI designer as the devices change much more rapidly
than vehicle software or platforms, and due to the fact that drivers may interact with the devices in a manner
different than how they expect to interact with the vehicle. This is a rapidly developing area and further research is
needed prior to issuing any stronger guidance for the DVI.
Topic References
1. Bhise, V. D. (2011). Ergonomics in the automotive design process. Boca Raton, FL: CRC Press.
2. Alliance of Automobile Manufacturers (AAM). (2006). Statement of principles, criteria and verification procedures on driver interactions
with advanced in-vehicle information and communication systems, including 2006 updated sections [Report of the Driver Focus-Telematics
Working Group]. Retrieved from www.autoalliance.org/index.cfm?objectid=D6819130-B985-11E1-9E4C000C296BA163.
3. SAE. (2007). SAE J287: Driver hand control reach. Warrendale, PA: SAE International.
4. Stevens, A., Hallen, H., Pauzie, A., Vezier, B., Gelau, C., Eckstein, L., . . . Höfs, W. (2005). European statement of principles on the design
of human machine interaction (ESoP 2005, Draft). Directorate-General Information Society Technologies and Media of the European
Commission.
5. International Organization for Standardization. (2005). Road vehicles—Ergonomic aspects of in-vehicle presentation for transport
information and control systems—Warning systems (ISO/TR 16352). Geneva: Author.
6. General Motors Corporation. (2005). Automotive collision avoidance system field operational test (ACAS FOT) final program report (Report
No. DOT HS 809 886). Washington, DC: National Highway Traffic Safety Administration.

85
Voice Recognition Inputs
Introduction
This topic addresses speech interactions between drivers and in-vehicle systems. It focuses on one-way speech input,
from the driver to the in-vehicle system. Although speech interactions may place cognitive demands on the driver,
unlike visual-manual interactions, they do not require drivers to take their eyes off the road and their hands off the
steering wheel. Some research has indicated that voice recognition systems are associated with increased off-road
glances (Owens, McLaughlin, & Sudweeks, 2011). Additionally, several simulator and on-road studies of speech
interfaces reported better lane-keeping, fewer glances away from the roadway, shorter glance durations, and lower
subjective workload when compared with visual-manual interfaces. However, some research has indicated that voice
recognition systems are associated with increased off-road glances (Lo & Green, 2013) and, therefore, it cannot be
assumed that using a speech input device does not have any consequences for driver performance. Performing
secondary tasks using speech input still utilizes cognitive resources and, therefore, does not eliminate risk
(Lumsden, 2008). The precise effects of specific system parameters and implementations of speech input on driver
workload and driver performance are largely unknown.
Design Goal (L2, L3): Implement speech controlled in-vehicle systems that have minimal input constraints,
provide user feedback, and have an error handling strategy.
Supporting Design Guidance
The best available research on this topic suggests that this design goal can be met when the user-input features
accommodate the following user requirements:
Conversation Style:
− A natural conversation flow and cadence between user and system is accommodated.
− Input vocabulary is minimized and is consistent with a terse interaction style.
System Feedback:
− When starting an interaction, there is a notification that the system is ready for input.
− After the user provides input, there is feedback so the user knows their input was received.
Error Handling:
− Speech input is only used when the consequences of recognition errors are low.
− The accuracy of the speech recognizer can affect driving performance (see table below).
General Design Goals (Lumsden, 2008) to consider:
− Reduce the user’s cognitive load during transitions between automated and manual driving.
− Reduce interaction time.
− Increase task completion rate.
− Use feedback to the user that reinforces correct use.
− Design so that the users can form a mental model of the system behavior.
− Design so that the system is both effective for an experienced user and appealing for a new user.
The accuracy of the speech recognizer, when considered with the number of steps required to complete a task, has a
large effect on the success rate of task completion. Shown in the table below is the probability of completing an
interaction using only as many steps as are required, given a fixed accuracy level for each step.
Number of steps required to complete an interaction
1
2
3
4
5
Accuracy level
of each step
0.99
0.99
0.98
0.97
0.96
0.95
0.95
0.95
0.90
0.86
0.81
0.77
0.90
0.90
0.81
0.73
0.66
0.59
0.80
0.80
0.64
0.51
0.41
0.33
0.70
0.70
0.49
0.34
0.24
0.17
0.60
0.60
0.36
0.22
0.13
0.08
0.50
0.50
0.25
0.13
0.06
0.03
86
Discussion
The available literature related to in-vehicle speech input is limited in empirical strength. Most of the design guidance
listed above were derived from studies with modest sample sizes, individual interface usability studies, the judgment of
experts in the field, or unpublished research results. Additional research in this area is needed to investigate the long-
term effects of real-world systems with varying accuracy/error rates, to fully determine the behavioral implications of
new speech technologies.
Conversation style: Driver interactions with the system should be paced by the driver (Lumsden, 2008). This leaves the
driver free to prioritize safe operation of the vehicle over responses to the in-vehicle system. When speaking, users
should be able to converse with the system using a normal conversational cadence. Drivers should not be required to
exaggerate their speech or insert artificial delays between words (Department of Defense, 2012). MIL-STD-1472G
(Department of Defense, 2012) states that “input vocabulary shall be minimized, consistent with system needs, and
selected to provide phonetically distinct elements to eliminate misinterpretation.” Additionally, in a study of user
preferences and responses to scenarios requiring speech input, 93 percent of commands issued were terse (Aldridge &
Lansdown, 1999).
System feedback: Lumsden (2008) recommends that the interaction is initiated with a push-to-talk (PTT; press and
release) button followed by a listening tone. This teaches the user to wait for the tone to begin speaking, which is
beneficial for the recognition accuracy of the speech recognizer. Manual system input has clear proprioceptive, visual,
and manual feedback; however, the feedback provided after giving speech input is less apparent. The system should
provide feedback to the user so they know that their input has been received and understood (Department of Defense,
2012). Popp and Färber (1993) investigated methods of providing feedback for non-transparent driver control actions
(i.e., actions that have long delays before reactions or barely noticeable reactions) performed using speech input. When
providing feedback to nontransparent driver speech input in a simulator, they found that an independent signal tone
without visual feedback produced the least negative effects. The visual display without signal tone also performed well.
These actions both relate to adjustments in L2 and L3 automated driving systems when a system adjustment may not be
immediately apparent.
Error handling: MIL-STD-1472G (Department of Defense, 2012) provides that speech recognition systems may be
used when “the consequences of recognition errors are low” and “identifying and correcting errors would be easy.” In a
simulator study, rejection errors (where the system did not respond to input) caused a smaller proportion of overall task
errors (5%) and were more robust against changes in system accuracy levels than substitution errors (where the system
matches the user input to an incorrect vocabulary word) (Gellatly & Dingus, 1998) Additionally, systems should
require little user training (Department of Defense, 2012).
General design goals: Lumsden (2008) provides a list of general design goals for automotive speech interfaces. It
should be noted that although the guidance is consistent with that found in other sources, the list is made from the
experience of the authors and their unpublished research. Drivers may still have off-road glances while providing voice
input. An examination of a production-type (modified) automotive voice recognition system for text messaging found
that voice interactions increased non-driving related glances and increased driver mental workload (Owens,
McLaughlin, & Sudweeks, 2011).
Design Issues
A simulator study of an in-vehicle speech system (Kun, Paek, & Medenica, 2007), found that the recognition accuracy
of the system affected lane position, when the accuracy level was very low (44%). Push-to-talk (PTT) button use also
affected driving performance when the recognition rate was low. When testing recognition rates of 90 percent, 75
percent, and 60 percent in a simulator, Gellatly and Dingus (1998) found that recognition rate did not affect driving
performance except for the lowest rate (60%). When looking at studies of recognition accuracy, it appears that the
systems function well even with relatively low accuracy levels; however, some negative effects on driving performance
have been reported. These issues are primarily relevant during transitions between different automation states, however
they should be considered during the design of the DVI.
Topic References
1. Owens, J. M., McLaughlin, S. B., & Sudweeks, J. (2011). Driver performance while text messaging using handheld and in-vehicle systems.
Accident Analysis & Prevention 43, 939-947. doi: doi:10.1016/j.aap.2010.11.019
2. Lo, V. E-W., & Green, P. A. (2013). Development and evaluation of automotive speech interfaces: Useful information from the human
factors and related literature. International Journal of Vehicular Technology, 2013, Article ID 924170. Retrieved from
www.hindawi.com/journals/ijvt/2013/924170/
3. Lumsden, J. (2008). Handbook of research on user interface design and evaluation for mobile technology, Volume I. Retrieved from
www.comm.rwth-aachen.de/files/lumsden122.pdf
4.
Department of Defense. (January 11, 2012). MIL-STD-1472G. Department of Defense Design Criteria Standard: Human Engineering. Washington,
DC: U.S. Government Printing Office. Available at http://everyspec.com/MIL-STD/MIL-STD-1400-1499/download.php?spec=MIL-STD-
1472G.039997.pdf
87
5. Aldridge, L. C., & Lansdown, T. C. (1999). Driver preferences for speech based interaction with in-vehicle systems. Proceedings of the
Human Factors and Ergonomics Society Annual Meeting, 977-981.
6. Popp, M.M. & Färber, B. (1993). Feedback modality for nontransparent driver control actions: Why not visually? In A. G. Gale, I. D.,
Brown, C. M. Haslegrave, H. W. Kryusse, & S. P. Taylor (Eds.), Vision in Vehicles—IV (pp.263-270). Amsterdam: Elsevier Science.
7. Gellatly, A. W., & Dingus, T. A. (1998). Speech recognition and automotive applications: Using speech to perform in-vehicle tasks.
Proceedings of the Human Factors and Ergonomics Society Annual Meeting, 1247-1251.
8. Kun, A., Paek, T., Medenica, Z. (2007). The effect of speech interface accuracy on driving performance. Proceedings of the 8th Annual
Conference of the International Speech Communication Association (Interspeech 2007), 2332-2335.
88
Chapter 9. Glossary
Adaptive Automation
A system operating under an adaptive function allocation system which reallocates
functions based on the combination of the operating environment and operator loads and
performance.
Adaptive Function Allocation
An automation strategy building on the complementary approach, which assumes criteria
to determine whether functions have to be reallocated, how and when based on changes
in the operating environment, loads or demands to operators and performance of
operators (Inagaki, 2003). An automation system that operates under an adaptive function
allocation is called adaptive automation.
Adaptive Cruise Control (ACC)
A speed control system that automatically adjusts vehicle speed to maintain a set
headway to vehicles ahead without the driver having to use the accelerator or brake.
When the sole automation in function (a lane centering system is not engaged), this is a
form of Level 1 automation.
Apparent Motion
A sensation of motion that is associated with the serial activation of static vibrating
surfaces. The serial activation of adjacent vibrations causes a sensation that the vibrating
surface is moving when, in fact, it is not.
Arcminute
One-sixtieth (1/60) of one degree (1°).
Auditory Icon
An auditory signal that sounds like a real object or event, such as a car horn.
Automation
A device or system that accomplishes all or part of a function that was previously, or
could be, performed, in part or fully, by a human operator (Parasuraman, Sheridan, &
Wickens, 2000).
Automation Etiquette
“The set of prescribed and proscribed behaviors that permits meaning and intent to be
ascribed to the actions [of the automation]” (Parasuraman & Miller, 2004).
A-weighted Sound Pressure Level (SPL)
A measure of the intensity of sound using decibels (dB) referenced to sound pressure
level (SPL). The measurement is weighted across the frequency spectrum using a profile
that accounts for the relative loudness perceived by human hearing.
89
Calibrated Trust
A state where the automation user’s trust in the automation, as well as their use of the
automation, is appropriately adjusted to the actual performance of the automation
(McGuirl & Sarter, 2006).
Clumsy Automation
A design or situation in which an easy task is automated while a more difficult task is left
for human performance, without assistance (Wiener, 1989).
Compensatory Principle
An automation strategy in which assigning system tasks is based on inherent capability so
that automated tasks are those that machines are better at than humans while manual tasks
are those that humans perform better machines (Fitts List; Fitts, 1951).
Complex Flash
In a visual display, the presentation of multiple signal flashes with varying “on” and “off”
times.
Complexity Creep
Refers to the practice of adding features and capabilities over time to systems, potentially
reducing the interpretability of information, reducing the predictability of the system, and
and/or slowing response time.
Comprehension
The perceptual and cognitive processes by which drivers interpret the meaning of a DVI
message. See also Message Comprehension.
Driver Distraction
A diversion or competing activity which takes the driver’s attention away from activities
which are critical for safe driving.
Driver-Vehicle Interface (DVI)
The means by which a driver gains information about the state of the vehicle (through
auditory, haptic/tactile, and visual displays) and provides control inputs to the vehicle.
Driver Workload
A psychological concept that represents the proportion or amount of mental and physical
capacity required by the driver to complete a task. Workload encompasses both driving
task and situational factors.
Driving Task
A sequence of actions taken by a driver leading to a goal; the driver will normally persist
in these actions until the goal is reached (AAM, 2006).
Duty Cycle
In a visual display, the percent of time within a cycle that the alert signal is in the “on”
state.
90
Dynamic Function Allocation
An non-static automation strategy which is complementary, enabling the human and
automation to trade-off which functions each performs based on the current situation.
Etiquette
A training approach using a set of heuristics that may enhance and improve a driver’s
interaction with the system, possibly leading to higher levels of both acceptance and
performance.
False Alarm
An alarm that indicates a threat is present when, in fact, no threat exists
Flash Rate (Frequency)
In a visual display, the number of signal flashes per second.
Fundamental Frequency
The lowest frequency in a periodic signal.
Glare
A visual phenomena which occurs when the visual adaptation level is substantially less
than the intensity of a light source within the visual field, causing physical discomfort or
pain (discomfort glare) and/or reduced visibility (disability glare).
Harmonic Content
The harmonics contained in a complex waveform. Complex waveforms consist of a
fundamental frequency and one or more frequencies greater than the fundamental.
Harmonics are frequencies that are integer multiples of the fundamental frequency.
Harmonic Series
The sequence of pitches derived from the multiples of its fundamental, or lowest,
frequency.
Head-Up Display (HUD)
A visual display that presents data in the area of the windshield in the driver’s direct
forward view. An image, such as a collision warning icon, is projected onto a transparent
surface—usually an angled, flat piece of glass or even the windshield itself—which
reflects the image toward the driver. Optically, the image is usually collimated to produce
an image that is perceived to be at infinity. This configuration allows the driver to see and
focus on the display without looking away from their normal viewpoint.
High Head-Down Display (HHDD)
A type of visual display that is mounted below the driver’s normal line of sight (i.e.,
below the horizon line) but within near peripheral vision. These displays are typically
mounted on the dashboard.
91
Human Factors
An applied, scientific field of study to understand the relationship between devices and
systems and their users, with the capabilities and limitations of human beings as the
central focus.
Kinesthetic Interface
An interface that provides information to the driver by causing limb or body motion such
as when the accelerator pedal “pushes back” against the driver’s foot.
Lane Centering Systems (LCS)
A driver assistive system that identifies the lane center and provides a steering torque to
maintain the vehicle path along the lane center. When the sole automation in function
(ACC is not engaged), this is a form of Level 1 automation.
Lane Keeping Systems (LKS)
A driver assistive system that detects lane markings and provides a steering torque to
prevent the vehicle from crossing a lane marking.
Lateral Warning Systems
Collision warning systems, such as blind spot warnings (BSW) or lane change merge
warnings (LCM), that provide information about hazards in the adjacent lanes or hazards
approaching from the side. These warning systems are primarily dependent on lateral
motion and acceleration to determine when to present warnings.
Legibility
Legibility goes beyond visibility or detection; it implies being able to discern shape or
character identity based on appearance.
Level of Automation
A taxonomy providing for definitions of different functional levels of automation.
NHTSA has defined 5 levels of automation, ranging from no automation (Level 0) to
driver-optional automation (Level 4). As the level of automation increases, a greater
number of driving subtasks are automated. Level 2 automation provides hands-off/feet-
off automation but requires the driver to monitor performance. Level 3 automation
provides hands-off/feet-off automation and does not require the driver to monitor
performance.
Longitudinal Warning Systems
Collision warning systems, such as forward collision warnings (FCW), that provide
information about hazards directly ahead or behind the vehicle. These warning systems
are primarily dependent on longitudinal motion and acceleration to determine when to
present warnings.
Low Head-Down Display (LHDD)
A type of visual display that is mounted further below the driver’s normal line of sight
(i.e., below the horizon line) than is found in a HHDD. These displays are typically
mounted in places such as the instrument panel or the center console, which places the
displayed content farther in drivers’ peripheral vision than a HHDD or HUD.
92
Luminance
The luminous intensity per unit area of light measured as candela per square meter
(cd/m
2
).
Masked Threshold (MT)
The quietest level of a signal that can be perceived in the presence of noise.
Mental Model
An individual’s thought processes and representation about how the automated system
works in the real world.
Message Complexity
Refers to the quantity and variety of basic information elements contained within a
message, as well as the relationships between these elements, how the driver will use the
information, and the value of the information.
Message Comprehension
Refers to the perceptual and cognitive processes by which drivers interpret the meaning
of a message presented through a DVI and includes three stages: extractions, recognition,
and interpretation.
Message Priority
The order of presentation of two or more in-vehicle messages with the order indicating
level of importance.
Mode Awareness
The state of the user correctly understanding under what automation state the system is
operating.
Mode Error
An error resulting from a failure of mode awareness. When a user forgets what state of
automation the system is in and performs an action appropriate to a different state.
Motion Cue
Visual display alert which contains an element of motion within the “on” state, including
bouncing, zooming, and graphical movement.
Multimodal Message
A message consisting of more than one type of signal from the visual, haptic, and
auditory modalities.
Nuisance Alarm
An alarm that correctly indicates a threat is present but the driver does not believe the
alarm is warranted or needed.
Occlusion
Obstructing the view of an interface, driving scene, or other area of interest.
93
Out-of-the-loop Phenomenon
A situation where the driver is removed from the normal control process due to
automation and experiences a subsequent reduction in his or her awareness of the
vehicle’s current state and level of performance (Kaber & Endsley, 1997).
Overtone
Complex waveforms consist of a fundamental frequency and one or more frequencies
greater than the fundamental. Overtones are any frequencies that are greater than the
fundamental. Harmonics, which are frequencies that are integer multiples of the
fundamental, are a special type of overtone.
Psychophysical Relationship
The relationship between a stimulus and the perceptions and sensations induced by the
stimulus.
Reach Envelope
The area within the vehicle that drivers can reach, usually represented by a sector of a
circle drawn in front of the seated driver. The values for the maximum reach envelope are
described in SAE Standard J287 and reflect the distance at which drivers can grasp a
knob, rather than simply touch a control.
Redundancy
More than one cue for a specific threat or hazard which can be given at the same time
using two or more modes or repeated across time with either the same or different modes.
Residual Function Principle
The earliest automation philosophy in which the automation is designed to perform as
many functions as possible while the remaining functions are performed by the human.
Resolved Musical Structure
A sequence based on natural scales, which consist of musical notes ordered by pitch (e.g.,
tones with frequencies that correspond to notes that can be played on a piano).
Seat Pressure Distribution
The pressure from a seated person acting as a force on a seat (e.g., how the pressures
from body weight are distributed across a seat-pan and back-rest).
Secondary Task
A voluntary task which distracts a driver’s attention away from the main driving task at
hand.
Semantic Content
The meaning contained in an auditory message, whether presented as a speech message
or other type of auditory signal.
94
Semitone
The smallest musical interval that is commonly used in Western music. Mathematically,
the frequency of a semitone is 2
1/12
times the frequency of the fundamental when the
semitone is a higher pitch than the fundamental.
Short-cycle Automation
Automated task operation in which manual control is alternated with short periods of
automation based on other operation environment elements, either the automation or the
human can instigate the change in control.
Situational Awareness
“The perception of the elements in the environment within a span of time and space, the
comprehension of their meaning and the projection of their status in the near future.”
(Endsley 1995)
Spatially Localized Cues
Auditory cues that are perceived to emanate from a specific location within a three
dimensional sound stage.
Take Control Message
Communication from the automation system to the driver requesting that the driver
resume manual control of the vehicle.
Transfer of Control
The transition between states of manual and automated control of the vehicle.
Tell-tale
An indicator which displays the status of a situation or system.
Transport Information and Control Systems (TICS)
Systems which improve the safety and efficiency of land-based transportation through the
use of automation and technology.
Two-point Threshold
The minimum separation distance needed for two distinct objects to be felt separately,
rather than as a single sensation, based off of two-point discrimination, which is an ability
to distinguish adjacent objects that are touching the skin as being independent objects.
Veiling Luminance
Uniform luminance that causes a reduction in contrast as it washes over the retina. It is
caused when the eye is exposed to a light source that is substantially more intense than
the adaptation level.
Vibrotactile Interface
An interface which provides information to the driver using physical vibrations of the
seat, seat belt, foot pedals, or steering wheel against the driver’s body.
95
Chapter 10. Index
Abbreviations (Chapter 11), 11-1
Accuracy, 5-11, 8-6, 8-7
Adaptive Automation, 1-3, 1-8
Adaptive Function Allocation, 1-3
Auditory Icons, 1-10, 4-4, 6-1
Auditory Interfaces (Chapter 6), 6-1
Auditory Messages, 4-2, 4-4 thru 4-7, 6-1, 6-3
Loudness, 4-2, 6-3, 6-6 (topic)
Perceived Annoyance of, 6-4 (topic)
Perceived Urgency of, 6-2 (topic)
Automation
Current Mode and Status, 3-2 (topic)
Driver Mental Models, 3-10 (topic)
Driver Training, 3-10, 3-11, 4-3, 49, 7-2 thru 4, 8-7
Driver Training Material, 3-14 (topic)
Etiquette, 3-16 (topic)
Messages, Display Properties, 3-4 (topic)
Special Considerations for Level 2 and Level 3, 3-12 (topic)
Transferring Control to Driver, 3-8 (topic)
Transferring Control to System, 3-6 (topic)
Cautionary Warnings, 5-9, 6-5 thru 7
Character Height for Icons and Text, 4-2, 5-10 (topic)
Compensatory Principle, 1-2
Control Placement, 8-3, 8-4 (topic)
Display Glare, 5-2, 5-4 (topic)
Distraction/Distracted Driving, 1-2,1-5, 3-1, 3-7, 4-1, 4-5, 4-6, 4-9, 5-6,
5-7, 5-13, 6-3, 6-5, 8-1, 8-2
Driver Comprehension, 4-5, 4-6, 4-8, 5-12, 6-1,
Designing Messages for (topic), 4-2
Driver Inputs (Chapter 8), 8-1
Driver-DVI Interactions, General Guidance, 8-2 (topic)
Dynamic Function Allocation, 1-3
Equations (Chapter 12), 12-1
Eye Glance, 8-2
False and Nuisance Alarms, 1-7, 5-13, 6-4, 6-5
Flashing Signals, 3-4, 3-12, 4-2, 5-1, 5-3, 5-12, 5-13
General Guidance for Level 2 and Level 3 Automation (Chapter 3), 3-1
Glossary (Chapter 9), 9-1
96
Haptic Displays/Signals, 3-4, 4-2, 4-4 thru 9, 5-9
Distinctiveness, 7-4 (topic)
Detectable Signal in a Vibrotactile Seat, 7-8 (topic)
Selection of, 7-2 (topic)
Vibrotactile Sensitivity Across the Body, 7-6 (topic)
Haptic Interfaces (Chapter 7), 7-1
Head-Up Displays (HUDs), 4-6 thru 8, 5-2, 5-3, 5-6 (topic), 5-13
High Head-Down Displays (HHDDs), 4-6, 4-8, 5-2, 5-3, 5-7
Imminent Collision Warning (ICW), 6-6, 6-7
Index (Chapter 10), 10-1
Lane Change Warning (LCW), 7-4
Lane Departure Warning (LDW), 1-4, 4-7, 7-4
Message Characteristics (Chapter 4), 4-1
Message Complexity, 4-4 (topic)
Mode Awareness Failure, 1-8, 3-7
Multimodal Messages, 3-16, 4-8 (topic)
Nomadic Devices/Systems, 8-1, 8-5
Redundancy, 3-16, 4-6, 4-8, 4-9, 7-5, 7-7
References (Chapter 14), 14-1
Relevant Documents From USDOT, SAE International, and ISO (Chapter 13), 13-1
Residual Function Principle, 1-2
Seat Pressure Distribution, 7-8, 7-9
Sensory Modality, Selection of, 4-6 (topic)
Situation Awareness, 1-12, 3-2, 3-12, 3-13
Speech Messages, 4-5, 4-8, 6-1, 6-3
Status Information, 1-2, 1-5, 1-6, 1-7, 1-8, 1-11, 1-12, 3-2 (topic), 3-6 thru 10, 3-12,
3-13, 3-16, 4-6, 5-7, 5-8, 8-3
Display Properties for, 3-4 (topic)
Types of Status Information, 3-2
Training Material for Automated Driving System Applications, 3-14 (topic)
Transitions, 1-1, 1-5, 1-16, 1-10, 3-2 thru 9, 3-12, 3-13, 4-5, 5-1, 5-7, 5-12, 8-1 thru
3, 8-6, 8-7
Urgency, 3-5, 3-8, 4-2, 5-8, 5-9, 5-12, 5-13, 6-1, 6-2 (topic), 64 thru 6-7
Visual Displays
Glare, 5-2, 5-4 (topic)
Locations, 4-6, 4-8, 5-1, 5-2 (topic), 5-4, 5-9
Using Color, 4-2, 5-1, 5-3, 5-8 (topic)
Temporal Characteristics, 4-2, 4-8, 4-9, 5-12 (topic), 7-1 thru 3, 7-5
Visual Interfaces (Chapter 5), 5-1
Voice Recognition Inputs, 8-5, 8-6 (topic)
97
Chapter 11. Abbreviations
AAM .................................................................................... Alliance of Automobile Manufacturers
ACAS ............................................................................... Automotive Collision Avoidance System
ACC ............................................................................................................ adaptive cruise control
ADAS .................................................................................... Advanced Driver Assistance System
AHS .................................................................................................... Automated Highway System
ANSI .................................................................................... American National Standards Institute
BSMS ................................................................................................ blind spot monitoring system
BSW ................................................................................................................... blind spot warning
CCW ................................................................................................... cautionary collision warning
cm .................................................................................................................................. centimeter
CSW ............................................................................................................. Curve Speed Warning
DARPA ....................................................... Defense Advanced Research Projects Administration
dB ......................................................................................................................................... decibel
dBA ................................................................................................................ decibel (A-weighted)
DVI ............................................................................................................ Driver-Vehicle-Interface
EID ...................................................................................................... Ecological Interface Design
FAA ............................................................................................... Federal Aviation Administration
FCW ........................................................................................... Forward Collision/Crash Warning
FHWA .......................................................................................... Federal Highway Administration
FMCSA ...................................................................... Federal Motor Carrier Safety Administration
FMVSS ............................................................................ Federal Motor Vehicle Safety Standards
FTA ................................................................................................. Federal Transit Administration
g ............................................................... acceleration/deceleration level (1 g = approx. 9.8 m/s
2
)
HDD .................................................................................................................. head-down display
HHDD ........................................................................................................ high head-down display
HMI ........................................................................................................ human-machine interface
HUD ....................................................................................................................... head-up display
HVAC ...................................................................................... heating, ventilating, air conditioning
Hz ........................................................................................................................................... Hertz
98
ICW ....................................................................................................... imminent collision warning
IP .......................................................................................................................... instrument panel
ISO .......................................................................... International Organization for Standardization
ITS ............................................................................... Intelligent Transportation Systems/Society
IVW .................................................................................................................... in-vehicle warning
L0 ..................................................................................................................... Level 0 Automation
L1 ..................................................................................................................... Level 1 Automation
L2 ..................................................................................................................... Level 2 Automation
L3 ..................................................................................................................... Level 3 Automation
L4 ..................................................................................................................... Level 4 Automation
L5 ..................................................................................................................... Level 5 Automation
LCDAS ................................................................................ Lane Change Decision Assist System
LCS ........................................................................................................... Lane Centering System
LCW ............................................................................................................... lane change warning
LDW ........................................................................................................... lane departure warning
LED ................................................................................................................... light-emitting diode
LHDD .......................................................................................................... low head-down display
ms ................................................................................................................................. millisecond
MT ....................................................................................................................... masked threshold
nm .................................................................................................................................. nanometer
NHTSA .................................................................. National Highway Traffic Safety Administration
OEM ............................................................................................ original equipment manufacturer
OOTL ....................................................................................................................... out-of-the-loop
PTT .............................................................................................................................. push-to-talk
RITA ............................................................. Research and Innovative Technology Administration
s .......................................................................................................................................... second
SAE ............................................................................................. Society of Automotive Engineers
SPL ................................................................................................................ sound pressure level
TICS ........................................................................... Transport Information and Control Systems
TTC ........................................................................................................................ time-to-collision
V2V ..................................................................................................................... vehicle-to-vehicle
VPT ............................................................................................................ variable priority training

99
Chapter 12. Equations
Glare Angle and Display Luminance
=
10
+
5
1 +
62.5
Where:
L
veil
= Veiling luminance
I
glare
= Luminous intensity of glare source
θ = Glare angle
A = Driver age
5-4
Viewing Distance and Symbol Height
= 60 Arctan
1000
Viewing Distance and Visual Angle
= 1000 Tan
60
Visual Angle and Symbol Height
=
60
Where:
H = Symbol height in millimeters
D = Viewing distance in meters (0.5-1.1m)
V = Visual angle subtended in arcminutes
5-10

100
Minimum Density of Vibrating Motors
A
w
2 x T
A
h
2 x T
Where:
A
w
= Area width
A
h
= Area height
T = Two-point threshold
7-6

101
Chapter 13. Relevant Documents from the United States Department of
Transportation, SAE International, and International Organization
for Standardization
The table below provides an alphanumeric list of standards, best practices, and general resource
documents which may or may not be directly cited in chapter topics but, if not, present additional
information relevant to the design issues discussed in this document.
Document Description
ANSI/HFES 100-2007
Human factors engineering of computer
workstations
Year: 2007
Document Type: U.S. National Standard
Specifications for acceptable applications of human factors
engineering principles and practices related to computer workstation
design and configuration, defined as an operator-machine system
comprised of associated user-interface components (input devices,
output devices, and furniture).
ANSI Z535.3
American national standard. Criteria for
safety symbols
Year: 2011
Document Type: U.S. National Standard
General criteria for the design, evaluation, and use of safety symbols
for identifying and warning against specific hazards.
CIE 146
CIE equations for disability glare
Year: 2002
Document Type: International Standard
Definitions for disability glare equations for veiling luminance.
DOT 37-13
Visual-manual NHTSA driver distraction
guidelines for in-vehicle electronic devices
Year: 2013
Document Type: Federal Guidelines
Provides nonbinding, voluntary guidelines to discourage excessively
distracting devices in vehicles. Applicable to original equipment in-
vehicle electronic devices used for secondary tasks such as
communications, entertainment, information gathering, or navigation
through visual-manual means.
ISO 2575
Road vehicles--Symbols for controls,
indicators and tell-tales
Year: 2010
Document Type: International Standard
Specifications for symbols for use on controls, indicators and tell-
tales. Applicable to passenger cars, light and heavy commercial
vehicles, and buses. Also included are colors of possible optical tell-
tales for informing drivers of either correct operation or
malfunctioning of related devices.
ISO 3864-3
Graphical symbols--Safety colours and
safety signs--Part 3: Design principles for
graphical symbols for use in safety signs
Year: 2012
Document Type: International Standard
Principles, criteria and guidance for designing graphical symbols for
use in safety signs (described in ISO 3864‑1), and for the safety sign
element of product safety labels (described in ISO 3864‑2).

102
Document Description
ISO 4040
Road vehicles--Location of hand controls,
indicators and tell-tales in motor vehicles
Year: 2009
Document Type: International Standard
Specifications for the location of controls in motor vehicles, and for
certain combinations of functions for multifunction controls.
Applicable to hand-operated controls, indicators and tell-tales in all
motor vehicles, excluding motorcycles and mopeds, as defined in ISO
3833.
ISO 7731
Ergonomics--Danger signals for public and
work areas--Auditory danger signals
Year: 2003
Document Type: International Standard
Specification of criteria for the recognition of auditory danger signals,
especially in situations of high ambient noise.
ISO 9921
Ergonomics--Assessment of speech
communication
Year: 2003
Document Type: International Standard
Specification of requirements for the performance of speech
communication for verbal alert and danger signals, information
messages, and speech communication. Methods for
predicting/assessing subjective and objective performance in practical
applications are described. Examples are provided.
ISO 11429
Ergonomics--System of auditory and
visual danger and information signals
Year: 1996
Document Type: International Standard
Specification of warning and information signals which differentiate
between degrees of urgency, from extreme urgency to All Clear
situations.
ISO 15005
Road vehicles--Ergonomic aspects of
transport information and control systems--
Dialogue management principles and
compliance procedures
Year 2002
Document Type: International Standard
Description of ergonomic principles for designing dialogues between
drivers and the vehicle's transport information and control systems
(TICS) while the vehicle is in motion, including specification of
compliance verification conditions related to the principles.
ISO 15006
Road vehicles--Ergonomic aspects of
transport information and control systems--
Specifications for in-vehicle auditory
presentation
Year: 2011
Document Type: International Standard
Ergonomic specifications for auditory information displays related to
transport information and control systems (TICS), primarily when the
vehicle is in motion although it may also be applied when the vehicle
is stationary. Requirements and recommendations for in-vehicle
auditory signals from TICS, as well as characteristics and functional
factors for maximizing auditory signal intelligibility and utility while
helping prevent auditory or mental overload are provided.
ISO 15007-1
Road vehicles--Measurement of driver
visual behaviour with respect to transport
information and control systems--Part 1:
Definitions and parameters
Year: 2014
Document Type: International Standard
Definitions of key terms and parameters used in the analysis of driver
visual behavior for both real-world trials and laboratory-based driving
simulator studies.

103
Document Description
ISO 15008
Road vehicles--Ergonomic aspects of
transport information and control systems--
Specifications and test procedures for in-
vehicle visual presentation
Year: 2009
Document Type: International Standard
Specification of minimum requirements for image quality and
legibility of visual displays containing changeable information
presented while the vehicle is in motion, including test methods and
measurements for assessing compliance where necessary. Applicable
to mainly perceptual components of the visual information such as
character legibility and colour recognition; not applicable to factors
affecting performance and comfort such as coding, format and
dialogue characteristics, pictorial information or images, maps and
topographic representations.
ISO 15623
Transport information and control systems--
Forward vehicle collision warning systems--
Performance requirements and test
procedures
Year: 2002
Document Type: International Standard
Specification of performance requirements and test procedures for
systems which warn the driver of short inter-vehicle distance and
closing speed which could cause a rear-end collision with other
vehicles. Applicable to operations on roads with curve radii over
125m or higher radius curves.
ISO 16673
Road vehicles--Ergonomic aspects of
transport information and control systems--
Occlusion method to assess visual demand
due to the use of in-vehicle systems
Year: 2007
Document Type: International Standard
Procedure for measuring visual demand during the use of visual or
visual-manual interfaces while the vehicle is in motion. Applicable to
both original equipment and aftermarket in-vehicle systems.
ISO 17287
Road vehicles--Ergonomic aspects of
transport information and control systems--
Procedure for assessing suitability for use
while driving
Year: 2003
Document Type: International Standard
Procedure for assessing whether transport information and control
systems (TICS), or a combination of TICS with other in-vehicle
systems, are suitable for drivers while the vehicle is in motion. Topics
include user-oriented TICS description and context of use, TICS task
description and analysis, the assessment process, and documentation.
(Does not recommend specific variables for assessing suitability nor
defines criteria for establishing the suitability of use of a TICS table
while driving.)
ISO 17361
Intelligent transport systems--Lane
departure warning systems--Performance
requirements and test procedures
Year: 2007
Document Type: International Standard
Specifications for the definition of the system, classification,
functions, human-machine interface (HMI) and test methods for in-
vehicle lane departure warning systems which are appropriate for
highways and highway-like roads; warnings at roadway sections
having temporary or irregular lane markings (such as roadwork zones)
is not within the scope. Applicable for systems which provide
warnings only (no automatic mitigation action) for passenger cars,
commercial vehicles and buses.

104
Document Description
ISO 17386
Transport information and control systems-
Maneuvering aids for low speed operation
(MALSO) Performance requirements and
test procedures
Year: 2010
Document Type: International Standard
Specification of minimum functionality requirements for light-duty
vehicles, e.g., passenger cars, pickup trucks, light vans and sport
utility vehicles (motorcycles excluded) equipped with MALSO
systems such as detection of and information on the presence of
relevant obstacles within a defined (short) detection range. It defines
minimum requirements for failure indication as well as performance
test procedures; it includes rules for the general information strategy
but does not restrict the kind of information or display system.
(Sensing technology is not addressed; visibility-enhancement systems
without distance ranging and warning are not addressed. For reversing
aids and obstacle-detection devices on heavy commercial vehicles,
see ISO/TR 12155.)
ISO 17387
Intelligent transport systems--Lane change
decision aid systems (LCDAS)--
Performance requirements and test
procedures
Year: 2008
Document Type: International Standard
Specification of system requirements and test methods for Lane
Change Decision Aid Systems (LCDAS) and their use on forward
moving cars, vans and straight trucks in highway situations (does not
address LCDAS for use on motorcycles or articulated vehicles).
ISO 26022
Road vehicles--Ergonomic aspects of
transport information and control systems--
Simulated lane change test to assess in-
vehicle secondary task demand
Year: 2010
Document Type: International Standard
An estimate of secondary task demand derived through a laboratory
base-method, which quantitatively measures human performance
degradation on a primary driving-like task while a secondary task is
being performed. The method, for both original equipment and
aftermarket in-vehicle systems, applies to in-vehicle information,
communication, entertainment, control, manual, visual, haptic and
auditory single and combination systems for passenger cars, but
cannot be used to test secondary tasks requiring that speed variations
be performed.
ISO 26262
Road vehicles--Functional safety
Year: 2011
Document Type: International Standard
Intended to be applied to electrical and/or electronic systems in
production passenger vehicles (excludes heavy vehicles). The
standard covers functional safety across the product lifecycle,
provides an automotive-specific risk-based approach for determining
risk arising from malfunctioning electrical/electronic systems, and
provides requirements for validating and confirming measures to
ensure sufficient and acceptable level of safety.
ISO/TR 12204
Road vehicles--Ergonomic aspects of
transport information and control systems--
Introduction to integrating safety critical
and time critical warning signals
Year: 2012
Document Type: Technical Report
General, informational guidance for integration of safety critical and
time critical warning signals into existing in-vehicle messages
presented to a driver; does not provide guidance in integration of non-
critical signals, nor how to design an integrated warning HMI.
ISO/TR 16352
Road vehicles--Ergonomic aspects of in-
vehicle presentation for transport
information and control systems--Warning
systems
Year: 2005
Document Type: Technical Report
Literature survey of human-machine interface of warning systems in
vehicles which discusses efficiency, acceptance of different
modalities and combinations of warnings, and design parameters of
visual, auditory and tactile warnings.

105
Document Description
ISO/TS 14198
Road vehicles--Ergonomic aspects of
transport information and control systems--
Calibration tasks for methods which assess
driver demand due to the use of in-vehicle
systems
Year: 2012
Document Type: Technical Specification
Procedures for developing secondary, calibration tasks used in a dual-
task setting for assessing drivers’ attentional demand when using in-
vehicle systems. Advice provided for selecting an appropriate
candidate calibration task and includes its application, experimental
design, data collection, and procedures for analysis.
ISO/TS 15007-2
Road vehicles--Measurement of driver
visual behaviour with respect to transport
information and control systems--Part 2:
Equipment and procedures
Year: 2001
Document Type: Technical Specification
Guidelines for analyzing driver visual behaviour to assist in planning
evaluation trials, specifying/installing data capture equipment, as well
as analyzing, interpreting and reporting visual-behaviour
measurement. Applicable to road trials and simulated driving
environments, but is not applicable to the assessment of head-up
displays.
ISO/TS 16951
Road vehicles--Ergonomic aspects of
transport information and control systems
(TICS)--Procedures for determining
priority of on-board messages presented to
drivers
Year: 2004
Document Type: Technical Specification
Provides formal procedures and two alternate methods for
determining the priority of in-vehicle messages, including traveler,
navigation, traffic advisories, warnings, system status and other
information, as well as messages from other sources such as
telephones, warnings, and tell-tales.
MIL-STD-1472G
Department of defense design criteria
standard - Human engineering
Year: 2012
Document Type: Military Standard
General human engineering design criteria for military systems,
subsystems, equipment, and facilities with the intent of optimal
system performance given inherent human capabilities and
limitations.
SAE J287
Driver hand control reach
Year: 2007
Document Type: Recommended Practice
Description of the boundaries of hand control locations that can be
reached by a percentage of different driver populations in passenger
cars, multi-purpose passenger vehicles, and light trucks (Class A
vehicles); not applicable to heavy trucks (Class B vehicles).
SAE J941
Motor vehicles drivers’ eye locations
Year: 2010
Document Type: Recommended Practice
Establishment of the location of drivers’ eyes inside a vehicle for
passenger cars, multi-purpose passenger vehicles, and light trucks
(Class A vehicles) and heavy trucks (Class B vehicles) (eyellipses
have not been updated from previous versions of SAE J941).
SAE J1138
Design criteria--Driver hand controls
location for passenger cars, multipurpose
passenger vehicles, and trucks (10,000
GVW and under)
Year: 2009
Document Type: Recommended Practice
Description of design criteria related to the location and labeling of
hand controls (does not include hand-held devices such as remote
controls or cellular phones).

106
Document Description
SAE J1757-1
Standard metrology for vehicular displays
Year: 2007
Document Type: Standard
Methods to determine optical performance for Flat Panel Displays in
all typical automotive ambient light illumination, focusing on High
Ambient Contrast Ratio, a critical element for display legibility in a
sunshine environment.
SAE J2364
Navigation and route guidance function
accessibility while driving
Year: 2004
Document Type: Recommended Practice
Establishment of both a static method and an interrupted vision
method for determining which navigation and route guidance
functions should be accessible to the driver while the vehicle is in
motion; applicable to original equipment and aftermarket route-
guidance system functions for passenger vehicles. Does not apply to
visual monitoring tasks which do not require a manual control input,
such as route following, nor to voice-activated controls or passenger
operation of controls.
SAE J2365
Calculation of the time to complete in-
vehicle navigation and route guidance
tasks
Year: 2002
Document Type: Recommended Practice
A method for calculating the time needed to complete navigation
system-related tasks which may be used as an assessment tool for
safety and usability of alternative navigation and route guidance
system interfaces. Does not consider voice-activated controls, voice
output from the navigation system, communication between the driver
and others, or passenger operation. Applicable to both original
equipment and aftermarket route-guidance and navigation system
functions for passenger vehicles.
SAE J2395
ITS in-vehicle message priority
Year: 2002
Document Type: Recommended Practice
Description of a method for prioritizing ITS in-vehicle messages
and/or displayed information which is applicable to original
equipment and aftermarket ITS message-generating systems for
passenger vehicles and heavy trucks. A prioritization value is assigned
to specific messages or units of information which is then used to
determine the order that simultaneous, or overlapping, in-vehicle
messages are presented to the driver.
SAE J2396
Definitions and experimental measures
related to the specification of driver visual
behavior using video based techniques
Year: 2000
Document Type: Recommended Practice
Description of key terms and metrics applied in the analysis of video-
based driver eye glance behavior, intended to assist development of a
common source of reference for driver visual behavior data. Data
collated and analyzed from this document allow comparisons to be
performed across different device evaluations and experimental
scenarios.
SAE J2399
Adaptive cruise control (ACC) operating
characteristics and user interface
Year: 2003
Document Type: Standard
Specifications for the minimum requirements for Adaptive Cruise
Control system operating characteristics and elements of the user
interface; applicable to original equipment and aftermarket ACC
systems for passenger vehicles (including motorcycles). Not
applicable to commercial vehicles nor variations on ACC, such as
“stop-and-go” ACC.
SAE J2400
Human factors in forward collision
warning systems: Operating characteristics
and user interface requirements
Year: 2003
Document Type: Information Report
Description of the elements for a Forward Collision Warning user
interface, and requirements and test methods for these systems.
Applicable to original equipment and aftermarket FCW systems for
passenger vehicles including cars, light trucks, and vans, but does not
apply to heavy trucks, nor does it address integration issues associated
with adaptive cruise control (ACC).

107
Document Description
SAE J2402
Road vehicles—Symbols for controls,
indicators, and tell-tales
Year: 2010
Document Type: Standard
Specification of symbols for use on controls, indicators, and tell-tales
which is applicable to passenger cars, light and heavy commercial
vehicles, and buses.
SAE J2678
Navigation and route guidance function
accessibility while driving rationale
Year: 2004
Document Type: Recommended Practice
Description of the rationale used by the Navigation Function
Accessibility Subcommittee for the development and content of the
SAE J2364 Recommended Practice: Navigation and Route Guidance
Function Accessibility While Driving.
SAE J2802
Blind spot monitoring system (BSMS):
Operating characteristics and user interface
Year: 2010
Document Type: Recommended Practice
Specification of the minimum recommendations for Blind Spot
Monitoring System (BSMS) operational characteristics and elements
of the user interface. Applicable to original equipment and
aftermarket BSMS systems for passenger vehicles, but not
motorcycles or heavy trucks, nor does it address Lane Change
Systems (which monitor a larger area behind the vehicle). A visual
BSMS indicator is recommended.
SAE J2808
Road/lane departure warning systems:
Information for the human interface
Year: 2007
Document Type: Information Report
Recommendations for Road Departure Warning Systems (RDWS)
operational characteristics and elements of the user interface.
Applicable to original equipment and aftermarket systems for light-
duty vehicles on relatively straight roads with a radius of curvature of
500m or more, and under good weather conditions.
SAE J2830
Process for comprehension testing of in-
vehicle icons
Year: 2008
Document Type: Information Report
A process for testing driver comprehension of safety, navigation,
infotainment or other ITS message symbols or icons.
SAE J2831
Development of design and engineering
recommendations for in-vehicle
alphanumeric messages
Year: 2012
Document Type: Information Report
Recommendations for alphanumeric messages communicated to the
vehicle by external (e.g., RDS, satellite radio) or internal
(e.g., infotainment system) sources while the vehicle is in-motion.
Applicable to OEM (embedded) and aftermarket systems. Does not
cover ergonomic issues regarding display characteristics such as
viewing angle, brightness, contrast, font design, etc.
SAE J3016
Taxonomy and definitions for terms related
to on-road motor vehicle automated
driving systems
Year: 2014
Document Type: Information Report
Taxonomy and operational definitions for the full range of levels of
automation in on-road motor vehicles as a foundation for discussion
and further standards development within the
“Automated/Autonomous Vehicle” community.
108
Chapter 14. References
49 C.F.R. pt. 571.208. Federal Motor Vehicle Safety Standard (FMVSS) No. 208, Occupant
crash protection [Docket No. 74-14; Notice 103], RIN 2127-AG14, Retrieved from
www.nhtsa.dot.gov/cars/rules/rulings/Labels5.mlv.html
Abe, G., & Richardson, J. (2004). The effect of alarm timing on driver behaviour: an
investigation of differences in driver trust and response to alarms according to alarm
timing. Transportation Research Part F: Traffic Psychology and Behaviour, 7(4-5), 307-
22.
Abe, G., & Richardson, J. (2006). The influence of alarm timing on driver response to collision
warning systems following system failure. Behaviour & Information Technology, 25(5),
443-452.
Adrian, W., & Bhanji, A. (1991). Fundamentals of disability glare: A formula to describe stray
light in the eye as a function of glare angle and age. Proceedings of the First International
Symposium on Glare (pp. 185-193). New York: Lighting Research Institute.
Aldridge, L. C., & Lansdown, T. C. (1999). Driver preferences for speech based interaction with
in-vehicle systems. Proceedings of the Human Factors and Ergonomics Society Annual
Meeting, 977-981.
Alliance of Automobile Manufacturers (AAM). (2006). Statement of principles, criteria and
verification procedures on driver interactions with advanced in-vehicle information and
communication systems, including 2006 updated sections [Report of the Driver Focus-
Telematics Working Group]. Retrieved from
www.autoalliance.org/index.cfm?objectid=D6819130-B985-11E1-9E4C000C296BA163.
Arroyo, E., Sullivan, S., & Selker, T. (2006). CarCoach: A polite and effective driving coach.
Proceedings of CHI ’06 Extended Abstracts on Human Factors in Computing Systems,
357-362.
Baldwin, C. L., & May, J. F. (2011). Loudness interacts with semantics in auditory warnings to
impact rear-end collisions. Transportation Research Part F: Traffic Psychology and
Behaviour, 14(1), 36-42.
Bhise, V. D. (2011). Ergonomics in the automotive design process. Boca Raton, FL: CRC Press.
Blanco, M., Atwood, J., Vasquez, H. M., Trimble, T. E., Fitchett, V. L., Radlbeck, J., ... Morgan,
J. F. (2015, August). Human factors evaluation of level 2 and level 3 automated driving
concepts (Report No. DOT HS 812 182). Washington, DC: National Highway Traffic Safety
Administration. Available at
www.nhtsa.gov/sites/nhtsa.dot.gov/files/812182_humanfactorseval-l2l3-
automdrivingconcepts.pdf
Boot, W. R., Basak, C., Erickson, K. I., Neider, M., Simons, D. J., Fabiani, M., . . . Kramer, A. F.
(2010). Transfer of skill engendered by complex task training under conditions of variable
priority. Acta Psychologia, 135, 349-357.
Brock, J. F., McFann, J., Inderbitzen, R. E., & Bergoffen, G. (2007). Effectiveness of commercial
motor vehicle driver training curricula and delivery methods (CTBSSP Synthesis MC-13).
Washington, DC: National Academy Press.
109
Brookhuis, K. A., van Driel, C.J.G., Hof, T., van Arem, B., & Hoedemaeker, M. (2008). Driving
with a congestion assistant; mental workload and acceptance. Applied Ergonomics, 40,
1019-1025. doi: 10.1016/j.apergo.2008.06.010
Brown, S. B., Lee, S. E., Perez, M. A., Doerzaph, Z. R., Neale, V. L., & Dingus, T. A. (2005).
Effects of haptic brake pulse warnings on driver behavior during an intersection approach.
Proceedings of the Human Factors and Ergonomics Society 49th Annual Meeting, 1892-
1896.
Campbell, J. L., Bittner, A. C., Jr., Lloyd, M., Mitchell, E., & Everson, J. H. (1997). Driver-
vehicle interface (DVI) design guidelines for the intersection collision avoidance (ICA)
system. Seattle, WA: Battelle Human Factors Transportation Center.
Campbell, J. L., Carney, C., & Kantowitz, B. H. (1998). Human factors design guidelines for
advanced traveler information systems (ATIS) and commercial vehicle operations (CVO)
(Report No. FHWA-RD-98-057). Washington, DC: Federal Highway Administration.
Campbell, J. L., Richard, C.M., Brown, J. L., & McCallum, M. (2007). Crash warning system
interfaces: Human factors insights and lessons learned, final report (Report No. DOT HS
810 697). Washington, DC: National Highway Traffic Safety Administration. Retrieved
from
www.nhtsa.gov/DOT/NHTSA/NRD/Multimedia/PDFs/Crash%20Avoidance/2007/CWS_
HF_Insights_Task_5_Final_Rpt.pdf
Campbell, J. L., Richman, J. B., Carney, C., & Lee, J. D. (2004). In-vehicle display icons and
other information elements, Volume I: Guidelines (Report No. FHWA-RD-03-065).
McLean, VA: Federal Highway Administration. Retrieved from
www.fhwa.dot.gov/publications/research/safety/03065/index.cfm
Carney, C., Campbell, J. L., & Mitchell, E. A. (1998). In-vehicle display icons and other
information elements: Literature review (Report No. FHWA-RD-98-164). Washington,
DC: Federal Highway Administration.
Carsten, O., Lai, F. C. H., Barnard, Y., Jamson, A. H., & Merat, N. (2012). Control task
substitution in semiautomated driving: Does it matter what aspects are automated? Human
Factors: The Journal of the Human Factors and Ergonomics Society, 54(5), 747-761. doi:
10.1177/0018720812460246.
Cassidy, A. M. (2009). Mental models, trust, and reliance: Exploring the effect of human
perceptions on automation use (Master’s thesis). Naval Postgraduate School, Monterey,
CA.
Catchpole, K. R., McKeown, J. D., & Withington, D. J. (2004). Localizable auditory warning
pulses. Ergonomics, 47(7), 748-771.
Chan, A. H. S., & Ng, A. W. Y. (2009). Perceptions of implied hazard for visual and auditory
alerting signals. Safety Science. 47, 346-352.
Charissis, V., & Papanastasiou, S. (2010). Human-machine collaboration through vehicle head
up display interface. Cognition, Technology and Work, 12(1), 41-50.
Cholewiak, R. W., & Craig, J. C. (1984). Vibrotactile pattern recognition and discrimination at
several body sites. Perception and Psychophysics, 35(6), 503-514.
CIE . (2002). CIE 146:2002:CIE equations for disability glare. Vienna, Austria: International
Commission on Illumination.
110
Cullinane, B., & Kirn, C. (2012). Timely comprehension: A methodology for evaluating
integration of in-vehicle warning systems. Presented at SAE 2012 World Congress &
Exhibition. doi:10.4271/2012-01-0100.
Cummings, M. L., Mastracchio, C., Thornburg, K. M., & Mkrtchyan, A. (2013). Boredom and
distraction in multiple unmanned vehicle supervisory control. Interacting with Computers,
25(1), 34-47.
De Groot, S., de Winter, J. C. F., Garcia, J. M., Mulder, M., & Wieringa, P. A. (2011). The effect
of concurrent bandwidth feedback on learning the lane-keeping task in a driving simulator.
Human Factors, 53(1), 50-62.
Deatherage, B. H. (1972). Auditory and other sensory forms of information presentation. In H. P.
Van Cott & R. G. Kinkade (Eds.), Human engineering guide to equipment design (rev. ed.)
(pp. 123-160). Washington, DC: U.S. Government Printing Office.
Dobbins, T., & McKinley, A. (2008). Integration issues of tactile displays in military
environments. In J. B. F. van Erp & B. P. Self (Eds.), Tactile displays for orientation,
navigation and communication in air, sea and land environments (Chapter 5) (Report No.
RTO-TR-HFM-122). NATO Science and Technology Organization. Retrieved from
www.cso.nato.int/pubs/rdp.asp?RDP=RTO-TR-HFM-122.
Dorneich, M. C., Ververs, P. M., Mathan, S., Whitlow, S., & Hayes, C. C. Considering etiquette
in the design of an adaptive system. Journal of Cognitive Engineering and Decision
Making, 6 (2), 243-265.
Doshi, A., Cheng, S. U., & Trivedi, M. M. (2009). A novel active heads-up display for driver
assistance. IEEE Transactions on Systems, Man, and Cybernetics—Part B: Cybernetics,
39(1), 85-93.
Easterby, R. S. (1970). The perception of symbols for machine displays. Ergonomics, 13(1), 149-
158.
Edworthy, J., & Hellier, E. (2000). Auditory warnings in noisy environments. Noise Health, 2(6),
27-40.
Edworthy, J., Loxley, S., & Dennis, I. (1991). Improving auditory warning design: Relationship
between warning sound parameters and perceived urgency. Human Factors, 33(2), 205-
231.
Endsley, M. R. (1995). Towards a theory of situation awareness in dynamic systems. Human
Factors, 37, 32-64.
Endsley, M. R. (2012). Situation awareness. In Salvendy, G. (Ed.), Handbook of Human Factors
and Ergonomics, Fourth Edition (Chapter 19). Hoboken, NJ: John Wiley & Sons.
Endsley, M. R., & Kaber, D. B. (1999). Level of automation effects on performance, situation
awareness and workload in a dynamic control task. Ergonomics, 42(3), 462-492.
Endsley, M. R., & Kiris, E. O. (1995). The out-of-the-loop performance problem and level of
control in automation. Human Factors, 37(2), 381-394.
Farber, E., & Matle, C. (1989). PCDETECT: A revised version of the DETECT seeing distance
model. Transportation Research Record: Journal of the Transportation Research Board,
1213, 11-20.
111
Federal Aviation Administration. (2013). Manual flight operations (Safety Alert for Operators
[SAFO] 13002). Retrieved from the FAA website at
www.faa.gov/other_visit/aviation_industry/airline_operators/airline_safety/safo/all_safos/
media/2013/SAFO13002.pdf
Federal Highway Administration. (2012). Manual on uniform traffic control devices, 2009
edition with revisions 1 and 2. Washington, DC: Author.
Fitch, G. M., Hankey, J. M., Kleiner, B. M., & Dingus, T. A. (2011). Driver comprehension of
haptic seat alerts intended for use in an integrated collision avoidance system.
Transportation Research Part F: Traffic Psychology and Behaviour, 14, 278-290.
Fitch, G. M., Kiefer, R. J., Hankey, J. M., & Kleiner, B. M. (2007). Toward developing an
approach for alerting drivers to the direction of a crash threat. Human Factors, 49(4), 710-
720.
Fitts, P. M., (Ed.). (1951). Human engineering for an effective air navigation and traffic control
system. Washington, DC: National Research Council.
Flemisch, F., & Schieben, A. (Eds.) (2009). Validation of preliminary design by simulation.
Retrieved from the Highly Automated Vehicles for Intelligent Transport (HAVEit) website
at http://haveit-
eu.org/LH2Uploads/ItemsContent/24/HAVEit_212154_D33.3_Superfinal.pdf
Forkenbrock, G., Snyder, A., Heitz, M., Hoover, R. L., O'Harra, B., Vasko, S., & Smith, L.
(2011). A test track protocol for assessing forward collision warning driver-vehicle
interface effectiveness (Report No. DOT HS 811 501). Washington, DC: National Highway
Traffic Safety Administration.
Fricke, N. (2007). Effects of adaptive information presentation. Proceedings of the 4th
International Driving Symposium on Human Factors in Driver Assessment, Training and
Vehicle Design, 292-298.
Gallace, A., Ho, T.Z., & Spence, C. (2007). Multisensory numerosity judgments for visual and
tactile stimuli. Perception & Psychophysics, 69, 487-501.
Gallace, A., Tan, H. Z., & Spence, C. (2007). The body surface as a communication system: The
state of the art after 50 years. Presence, 16 (6), 655-676.
Gellatly, A. W., & Dingus, T. A. (1998). Speech recognition and automotive applications: Using
speech to perform in-vehicle tasks. Proceedings of the Human Factors and Ergonomics
Society Annual Meeting, 1247-1251.
General Motors Corporation & Delphi-Delco Electronic Systems. (2002). Automotive collision
avoidance system field operation test, warning cue implementation summary report (Report
No. DOT HS 809 462). Washington, DC: National Highway Traffic Safety Administration.
General Motors Corporation. (2005). Automotive collision avoidance system field operational
test (ACAS FOT) final program report (Report No. DOT HS 809 886). Washington, DC:
National Highway Traffic Safety Administration.
Giddings, B.J. (1972). Alpha-numerics for raster displays. Ergonomics, 15(1), 65-72.
Gold, C., Damböck, D., Lorenz, L., & Bengler, K. (2013). “Take over!” How long does it take to
get the driver back into the loop? Proceedings of the Human Factors and Ergonomics
Society 57th Annual Meeting, 1938-1942.
112
Gold, C., Lorenz, L., Damböck, D., Bengler, K. (2013, November). Partially automated driving
as a fallback level of high automation. Paper presented at Tagung Fahrerassistenzsysteme:
Der weg zum automatischen fahren. Retrieved from
http://mediatum.ub.tum.de/doc/1187198/1187198.pdf
Gonzalez, C., Lewis, B. A., Roberts, D. M., Pratt, S. M., & Baldwin, C. L. (2012). Perceived
urgency and annoyance of auditory alerts in a driving context. Proceedings of the Human
Factors and Ergonomics Society Annual Meeting, 56(1), 1684-1687.
Goodrich, M. A.., & Boer, E. R. (1999). Multiple mental models, automation strategies, and
intelligent vehicle systems. Proceedings of the IEEE/IEEJ/JSAI Conference on Intelligent
Transportation Systems. Tokyo, Japan.
Goodrich, M. A., & Boer, E. R. (2003). Model-based human-centered task automation: A case
study in ACC system design. IEEE Transactions on Systems, Man, and Cybernetics, Part
A, Systems and Humans, 33(3), 325-336.
Goodrich, M. A., Boer, E. R., & Inoue, H. (1999). A model of human brake initiation behavior
with implications for ACC design. Proceedings of IEE/IEEJ/JASI International Conference
on Intelligent Transportation Systems, 86-91.
Graving, J. S., Easterlund, P. A., & Manser, M. M. (2011). Developing a bus driver training
program for a driver assistive system. Proceedings of the Human Factors and Ergonomics
Society 55
th
Annual Meeting, 1543-1547.
Grote, G., Weik, S., Wäfler, T., & Zölch, M. (1995). Complementary allocation of functions in
automated work systems. In Y. Anzai, K. Ogawa, & H. Mori (Eds.), Symbiosis of Human
and Artifact. Amsterdam: Elsevier.
Guilluame, A., Drake, C., Rivenez, M., Pellieux, L., & Chastres, V. (2002). Perception of
urgency and alarm design. Proceedings of the 8th International Conference on Auditory
Display.
Hancock, P. A. (2007). On the process of automation transition in multitask human-machine
systems. IEEE Transactions on Systems, Man, and Cybernetics, Part A: Systems and
Humans, 37(4), 586-598.
Hecht, D., & Reiner, M. (2009). Sensory dominance in combinations of audio, visual and haptic
stimuli. Experimental Brain Research, 193, 307-314.
Hellier, E., & Edworthy, J. (1989). Quantifying the perceived urgency of auditory warnings.
Canadian Acoustics, 17(4), 3-11.
Higuchi, M., & Raksincharoensak, P. (2010). Seat vibrotactile warning interface for forward
vehicle collision avoidance. Proceedings of the SICE Annual Conference 2010, 1370-1373.
Hilburn, B., Molloy, R., Wong, D., & Parasuraman, R. (1993). Operator versus computer control
of adaptive automation. Proceedings of the 7th International Symposium on Aviation
Psychology (pp. 161-166). Columbus, OH: The Ohio State University.
Ho, C., Tan, H. Z., & Spence, C. (2005). Using spatial vibrotactile cues to direct visual attention
in driving scenes. Transportation Research Part F: Traffic Psychology and Behaviour,
8(6), 397-412.
Hoc, J.-M., Young, M. S., & Blosseville, J.-M. (2009). Cooperation between drivers and
automation: Implications for safety. Theoretical Issues in Ergonomics Science, 10(2), 135-
160.
113
Hoeger, R., Zeng, H., Hoess, F., Kranz, T., Boverie, S., Straus, M., Jakobsson, E., . . . Nilsson,
A. (2011). The future of driving. Deliverable D61.1. Final report. Version 1.0 (Report for
the Highly Automated Vehicles for Intelligent Transport [HAVEit] 7th Framework
Programme). Retrieved from www.haveit-
eu.org/displayITM1.asp?ITMID=24&LANG=EN.
Hoffman, J. D., Lee, J. D., McGehee, D. V., Macias, M., & Gellatly, A. W. (2005). Visual
sampling of in-vehicle text messages: Effects of number of lines, page presentation, and
message control. Transportation Research Record: Journal of the Transportation Research
Board, 1937, 22-30.
Hogema, J. H., Sjoerd, C.D.V., Van Erp, J., & Kiefer, R. J. (2009). A tactile seat for direction
coding in car driving: Field evaluation. IEEE Transaction on Haptics, 2(4), 181-188.
Hollnagel, E. (2004). Automation and human work. In C. Sandom & R. S. Harvey, (Eds.),
Human Factors for Engineers. London: Institute of Engineering and Technology.
Hollnagel, E., & Bye, A. (2000). Principles for modeling function allocation. International
Journal of Human-Computer Studies, 52, 253-265.
Horrey, W. J., Wickens, D. D., & Alexander, A. L. (2003). The effects of head-up display clutter
and in-vehicle display separation on concurrent driving performance. Proceedings of the
Human Factors and Ergonomics Society 47th Annual Meeting. 1880-1884.
Horvitz, E. (1999). Principles of mixed-initiative user interfaces. Proceedings of CHI ’99, ACM
SIG-CHI Conference on Human Factors in Computing Systems, Pittsburgh, PA.
Howell, W. C., & Kraft, C. L. (1959). Size, blur, and contrast as variables affecting the legibility
of alphanumeric symbols on radar-type displays (WADC Technical Report 59-536).
Wright-Patterson Air Force Base, OH: Wright Air Development Center (DTIC No. AD-
232 889).
Human Factors and Ergonomics Society. (2007). ANSI/HFES 100-2007: Human factors
engineering of computer workstations. Santa Monica, CA: Author.
Inagaki, T. (2003). Adaptive automation: Sharing and trading of control. In E. Hollnagel (Ed.),
Handbook of Cognitive Task Design. Mahwah, NJ: Erlbaum.
International Organization for Standardization. (1984). Development and principles for
application of public information symbols. (ISO/TR 7239). Geneva: Author.
International Organization for Standardization. (2005). Road vehicles—Ergonomic aspects of in-
vehicle presentation for transport information and control systems—Warning systems
(ISO/TR 16352). Geneva: Author.
ISO. (2002). ISO 15005: Road vehicles—Ergonomic aspects of transport information and
control systems—Dialogue management principles and compliance procedures. Geneva:
International Organization for Standards.
ISO. (2009). ISO 15008: Road vehicles—Ergonomic aspects of transport information and
control systems—Specifications and test procedures for in-vehicle visual presentation.
Geneva: International Organization for Standardization.
ISO. (2008). ISO 17387: Intelligent transport systems—Lane change decision aid systems
(LCDAS)—Performance requirements and test procedures. Geneva: International
Organization for Standardization.
114
ISO. (1988). ISO 3461-1: General principles for the creation of graphical symbols, Part I:
Graphical symbols for use on equipment. Geneva: International Organization for
Standardization.
ISO. (2003). ISO 7731: Danger signals for public and work areas—auditory danger signals.
Geneva: International Organization for Standardization.
Ivancic, K., & Hesketh, B. (2000). Learning from errors in a driving simulation: Effects on
driving skill and self-confidence. Ergonomics, 43(12), 1966-1984.
Jamson, A.H., Merat, N., Carsten, O.M.J., & Lai, F.C.H. (2013). Behavioural changes in drivers
experiencing highly-automated vehicle control in varying traffic conditions. Transportation
Research Part C: Emerging Technologies, 30, 116-125.
Ji, Y. J., Lee, L., & Hwang, W. (2011). Haptic perception in the vehicle seat. Human Factors
and Ergonomics in Manufacturing and Service Industries, 21(3), 305-325.
Jones, C. M., Gray, R., Spense, C., & Tan, H. Z. (2008). Directing visual attention with spatially
informative and spatially noninformative tactile cues. Experimental Brain Research,
186(4), 659-669.
Jones, L. A., & Sarter, N. B. (2008). Tactile displays: Guidance for their design and application.
Human Factors, 50(1), 90-111.
Kaber, D. B., & Endsley, M. R. (1997). Out-of-the-loop performance problems and the use of
intermediate levels of automation for improved control system functioning and safety.
Process Safety Progress, 16(3), 126-131.
Kaber, D. B., & Endsley, M. R. (2004). The effects of level of automation and adaptive
automation on human performance, situation awareness and workload in a dynamic control
task. Theoretical Issues in Ergonomics Science, 5(2), 113-153. doi:
10.1080/1463922021000054335.
Kaber, D. B., Riley, J. M., Tan, K.-W., & Endsley, M. R. (2001). On the design of adaptive
automation for complex systems. International Journal of Cognitive Ergonomics, 5(1), 37-
57.
Kandel, E. R., Schwartz, J. H., & Jessell, T. M. (2000). Principles of neural science (4th Ed.).
New York: McGraw-Hill Health Professions.
Kazi, T. A., Stanton, N. A., Walker, G. H., & Young, M. S. (2007). Designer driving: Drivers’
conceptual model and level of trust in adaptive cruise control. International Journal of
Vehicle Design, 45(3), 339-360.
Kiefer, R. J. (1996). A review of driver performance with head-up displays. Third World
Congress on Intelligent Transport Systems [CD-ROM]. Washington, DC: ITS America.
Kiefer, R. J., Cassar, M. T., Flannagan, C. A., Jerome, C. J., & Palmer, M. D. (2005). Surprise
braking trials, time-to-collision judgments, and “first look” maneuvers under realistic
rear-end crash scenarios (Forward Collision Warning Requirements Project, Tasks 2 and
3a Final Report (Report No. DOT HS 809 902). Washington, DC: National Highway
Traffic Safety Administration.
Kiefer, R., LeBlanc, D., Palmer, M., Salinger, J., Deering, R., & Shulman, M. (1999).
Development and validation of functional definitions and evaluation procedures for
collision warning/avoidance systems (Report No. DOT HT 808 964). Washington, DC:
National Highway Traffic Safety Administration.
115
Kun, A., Paek, T., Medenica, Z. (2007). The effect of speech interface accuracy on driving
performance. Proceedings of the 8th Annual Conference of the International Speech
Communication Association (Interspeech 2007), 2332-2335.
Laurienti, P. J., Burdette, J. H., Maldjian, J. A., & Wallace, M. T. (2006). Enhanced multisensory
integration in older adults. Neurobiology of Aging, 27, 1155-1163.
Lee, J. D., McGehee, D. V., Brown T. L., & Marshall, D. (2006). Effects of adaptive cruise
control and alert modality on driver performance. Transportation Research Record:
Journal of the Transportation Research Board, 1980, 49-56.
Lee, J. D., McGehee, D. V., Brown, T. L., & Marshall, D. (2006). Effects of adaptive cruise
control and alert modality on driver performance. Transportation Research Record:
Journal of the Transportation Research Board, 1980, 49-56.
Lee, J. D., McGehee, D. V., Brown, T. L., & Marshall, D. (2006). Effects of adaptive cruise
control and alert modality on driver performance. Transportation Research Record:
Journal of the Transportation Research Board, 1980, 49-56.
Lee, J. D., McGehee, D. V., Brown, T. L., & Nakamoto, J. (2012). Driver sensitivity to brake
pulse duration and magnitude. Ergonomics, 50(6), 828-836.
Lee, J. D., McGehee, D. V., Brown, T. L., & Reyes, M. L. (2002). Driver distraction, warning
algorithm parameters, and driver response to imminent rear-end collisions in a high-
fidelity driving simulator (Report No. DOT HS 809 448). Washington DC: National
Highway Traffic Safety Administration.
Lee, J. D., & Moray, N. (1994). Trust, self-confidence, and operators’ adaptation to automation.
International Journal of Human-Computer Studies, 40, 153-184.
Lee, J. D., & See, K. A. (2004). Trust in automation: Designing for appropriate reliance. Human
Factors, 46(1), 50-80.
Lee, J. D.., & Seppelt, B. D. (2012). Human factors and ergonomics in automation design. In G.
Salvendy (Ed.), Handbook of Human Factors and Ergonomics, Fourth Edition (pp.1615-
1642). Hoboken: Wiley & Sons.
Lee, S. E., Knipling, R. R., DeHart, M. C., Perez, M. A., Holbrook, G. T., Brown, S. B., . . .
Olson, R. L. (2004). Vehicle-based countermeasures for signal and stop sign violations:
Task 1. Intersection control violation crash analyses. (Report No. DOT HS 809 716).
Washington, DC: National Highway Traffic Safety Administration.
Leonard, S. D. (1999). Does color of warning affect risk perception? International Journal of
Industrial Ergonomics, 23, 499-504.
Lerner, N. D., Kotwal, B. M., Lyons, R. D., & Gardner-Bonneau, D. J. (1996). Preliminary
human factors guidelines for crash avoidance warning devices. Interim report (Report No.
DOT HS 808 342). Washington, DC: National Highway Traffic Safety Administration.
Available at https://archive.org/stream/preliminaryhuman00lern#page/n1/mode/2up
Levitan, L., Bunus, M., Dewing, W. L., Reinhart, W., Vora, P. B., & Llaneras, R. E. (1997).
Preliminary human factors guidelines for automated highway system designers (2nd Ed.)
(Report No. FHWA-RD-97-125). McLean, VA: Federal Highway Administration.
Lind, H. (2007). An efficient visual forward collision warning display for vehicles. SAE
Technical Paper 2007-01-1105. doi:10.4271/2007-01-1105.
116
Llaneras, R. E., Salinger, J., & Green, C. A. (2013). Human Factors issues associated with
limited ability autonomous driving systems: Drivers' allocation of visual attention to the
forward roadway. Proceedings of the International Driving Symposium on Human Factors
in Driver Assessment, Training, and Vehicle Design, 7, 92-98.
Lo, V. E-W., & Green, P. A. (2013). Development and evaluation of automotive speech
interfaces: Useful information from the human factors and related literature. International
Journal of Vehicular Technology, 2013, Article ID 924170. Retrieved from
www.hindawi.com/journals/ijvt/2013/924170/.
Lumsden, J. (2008). Handbook of research on user interface design and evaluation for mobile
technology, Volume I. Retrieved from www.comm.rwth-aachen.de/files/lumsden122.pdf
Marshall, D. C., Lee, J. D., & Austria, P. A. (2007). Alerts for in-vehicle information systems:
Annoyance, urgency, and appropriateness. Human Factors, 49(1), 145-157.
Martens, M., Pauwelussen, J., Schieben, A., Flemisch, F., Merat, N., Jamson, A. H., & Caci, R.
(2008). Human factors’ aspects in automated and semi-automatic transport systems: State
of the art (Report 3.2.1). Brussels: European Commission.
McDougall, S., Tyrer, V., & Folkard, S. (2006). Searching for signs, symbols, and icons: Effects
of time of day, visual complexity, and grouping. Journal of Experimental Psychology,
12(2), 118-128. doi: 10.1037/1076-898X.12.2.118.
McGuirl, J. M., & Sarter, N. B. (2006). Supporting trust calibration and the effective use of
decision aids by presenting dynamic system confidence information. Human Factors,
48(4), 656–665.
McKnight, J., & Adams, B. (1970). Driver education and task analysis, Volume 1: Task
descriptions (Report No. DOT HS 800 367). Washington DC: National Highway Traffic
Safety Administration.
Merat, N., & Jamson, A. H. (2009). How do drivers behave in a highly automated car?
Proceedings of the International Driving Symposium on Human Factors in Driver
Assessment, Training, and Vehicle Design, 5, 514-521.
Michon, J. A. (1985). A critical view of driver behavior models: What do we know, what should
we do? In L. Evans & R. C. Schwing (Eds.) Human Behavior and Traffic Safety (pp. 485-
520). New York: Plenum Press.
Miller, C. A., & Funk, H. B. (2001). Associated with etiquette: Meta-communication to make
human-automation interaction more natural, productive, and polite. Proceedings of the 8th
European Conference on Cognitive Science Approaches to Process Control. Munich,
Germany.
Miller, C. A., & Parasuraman, R. (2007). Designing for flexible interaction between humans and
automation: Delegation interfaces for supervisory control. Human Factors, 49(1), 57-75.
Department of Defense. (January 11, 2012). MIL-STD-1472G. Department of Defense Design
Criteria Standard: Human Engineering. Washington, DC: U.S. Government Printing
Office.MIL-STD-1472G (2012). Human engineering. Washington, DC: Department of
Defense. Available at http://everyspec.com/MIL-STD/MIL-STD-1400-
1499/download.php?spec=MIL-STD-1472G.039997.pdf.
Mourant, R. R., & Langolf, G. D. (1976). Luminance specifications for automobile instrument
panels. Human Factors, 18(1), 71-84.
117
Muir, B. M., & Moray, N. (1996). Trust in automation: Part II. Experimental studies of trust and
human intervention in a process control simulation. Ergonomics, 39, 429-460.
NASA Ames Research Center Color Usage Research Lab. (n.d.) Using color in information
display graphics. Retrieved from the NASA Ames Research Center Color Usage Research
Lab website at http://colorusage.arc.nasa.gov/index.php.
National Highway Traffic Safety Administration. (2011). Crash warning interface metrics,
Phase 2 (Report No. DOT HS 811 471). Washington, DC: Author.
National Highway Traffic Safety Administration. (2013). Preliminary statement of policy
concerning automated vehicles (NHTSA 14-13). Retrieved from
www.nhtsa.gov/About+NHTSA/Press+Releases/U.S.+Department+of+Transportation+Rel
eases+Policy+on+Automated+Vehicle+Development.
Norman, D. A. (1990). The problem of automation: Inappropriate feedback and interaction, not
over-automation. Philosophical Transactions of the Royal Society of London, B, 1-18.
O’Day, S., & Tijerina, L. (2011). Legibility: Back to the basics. SAE International Journal of
Passenger Cars—Mechanical Systems, 4(1), 591-604.
O’Toole, R. (2009). Gridlock: Why we’re stuck in traffic and what to do about it. Washington,
DC: Cato Institute Press.
O'Hanlon, J. F., & Kelley, G. R. (1977). Comparison of performance and physiological changes
between drivers who perform well and poorly during prolonged vehicular operation. In R.
R. Mackie (Ed.), Vigilance: Theory, Operational Performance and Physiological
Correlates (pp. 87-109). New York: Plenum Press.
Owens, J. M., McLaughlin, S. B., & Sudweeks, J. (2011). Driver performance while text
messaging using handheld and in-vehicle systems. Accident Analysis & Prevention 43,
939-947. doi: doi:10.1016/j.aap.2010.11.019.
Panou, M. C., Bekiaris, E. D., & Touliou, A. A. (2010). ADAS module in driving simulation for
training young drivers. Proceedings of the 13th International IEEE Annual Conference on
Intelligent Transportation Systems, 1582-1587.
Parasuraman, R., Hilburn, B., Molloy, R., & Singh, I. (1991). Adaptive automation and human
performance: III. Effects of practice on the benefits and costs of automation shifts
(NAWCADWAR-92037-60). Warminster, PA: Naval Air War Center-Aircraft Division.
Parasuraman, R., & Miller, C. A. (2004). Trust and etiquette in high-criticality automated
systems. Communications of the ACM, 47(4), 51-55.
Parasuraman, R., & Riley, V. (1997). Humans and automation: Us, misuse, disuse, abuse.
Human Factors, 39(2), 230-253.
Parasuraman, R., Sheridan, T. B., & Wickens, C. D. (2000). A model of types and level of
human interaction with automation. IEEE Transactions on Systems, Man and Cybernetics,
Part A, Systems, and Humans, 30(3), 286-297.
Parasuraman, R., & Wickens, C. D. (2008). Humans: Still vital after all these years of
automation. Human Factors, 50(3), 511-520.
Perez, M. A., Kiefer, R. J., Haskins, A., & Hankey, J. M. (2009). Evaluation of forward collision
warning system visual alert candidates and SAE J2400. SAE International Journal of
Passenger Cars- Mechanical Systems, 2(1), 750-764. doi:10.4271/2009-01-0547
118
Pickrell, T. M., & Liu, C. (2014). Seat belt use in 2013: Overall results (Report No. DOT HS
811 875). Washington, DC: National Highway Traffic Safety Administration.
Pollock, E., Chandler, P., & Sweller, J. (2002). Assimilating complex information. Learning and
Instruction, 12, 61-68.
Pomerleau, D., Jochem, T., Thorpe, C., Batavia, P., Pape, D., Hadden, J., . . . Everson, J. (1999).
Run-off-road collision avoidance using IVHS countermeasures, Final report (Report No.
DOT HS 809 170). Washington, DC: National Highway Traffic Safety Administration.
Popp, M. M., & Faerber, B. (1993). Feedback modality for nontransparent driver control actions:
Why not visually? In A.G. Gale, I.D., Brown, C.M. Haslegrave, H.W. Kryusse, & S.P.
Taylor (Eds.), Vision in Vehicles—IV (pp.263-270). Amsterdam: Elsevier Science.
Porter, M. M. (2013). Older driver training using video and global positioning system
technology—a randomized controlled trial. Journals of Gerontology Series A: Biomedical
Sciences and Medical Sciences, 68(5), 574-580. doi:10.1093/Gerona/gls160.
Prinzel, L. J., III, & Risser, M. (2004). Head-up displays and attention capture (NASA/TM-
2004-213000). Retrieved from the NASA Technical Reports Server website at
http://naca.larc.nasa.gov/search.jsp?R=20040065771&qs=N%3D4294966788%2B4294724
598%2B4294323833.
Rajaonah, B., Anceaux, F., & Vienne, F. (2006). Trust and use of adaptive cruise control: A
study of a cut-in situation. Cognition, Technology and Work, 8(2), 146-155.
Rasmussen, J. (1983). Skills, rules, and knowledge: Signals, signs, and symbols, and other
distinctions in human performance models. IEEE Transactions on Systems, Man, and
Cybernetics, SMC-13(3), 257-266. doi: 10.1109/TSMC.1983.6313160.
Redding, R. E., Cannon, J.R., & Seamster, T. L. (1992). Expertise in air traffic control (ATC):
What is it, and how can we train for it? Proceedings of the Human Factors and Ergonomics
Society, 36, 1326-1330.
Reiner, A. (2010). Sensor-actuator supported implicit interaction in driver assistance systems.
Wiesbaden, Germany: Vieweg+Teubner.
Rosario, H., Louredo, M., Diaz, I., Soler, A., Gil, J. J., Solaz, J. S., & Jordi, J. (2010). Efficacy
and feeling of a vibrotactile frontal collision warning implemented in a haptic pedal.
Transportation Research Part F: Traffic Psychology and Behaviour, 13(2), 80-91.
Rudin-Brown, C. M., & Parker, H. A. (2004). Behavioural adaptation to adaptive cruise control
(ACC): Implications for preventative strategies. Transportation Research Part F: Traffic
Psychology and Behaviour, 7, 59-76.
Ryu, J., Chun, J., Choi, S., & Han, S. H. (April, 2010). Vibrotactile feedback for information
delivery in the vehicle. IEEE Transactions on Haptics, 3(2), 138-149.
Society of Automotive Engineers. (2009). SAE J1138: Design criteria—Driver hand controls
location for passenger cars, multipurpose passenger vehicles, and trucks (10,000 GVW and
under). Warrendale, PA: SAE International.
SAE. (2003). SAE J2399: Adaptive cruise control (ACC) operating characteristics and user
interface. Warrendale, PA: SAE International.
SAE. (2003). SAE J2400: Human factors in forward collision warning systems: Operating
characteristics and user interface requirements. Warrendale, PA: SAE International.
119
SAE. (2008). SAE J2830: Process for comprehension testing of in-vehicle icons. Warrendale,
PA: SAE International.
SAE. (2007). SAE J267: Driver hand control reach. Warrendale, PA: SAE International.
SAE. (2014). SAE J3016: Taxonomy and definitions for terms related to on-road motor vehicle
automated driving systems. Warrendale, PA: SAE International.
Salinger, J. (2012). Human factors for limited-ability autonomous driving systems. Retrieved from
http://onlinepubs.trb.org/onlinepubs/conferences/2012/Automation/presentations/
Salinger.pdf
Sarter, N. B., & Woods, D. D. (1995). How in the world did we ever get into that mode? Mode
error and awareness in supervisory control. Human Factors, 37, 5-19. doi:
10.1518/001872095779049516.
Sarter, N. B., Woods, D. D., & Billings, C. E. (1997). Automation surprises. In G. Salvendy
(Ed.), Handbook of Human Factors and Ergonomics, Second Edition (pp. 1926-1943).
Hoboken: Wiley & Sons.
Scott, J. J., & Gray, R. (2008). A comparison of tactile, visual, and auditory warnings for rear-
end collision prevention in simulated driving. Human Factors, 50(2), 264-275. doi:
10.1518/001872008X250674
Seppelt, B. D., & Lee, J. D. (2007). Making adaptive cruise control (ACC) limits visible.
International Journal of Human-Computer Studies, 65, 192-205.
Sheridan, T. B. and Parasuraman, R. (2005). Human-automation interaction. Reviews of Human
Factors and Ergonomics, 1, 89-129.
Soccolich, S. A., Blanco, M., Hanowski, R. J., Olson, R. L., Morgan, J. F., Guo, F., & Wu, S. C.
(2013). An analysis of driving and working hour on commercial motor vehicle driver safety
using naturalistic data collection. Accident Analysis & Prevention, 58, 249-258.
Spain, R. D., & Madhavan, P. (2009). The role of automation etiquette and pedigree in trust and
dependence. Proceedings of the Human Factors and Ergonomics Society 53
rd
Annual
Meeting, 339-343.
Spence, C., Ngo, M. K., Lee, J.-H., & Tan, H. (2010). Solving the correspondence problem in
haptic/multisensory interface design. In M. H. Zadeh (Ed.). Advances in Haptics (pp. 47-
74). Available from: www.intechopen.com/books/advances-in-haptics/solving-
thecorrespondence-problem-in-haptic-multisensory-interface-design.
Stanley, L. M. (2006). Haptic and auditory cues for lane departure warnings. Proceedings of the
Human Factors and Ergonomics Society Annual Meeting, 50, 2405-2408. doi:
10.1177/154193120605002212.
Stanton, N. A., Dunoyer, A., & Leatherland, A. (2011). Detection of new in-path targets by
drivers using stop & go adaptive cruise control. Applied Ergonomic, 42, 592-601.
Stanton, N. A., & Marsden, P. (1996). From fly-by-wire to drive-by-wire: Safety implications of
vehicle automation. Safety Science, 24, 35-49.
Stanton, N. A., & Young, M. S. (1998). Vehicle automation and driving performance.
Ergonomics, 41(7), 1014-1028.
Stanton, N. A., & Young, M. S. (2000). A proposed psychological model of driving automation.
Theoretical Issues in Ergonomics Science, 1(4), 315-331.
120
Stanton, N. A., Young, M. S., Walker, G. H., Turner, H., & Randle, S. (2001). Automating the
driver’s control tasks. International Journal of Cognitive Ergonomics, 5(3), 221-236.
Stevens, A., Hallen, H., Pauzie, A., Vezier, B., Gelau, C., Eckstein, L., . . . Höfs, W. (2005).
European statement of principles on the design of human machine interaction (ESoP 2005,
Draft). Directorate-General Information Society Technologies and Media of the European
Commission.
Strickland, D. (2013, August 13). Every co-pilot needs a pilot. Washington Automotive Press
Association Luncheon. Washington, DC.
Suied, C., Susini, P., & McAdams, S. (2008). Evaluating warning sound urgency with reaction
times. Journal of Experimental Psychology: Applied, 14(3), 201-212.
Suzuki, K., & Jansson, H. (2003) An analysis of driver’s steering behavior during auditory or
haptic warnings for designing of lane departure warning system. JSAE Review, 24, 63-70.
Tan, A. K., & Lerner, N. D. (1995). Multiple attribute evaluation of auditory warning signals for
in-vehicle crash avoidance warning systems (Report No. DOT HS 808 535). Washington,
DC: National Highway Traffic Safety Administration, Office of Crash Avoidance
Research.
Thiffault, P., & Bergeron, J. (2003). Fatigue and individual differences in monotonous simulated
driving. Personality and Individual Differences, 34(1), 159-179.
Tijus, C., Barcenilla, J., Cambon de Lavalette, B., & Maunier, J.-G. (2007). The design,
understanding and usage of pictograms. In G. Rijlaarsdam (Series Ed.) Vol. 21. Studies in
Writing: Written Documents in the Workplace (pp. 17-31). Netherlands: Kluwer.
Toffetti, A. Wilschut, E. S., Martens, M. H., Schieben, A., Rambaldini, A., Merat, N., &
Flemisch, F. (2009). CityMobil: Human factor issues regarding highly automated vehicles
on eLane. Transportation Research Record: Journal of the Transportation Research
Board, 2110, 1-8. doi: 10.3141/2110-01.
Tsao, H.-S. J., Hall, R. W., & Shadlover, S. E. (1993). Design options for operating fully
automated highway systems. Berkeley: University of California PATH Institute of
Transportation Studies.
United States Army Training and Doctrine Command (TRADOC). (2003). Objective force
embedded training (OFET): User’s functional description (TRADOC Pamphlet No. 350-
37). Fort Monroe, VA: Author.
Wäfler, T., Grote, G., Windischer, A., & Ryser, C. (2003). KOMPASS: A method for
complementary system design. In E. Hollnagel (Ed.), Handbook of Cognitive Task Design.
Mahwah, NJ: Erlbaum.
Wickens, C. D., Hutchins, S., Carolan, T., & Cumming, J. (2013). Effectiveness of part-task
training and increasing-difficulty training strategies: A meta-analysis approach. Human
Factors, 55, 461-470.
Widmann, G., Salinger, J., Dufour, R., and Green, C. (2011). Human factors studies for limited-
ability autonomous driving systems (LAADS). Presentation at the SAE 2011
Government/Industry Meeting. Washington DC. Retrieved from
www.sae.org/events/gim/presentations/2011.
Wiener, E. (1989). Human factors of advanced technology (“glass cockpit”) transport aircraft
(NASA Contractor Report 177528). Moffett Field, CA: NASA Ames Research Center.
121
Wiener, E. L., Chute, R. D., & Moses, J. H. (1999). Transition to glass: Pilot training for high-
technology transport aircraft (NASA/CR-1999-208784). National Aeronautics and Space
Administration: Washington, DC.
Wiese, E. E., & Lee, J. D. (2004). Auditory alerts for in-vehicle information systems: The effects
of temporal conflict and sound parameters on driver attitudes and performance.
Ergonomics, 47(9), 965-986. doi: 10.1080/00140130410001686294.
Wilde, G. J. S. (1998). Risk homeostasis theory: An overview. Injury Prevention, 4, 89-91.
doi: 10.1136/ip.4.2.89.
Wilkison, B.D. (2008). Effects of mental model quality on collaborative system performance
(Master’s Thesis). Georgia Institute of Technology, Atlanta, GA.
Williges, B. H., & Williges, R. C. (1982). Structured human/computer dialogue using speech
technology. Proceedings of the Workshop on Standardization for Speech I/O Technology
(pp. 143-151). Gaithersburg, MD: National Bureau of Standards.
Wreggit, S. S., Powell, J., Kirn, C., & Hayes, E. (2000). Human factors evaluation of the truck
productivity computer’s electroluminescent display (Paper No. 2000-01-3409).
Warrendale, PA: SAE International.
Yoo, H., Tsimhoni, O., Wantanabe, H., Green, P., & Shah, R. (1999). Display of HUD warnings
to drivers: Determining an optimal location (UMTRI-99-9). Ann Arbor: University of
Michigan Transportation Research Institute.
Young, M. S., & Stanton, N. A. (1997). Automotive automation: Investigating the impact on
drivers’ mental workload. International Journal of Cognitive Ergonomics, 1, 325-336.
Young, M. S., & Stanton, N. A. (2007). Back to the future: Brake reaction times for manual and
automated vehicles. Ergonomics, 50(1), 46-58. doi: 10.1080/00140130600980789.

DOT HS 812 555
August 2018
13494-080318-v3
