
This paper is included in the Proceedings of the
30th USENIX Security Symposium.
August 11–13, 2021
978-1-939133-24-3
Open access to the Proceedings of the
30th USENIX Security Symposium
is sponsored by USENIX.
“Shhh. be quiet!” Reducing the Unwanted
Interruptions of Notification Permission
Prompts on Chrome
Igor Bilogrevic, Balazs Engedy, Judson L. Porter III, Nina Taft,
Kamila Hasanbega, Andrew Paseltiner, Hwi Kyoung Lee, Edward Jung,
Meggyn Watkins, PJ McLachlan, and Jason James, Google
https://www.usenix.org/conference/usenixsecurity21/presentation/bilogrevic

“Shhh...be quiet!” Reducing the Unwanted Interruptions of Notification
Permission Prompts on Chrome
Igor Bilogrevic Balazs Engedy Judson L. Porter III Nina Taft Kamila Hasanbega
Andrew Paseltiner Hwi Kyoung Lee Edward Jung Meggyn Watkins PJ Mclachlan
Jason James
Google
{ibilogrevic,engedy,jud,ninataft,hkamila,apaseltiner,hwi,edwardjung,
meggynwatkins,pjmclachlan,jasonjames}@google.com
Abstract
Push notifications can be a very useful feature. On web
browsers, they allow users to receive timely updates even if
the website is not currently open. On Chrome, the feature has
become extremely popular since its inception in 2015, but it is
also the least likely to be accepted by users. Chrome teleme-
try shows that, although 74% of all permission prompts are
about notifications, they are also the least likely to be granted
with only a 10% grant rate on desktop and 21% grant rate
on Android. In order to preserve its utility for websites and
to reduce unwanted interruptions and potential abuses for
the users, we designed and tested both a novel UI and its ac-
tivation mechanism for notification permission prompts in
Chrome.
To understand how users interact with such prompts, we
conducted two large-scale studies with more than 300 mil-
lion users in the wild. The first study showed that most of
them block or ignore the prompts across all types of web-
sites, which prompted us to rethink its UI and activation logic.
The second study, based on an A/B test using behavioral data
from more than 40 million users who interacted with more
than 100 million prompts on more than 70 thousand websites,
show that the new prompt is very effective at reducing un-
wanted interruptions and their frequency (up to 30% fewer
unnecessary actions on the prompts), with a minimal impact
(less than 5%) on the grant rates, across all types of users and
websites. We achieve these results thanks to a novel adaptive
activation mechanism coupled with a block list of interrupt-
ing websites, which is derived from crowd-sourced telemetry
from Chrome clients.
1 Introduction
The web browser is the main gateway to the World Wide Web
for over 4.5 billion people [39]. Browser APIs allow websites
to access resources and information on the client devices in
a scalable and standardized way, enabling users to benefit
from fast, interactive and personalized experiences without
having to install and run dedicated applications. Some of those
APIs provide access to sensitive data (such as geolocation or
the microphone), and in those cases the website has to ask
the user for permission before it can access such data [44].
Moreover, permission-gated APIs can provide an additional
layer of security from other kinds of abuses, such as spam,
phishing or deceptive marketing [5, 29].
Web push notifications are a very popular mechanism for
websites to keep their users updated with timely content when
a website is not open or is in the background. On Chrome, the
telemetry shows that notification permission prompts account
for 74% of all permission prompts shown to users during the
month of March 2020. To receive notifications, users have to
visit the website and grant the notification permission when
prompted [45]. In order to help websites decide when to
ask for the notification permission, Chrome and the Mozilla
foundation have published a set of best practices to follow
when asking for web push permissions [34, 46]. Chrome’s
best practices are centered around two main principles: (i)
users should show intent to receive notifications and (ii) sites
should provide in-site management controls for notifications.
Similarly, Mozilla’s best practises also caution developers
to use them sparingly as they could be annoying [46]. In
addition to being unwanted, such prompts can also be in-
terrupting. Much prior work (see Section 2) has shown that
poorly managed interruptions have multiple negative conse-
quences, including an increased level of annoyance, anxiety,
errors due to inattention and a desire to click-through with-
out understanding the implications of doing so [7, 13]. A
recent Mozilla study [31] concluded that notification prompts
are indeed very unpopular. Even worse, certain websites try
to trick users into granting the notification permission with
misleading information about its actual purpose or by gating
their content on the acceptance of the notification permission
prompt [5]. Other websites could see it as an effective means
to drive re-engagement [2, 15].
The problem we tackle here is how to reduce unwanted –
and likely annoying – notifications for the majority of users
without significantly impacting those who do want to opt in to
USENIX Association 30th USENIX Security Symposium 769

Figure 1: Chrome version 80, quiet prompt on desktop with
an animated bell icon.
notifications. We design a solution that leverages the browser
to manage the complex trade-offs that might arise between
users who are unlikely to want to receive notifications, those
that do seem to want them, and many website owners who
might rely on them for increased engagement and higher ser-
vice utility [16]. Our solution for Chrome has three main
components. First, we introduce a “quieter” notification per-
mission UI with a strikethrough bell (Figure 1), which is less
intrusive and it allows users to enable notifications in a di-
rect way should they want to. Second, we determine criteria
when to show this UI to users based on their prior blocking
choices. This is difficult not only because we need to simul-
taneously meet the needs of millions of users who exhibit a
wide range of behaviors, but also because many behaviors
are not explicit (e.g., when they simply ignore the prompts).
Third, we determine the conditions under which Chrome ac-
tivates this new prompt for websites. Doing this requires us
to carefully balance the need to prevent abusive or spammy
websites from interrupting the users, while not interfering
with websites that use notifications responsibly and according
to best practices. We note that other popular web browsers
(Safari and Firefox) have independently introduced updates to
the requirements and interface of the notification permission
prompt [4, 21,26,31, 42], while Microsoft Edge has leveraged
our solution [30] and enabled it by default for all users across
all websites.
In this paper, we present the results of the largest and most
comprehensive analysis, to the best of our knowledge, of the
use of notification permission prompts in the wild, and show
that our solution effectively balances the needs of both users
and websites in Chrome. Our main contributions are:
•
We conduct a first large-scale experiment to study the in-
teraction of hundreds of millions of Chrome users with the
notification permission prompt in the wild. Our findings
show only 10% and 21% of notification permissions are
granted on the desktop and Android, respectively, which
suggests that the vast majority of users do not see a clear
benefit from receiving notifications when prompted across
all types of websites.
•
We present the process that we adopted to rethink the no-
tification permission prompt in order to reduce unwanted
interruptions for users and potential abuses by websites,
and at the same time not to penalize users that do want to
receive notifications and websites that do adhere to the best
practices when showing such prompts.
•
We introduce proxy measures for unwanted notification
prompts, and we conduct a second large-scale experiment
with more than 40 million users as an A/B test, which shows
that the new UI and its activation logic manage to achieve
not only a desired reduction in unwanted interruptions,
but also to have minimal negative impact on grant rates.
Moreover, they provide a concrete incentive for websites
to use the notifications API responsibly.
In particular, our second experiment shows that the new
prompt and its activation logic reduce the interruptiveness
of unwanted notification permission prompts by up to 30%,
while limiting the impact on the grant rates to less than 5%.
Finally, in order to provide transparency, accountability and
accessibility of interaction rates with the notification prompt
across websites, we include them in a publicly accessible
online tool [18], which does not require any extra instrumen-
tation from the websites.
The remainder of the paper is structured as follows. In
Section 2 we discuss the related work, and in Section 3 we
present the first experiment, in which we measured the inter-
actions of more than 300 million Chrome users on more than
800 million notifications permission prompts, across more
than 70 thousand websites. In Section 4 we describe the ap-
proach and measures we took to limit the interruptions due to
unwanted notification permission prompts, and show in the
second experiment how this approach has reduced unwanted
interruptions to the browsing experience with a limited impact
on the grant rates. In Section 5 we discuss the implications of
our changes for the web ecosystem and present some of the
limitations of our study. Finally, we present our conclusions
in Section 6.
2 Related Work
In the 2000s when push notifications were first introduced,
only mobile OSes (such as BlackBerry OS, iPhone OS and
Android) supported them [6, 17]. The availability of push
notifications on the web is much more recent, thanks to the
development and adoption of the Notifications API in the
mid 2010s. In this section, we discuss works that studied the
effects of interruptions – such as notification prompts – on the
primary task, and those that analysed deceptive notifications
that could lead to privacy and security threats.
2.1 Interruptions due to Notifications
Bailey and Konstan [7] conducted a laboratory experiment
to measure the effects of interruptions on task completion
time, error rate, annoyance, and anxiety. They manipulated
the time at which the interruption was displayed, either during
the primary tasks or in-between tasks. They showed that,
when the interruption occurs during the primary task, users
experience up to 106% more annoyance, and “commit twice
the number of errors” as well as “experience twice the increase
in anxiety” as compared to when the interruption happens in-
between the primary tasks. Moreover, as reported in numerous
works surveyed in [25], not all interruptions have the same
770 30th USENIX Security Symposium USENIX Association

negative effect: while interruptions are not detrimental when
performing simple and repetitive tasks, they do negatively
affect task performance for complex tasks, especially when
the primary task is unrelated to the interrupting one.
In the work by Felt et al. [13] on mobile app permissions,
the authors proposed a set of guidelines on how to ask for
permissions in order to reduce the habituation to permission
prompts. One of the two principles – avoid interruptions –
highlights the importance of avoiding interrupting users with
security-related tasks while they are doing something unre-
lated – such as browsing a website. Otherwise, users are likely
to “click through a dialog box...without fully understanding
the consequences”. Permission prompts by mobile apps and
notification prompts in browsers are very similar in this re-
spect, as they both interrupt the users’ primary task.
Several other works have studied users’ interaction behav-
ior with notifications on mobile devices [14, 27,28, 32, 36,37].
For instance, the experiment conducted by Fischer et al. [14]
showed that mobile notifications are dealt with more quickly
and with a higher completion rate if they arrive at a moment
where the users are in-between tasks rather than during the pri-
mary task, which is to some extent similar to previous findings
by Bailey et al. [7] but in this specific context. Furthermore,
the study by Pejovic and Musolesi [36] revealed that, in addi-
tion to the timing and primary task, other contextual features
such as location, time of the day, emotion and engagement
determine if a moment is suitable for receiving a notification.
In another related work, Okoshi et al. [32] developed a mech-
anism that selects the best timing for delivering notifications
based on the users’ physical activity and UI events, which
reduces by 71.8% the users’ perceived workload as compared
to other systems based on UI-only events. Similarly, Mehro-
tra et al. [27] used contextual information, such as the users’
activity, and social relationship between senders and receivers
to develop a machine-learning based system to select the most
appropriate timing for the delivery of the notification. Their
system outperformed mechanisms based on user-defined rules
of their own interruptibility. More recently, Pielot et al. [37]
showed that non-messaging notifications are significantly less
likely to be acted upon quickly, which is a notion that mali-
cious websites seem to abuse in order to mislead users into
granting the notification permission [5].
Web push notifications appear to the users as native sys-
tem notifications on both mobile and desktop platforms that
support the Notifications API [43]. Therefore, as they are
not different from app notifications in this respect, the results
established in prior works apply to them as well. We were
unable to find specific studies on web push notifications that
tackled any aspect related to interruptibility, in a similar way
to the studies on app notifications we described previously.
2.2 Deceptive Notifications
In addition to being potentially interrupting, web push noti-
fications can be quite deceptive and pose a significant threat
for the users’ security and privacy, by means of phishing
and spam [24, 35, 47], social engineering [41], forging and
denial-of-service attacks [3]. Phishing is likely one of the
most significant threats that malicious notifications can lead
to. In their early work in 2012, Xu and Zhu [47] already
showed how customized notifications could be successfully
used to launch phishing attacks and post spam notifications in
earlier versions of Android (2.3 and 4.0). More broadly, social
engineering attacks – such as the ones studied by Vadrevu et
al. [41] – were discovered on some ad landing pages, which
were used in order to lure the user into granting the notifica-
tion permission by promising access to access adult content.
In Alepis’s recent work [3] on Android version 7, the author
shows how it is possible to forge notifications – even web
push notifications – both locally (by a malicious app, for ex-
ample) and remotely. Although the notification forging attack
requires the user to install a malicious app, by either down-
loading it from the Play Store or another source, it shows once
again how notification customization can be abused. While
issues related to deceptive notifications are very important,
our work does not tackle them directly. However, it has a
positive side effect of limiting such abuses by automatically
blocking intrusive permission prompts for many users.
3 Interactions with the Legacy Notification
Permission Prompts
In this section, we describe how Chrome users interact with
the legacy notification permission prompt (Figure 2) which
is the only one that was available until version 80. First, we
introduce essential background information about the Noti-
fications API, and then we describe our experiment and the
results that made us rethink the experience with the notifica-
tion permission prompt.
3.1 Background
Popular operating systems (OSs), such as Microsoft Windows,
macOS, iOS, Android and Chrome OS, allow third-party apps
to display push notifications as native system notifications
to users [10, 11, 30]. Typically, each OS provides different
APIs that apps – including browsers – can use to deliver such
notifications. On the contrary, browsers usually implement a
standard set of APIs that follow the specification described by
the W3C [43], so that website owners do not have to develop
and maintain different parts of code for the same functionality
across different OSs.
The browser Notifications API [45] is one such standard
API that allows websites to send system notifications even
when users do not have the website open in their browser.
USENIX Association 30th USENIX Security Symposium 771

(a) Desktop platform.
(b) Android platform.
Figure 2: Chrome legacy notification permission prompt.
Users can therefore benefit from timely and relevant informa-
tion from websites that they have opted in to receive notifica-
tions from. However, such functionality can also be prone to
abuses, as it provides websites with an effective means to drive
re-engagement rates [2, 15]. There are many examples where
websites have abused this functionality, by either disguising
the notification prompt as a chat window, by gating the web-
site’s content on the acceptance of the prompt, or by trying to
circumvent existing abuse-prevention mechanisms [5, 12].
The API specification mandates that “Notifications can
only be displayed if the user (or user agent on behalf of
the user) has granted permission” [43]. Before asking for
that permission, the website should check its current state,
which could be one of granted, denied or default. The latter
is equivalent to a deny decision and it applies if no prior ex-
plicit decision has been made yet. Hereafter we describe how
Chrome users interacted with the legacy notification permis-
sion prompts (Figure 2), which are the only ones that were
available before version 80. This analysis is important as it
clearly shows how most of the legacy prompts unnecessarily
interrupt the browsing experience, and it provides us with a
compelling reason to rethink it in a way to reduce interrup-
tions while keeping the benefits for the users who might want
to receive notifications.
It is also important to note that there is a significant dif-
ference in the way the permission prompt is shown to users
on desktop and Android Chrome clients. While on desktop
users can continue to browse the website when the prompt
is visible, this is not the case on mobile, where users have to
click on one of the two buttons – ”Allow” or ”Block” – in
order to continue to browse the website. This has a significant
effect on the results of analysis we conduct in this section, and
is also part of the redesign process we discuss in Section 4.
3.2 First Experiment
In order to better understand how Chrome users interact with
the notification permission prompts, we conducted our first
study using the telemetry data that Chrome normally col-
lects from a subset of opted-in users. In Chrome, users can
choose to send usage statistics, crash reports and URLs of
pages they visit to Google in order to help improve Chrome’s
feature set and stability [19]. Usage statistics and crash re-
ports are enabled by default on Chrome and can be disabled
in Chrome’s settings. For instance, 74% of all prompts that
those users see are for the notification permission, a statistic
we mention in the abstract and in Sections 1 and 6. Informa-
tion containing specific URLs can only be collected if users
choose to send the above information and also give extra con-
sent for collecting that data by turning on the setting “Make
searches and browsing better (Sends URLs of pages you visit
to Google)” – this is enabled if the user enables Sync. Once
enabled, Chrome usage statistics will also include information
about the visited URLs, and are keyed by a unique random
device identifier. Usage statistics and Sync can be disabled in
Settings. If re-enabled, the unique device identifier is reset.
The telemetry data we analyse in this study comes from a
10-day period between the 7th and the 16th of March, 2020,
during which Chrome collected the relevant behavioral data
from a random subset of users who are signed-in to with
their Google account, are sharing usage reports and crash
analytics with Google and have enabled the browser Sync
feature without a custom passphrase. The data used in these
studies adheres to Google’s guidelines for data collection and
experimentation. In order to conduct any experiment with real
behavioral data on such a subset of users, we need to obtain
prior approval from key Google stakeholders in a number of
areas, including legal, privacy, UX, engineering, product and
leadership. Only after all of them gave their approval were we
allowed to launch such an experiment. We are not subject to
IRB review, however Chrome’s approved process for rolling
out new features (such as the Quiet UI and its activation logic)
involves partially rolling out a feature to a subset of customers,
and then using A/B testing to compare performance metrics
before and after. We followed standard company practices in
our A/B testing that enabled us to compute impact metrics for
subsets of users.
Our measurement methodology includes a careful choice
of which data to include and which to exclude. The specific
data fields we process are:
1.
The randomly generated unique device identifier, which
can be reset at any time by the user
2.
The OS platform on which the client is running, which can
be either desktop or mobile. For the latter, we only study
772 30th USENIX Security Symposium USENIX Association

data from Android mobile clients, as iOS (current version
13.4.1) does not support web push notifications.
3.
The URL origin (e.g., https://subdomain.website.com) that
displayed the prompt. Throughout the rest of this paper,
we refer to URL origins also as websites or sites.
4.
The type of prompt that was shown to the user (i.e.,
legacy or quiet ). In this section, we only analyse data
about the legacy prompts, whereas in Section 4 we com-
pare and discuss both the legacy and the quiet ones.
5.
The user’s action on the prompt, which can be either grant,
block, ignore or dismiss. A dismiss is recorded when the
user closes the prompt without clicking on either grant or
block, whereas an ignore is recorded when the user does
not interact with the prompt at all. Throughout the rest of
the paper, we refer to any action other than ignore as a
decision. In Chrome, a single grant or deny decision on a
website is recorded for all future visits to the same website.
In other words, while ignoring or dismissing a prompt will
allow the website to show it again at the next visit, granting
or blocking it will prevent that website from showing it
again. This holds until either the user changes the settings
for that website, or re-installs Chrome, or also in case she
dismisses the prompt three times in a row on that website.
Moreover, in order to limit the impact of test accounts or
devices while retaining a large number of samples, we filter
the data according to the following criteria:
•
We only consider devices that saw at least 1 and at most
200 prompts, and that performed less than 100 grant, deny,
or dismiss actions on them. Moreover, we also limit po-
tential spammy reports by (i) removing clients that have
reported more than 100 page load events to the same URL
in any given day, and by (ii) only analysing reports from
genuine Chrome clients that sign the reports with a valid
cryptographic key provided by Google.
•
We only consider URL origins with at least 1000 page loads
and at least 100 decisions (i.e., grant, block or dismiss),
from at least 50 different clients. Moreover, we consider
only data from URL origins that allow automated crawl-
ing. We do not process any URL data from websites that
have opted out from the Robots Inclusion Protocol [22], as
specified in their robots.txt file.
3.3 Results
After filtering out the data samples that do not satisfy the
above criteria, we are able to analyse more than 800 million
actions on legacy prompts, coming from more than 300 mil-
lion clients on more than 70 thousand websites. Overall, only
10% of such prompts are granted on desktop and 21% on
Android. As described hereafter, we use the deny, ignore and
dismiss rates as proxies to assess user annoyance and/or un-
wanted notifications. To measure those directly, one would
have to allow users to carefully report on such aspects every
time they interact with a permission prompt, which would
add more interruptions to an already disrupted experience
for many users. Alternatively, one could also interview users
but that cannot be done on the scale of tens or hundreds of
millions of participants. We chose those signals by consensus,
after reviewing several candidate ones that were available dur-
ing the experiments. In general, if a user denies a notification
prompt, we believe it is a strong signal that either she is not
interested in the service or that she is simply annoyed and
does not want to be asked again. High ignore and dismiss
rates indicate that users are either avoiding having to make a
decision or are truly disinterested and simply want to quickly
get beyond the prompt request. We use this trio of signals to
capture the entirety of the unwanted and annoyed concepts.
While we cannot completely disambiguate a user’s intention,
it is clear that any of these three choices captures either lack
of interest and/or possible annoyance.
3.3.1 Clients
In order to better understand how clients interact with prompts,
we look at the rate at which prompts are granted, denied,
dismissed or ignored, over the total number of prompts seen.
We compute numerous metrics, all of which together indicate
users are not interested in the vast majority of notification
prompts. The horizontal axes of Figure 3a and 3b show the
percentile of clients that have a grant/deny/ignore/dismiss rate
which is smaller or equal to the corresponding value on the
vertical axes. They show that 80% of desktop clients and 70%
of Android clients who ever saw a notification prompt during
the 10-day period never granted it. Our first key observation
is that most users do not grant the notification permissions
at all. We also observe that most desktop users (55%) ignore
or dismiss a prompt at least once. This indicates that most
desktop users tend not to make a “permanent” decision which
is remembered for subsequent visits to the same website.
The per-client average rates for desktop are: grant 12%,
deny 15%, dismiss 37% and ignore 36%. For mobile, they
are 23%, 54%, 19% and 3%. Our next key observation is that
for both desktop and mobile, the deny and dismiss rates are
greater than the grant rates, sometimes significantly so. We
observe that on Android, the client behavior is quite different
than desktop. The grant rate is almost double that of desktop
clients, while the average deny rate is nearly 4 times that
of desktop clients. Similarly the dismiss and ignore rates
are much lower on mobile devices than desktops. While we
believe that the blocking nature of the permission prompt on
the Android platform has a significant influence, the telemetry
data does not allow us to isolate its effect from others, such as
the inherently different website designs and types of content
that is consumed on a mobile platform as opposed to desktop.
Figure 3b shows that only 36% of Android clients never
denied a permission request, meaning that 64% of clients
denied it at least once. A third observation is that the majority
of clients elect to deny at some point.
USENIX Association 30th USENIX Security Symposium 773

(a) Average grant, deny, ignore and dismiss
rates on desktop.
(b) Average grant, deny, ignore and rates on
Android.
(c) Number of prompts seen and decisions
made.
Figure 3: Number of prompts seen and interaction rates with the legacy prompt, by percentile of clients.
Finally, Figure 3c shows the number of permission prompts
seen and decisions made by client percentile. Desktop clients
tend to see more prompts but they also tend to report fewer
interaction with them. For instance, while 19% of desktop
clients never clicked on a prompt, this was the case for only
3% of mobile clients. Moreover, although there are 59% of
desktop clients who have seen 2 or more prompts, only 39%
have interacted with them. On the contrary, almost all mo-
bile clients who see a prompt tend to interact with it as well.
This already points out the fact that notification permission
prompts, when abused, are more interrupting on mobile de-
vices than on desktop, and we therefore aim to significantly
reduce unwanted interruptions especially on Chrome with the
new quiet UI described in Section 4.
Taken together, all of these observations clearly indicate
that users are either not engaging with notifications much
overall, and when they do, they rarely grant them. It appears
that most of the time, they see little benefit in receiving notifi-
cations.
3.3.2 URL origins
In addition to analysing the interactions with the permission
prompt from the clients’ point of view, hereafter we character-
ize such interactions from the websites’ perspective. This is
important because it takes into account the large differences
in the types of websites on which the permission prompt is
shown, and it is therefore crucial to understand how the cur-
rent behavior and the redesigned UI affects websites with
different characteristics.
When looking at the types of actions performed on the
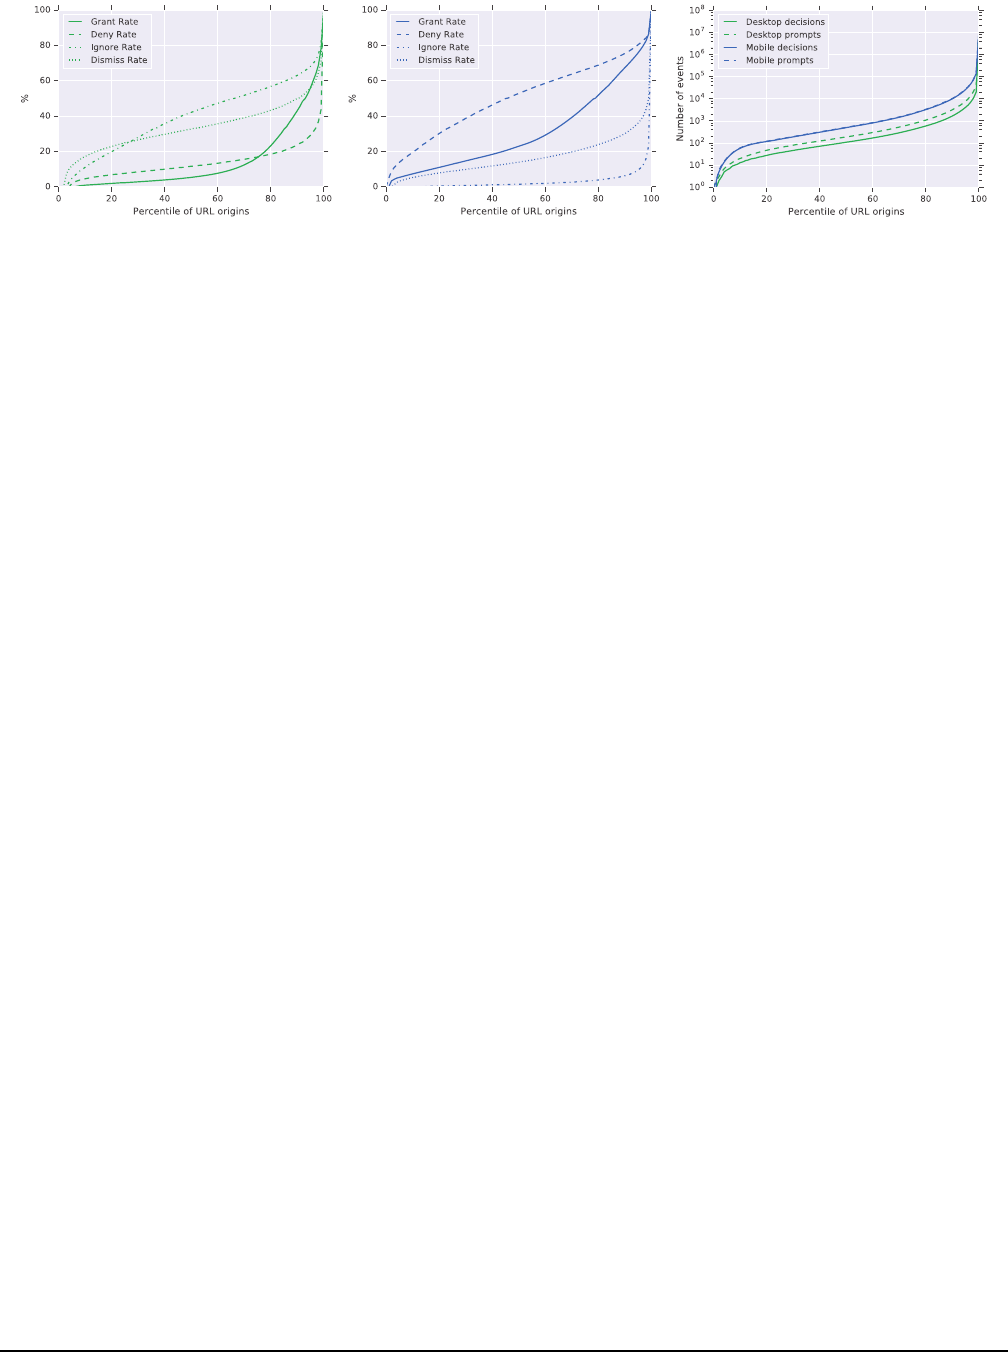
permission prompts, Figure 4a shows that on desktop there
are 76% of websites where the deny rate is higher than the
grant rate, both under 17%. Ignore and dismiss rates are much
higher overall, although their relative ranking changes: dis-
miss rates are higher than ignore rates for 26% of websites,
and they are lower for the remaining 74% of them. It is inter-
esting to note that there is less than 1% of websites with a deny
rate higher than 50%, whereas there are 8% of websites with a
grant rate higher than 50%. This indicates that there are more
than 8 times (in percentage terms) the number of websites that
most users feel comfortable in receiving notifications from,
as compared to websites where most users definitely do not
see any benefit and therefore block notifications.
On mobile, the behavior is very different. Figure 4b shows
that 56% of websites have a deny rate higher than 50%, which
is a 58x increase as compared to desktop, whereas 22% have a
grant rate higher than 50% (less than 3x the number for desk-
top). Clearly, when faced with a “blocking” action, mobile
users tend to deny the prompt overwhelmingly more often
than they tend to grant it. This is a clear signal that the “block-
ing” notification permission prompts are unwanted, and they
are interrupting the browsing experience for mobile users
much more than desktop ones. Hence, our strategy to address
such unwanted interruptions has to revisit the “blocking” na-
ture of the mobile prompt as well. As the ignore and dismiss
actions on mobile require an additional interaction with the
device – by either going to the previously visited website,
closing the tab or exiting the browsing session – they are
seldom recorded in large quantity; indeed, less than 1% of
websites have ignore or dismiss rates greater than 50% for
mobile clients.
Finally, Figure 4c shows the number of prompts seen and
decisions made by percentile of websites. First, similarly to
Figure 3c, we see that the number of decisions is practically
the same as the number of prompts seen on the Android plat-
form, whereas on desktop there is a higher number of prompts
seen but not acted upon. Second, we also notice that the no-
tification prompt volume seems to follow the power law dis-
tribution – which is used to model the number of visits to
websites ( [1, 9]) – where 20% of websites in our dataset
showed less than 100 prompts, whereas much less than 1%
showed more than 10 million prompts. The per-URL median
number of decisions was 188 on desktop and 513 on Android.
Having observed how clients interact with the legacy noti-
fication permission prompt across websites, in the following
section we present our revised UI for notification permission
prompts on Chrome, and the new activation logic for clients
774 30th USENIX Security Symposium USENIX Association
(a) Average grant, deny, ignore and dismiss
rates on desktop.
(b) Average grant, deny, ignore and dismiss
rates on Android.
(c) Number of prompts seen and decisions
made.
Figure 4: Number of prompts seen and interaction rates with the legacy prompt, by percentile of the URL origins.
and websites.
4 Reducing the Interruptiveness of Notifica-
tion Permission Prompts
Although notifications are an important tool for websites to
send timely updates to their visitors, most users seem not to
want them. Partially, we believe this is also a result of web-
sites that see notification prompts as an unchecked means to
drive engagement, which is not in the spirit of the web noti-
fications API. Indeed, Chrome telemetry showed that most
users choose not to grant notification permission prompts, on
most of the websites. Ideally, a genuine website that provides
a high quality notification experience would have a high grant
rate, which is the opposite of what out telemetry shows today.
Moreover, negative comments about the notification experi-
ence are also one of the most frequent complaints seen in
Chrome’s product feedback channels. We therefore want to
improve the browsing experience for Chrome users by reduc-
ing the interruptiveness of unwanted notification permission
prompts.
In order to achieve that goal, we focused our efforts on the
following objectives, which resulted from several discussions
among product leads, engineering teams, designers and user-
experience researchers:
1.
Making the notifications permission prompt UI less inter-
ruptive.
2.
Reducing the number of notification permission prompts
that users have to act upon, which reduces the cognitive
load and permission fatigue.
3.
Providing an easy and more obvious escape hatch if users
want to change their choice after they have made it.
The telemetry data we analyse in this study allows us to
measure the progress towards the objectives (1) and (2) above,
but not objective (3). The latter requires additional qualitative
measures and instrumentation that the current telemetry data
does not have. Hence, a separate user study will be conducted
in order to assess the progress towards achieving objective (3).
To measure whether the new quiet UI (described hereafter)
performs better than the legacy one with respect to the two
goals, we rely on two proxy signals discussed in Section 3.3:
the deny and ignore rates of the permission prompts. Ideally,
the new UI should significantly increase the ignore rate and
lower the deny rate – unwanted prompts should no longer
require users to act on them – while preserving the grant rates
for users who do want them. These users should still be able
to easily grant the permission prompt.
To make the prompts less interrupting and to reduce the
frequency of unwanted interactions, we introduce three new
components:
(i)
The quiet permission prompt UI that Chrome users see
when a website wants to show notifications.
(ii)
The mechanism to activate the quiet UI on websites
with a high average deny rate, which incentivizes a re-
sponsible use of the API according to the best practices.
(iii)
The mechanism to activate the quiet UI for users who
repeatedly block them, based either on their past behav-
ior or opt-in setting.
4.1 New UI for the notification permission
prompt
Since its introduction in 2015, the volume of notification
permission requests has surpassed that of any other type of
permission. Hence, it is also the most likely to annoy users if
shown out of context or without an explicit user intent. Over
the years, we have identified several other limitations of the
legacy UI for the notification permission prompt. First, even
when displayed in context, users might not fully understand
what content they will see in notifications. Second, similarly
to any web permission on Chrome, users might not under-
stand that the two options “Allow” and “Block” are reused for
every subsequent visit to the same website. Therefore, when
uncertain, users are likely to ignore or dismiss on desktop,
and might end up selecting an unintended or unwanted choice
on Android just to make the prompt disappear and get to the
website. Third, in case users want to change a previous choice,
USENIX Association 30th USENIX Security Symposium 775

(a) Variant 1: Heads-up notification.
(b) Variant 2: Icon.
(c) Variant 3: Info-bar.
Figure 5: Tested notification permission prompt UI variants for the Android platform.
(a) Variant 1: Animated
icon.
(b) Variant 2: Static
icon.
Figure 6: Tested notification permission prompt UI variants
for the desktop platform.
they have to find the right Chrome settings, or click on the
page information dialog in the navigation bar, which is not an
obvious entry point.
In determining the UI experiment variants, we chose to use
the pre-existing messaging UI patterns in Chrome, in order to
enable returning users to apply the interaction methods they
are already familiar with. From the enumerated UI candidates,
we eliminated the ones that were visually too loud, such as
a prompt that covers a large content area or is completely
hidden. The choice was also guided by the intent to provide
less interruptive UIs that could still provide a more obvious
entry point to change a previous choice. Finally, we chose the
three design variants on Android (Figure 5) and two on desk-
top (Figure 6). The experimental UI variants displayed the
“strike-through bell” icon to convey unavailability of notifica-
tions. Additionally, when there was enough screen real estate,
the words “notifications blocked” were added to reinforce the
meaning. This representation intended to respond to the two
major statuses the user could be in. First, if the user did not
want to receive notifications from the site, this representation
confirms the desired state and the user does not need to take
any action on the UI. Second, if the user wanted to receive
notifications from the site, the represented status was clearly
opposite, which could lead the user to act upon it to change it.
We implemented each of those variants and activated them
as part of a controlled experiment on a 1% random sample
of clients running the Beta version of Chrome 78, during a
7-day period in September 2019. Specifically, we selected
1% of Android clients for each of the three variants and an
additional 1% for the control group that saw the standard
legacy UI. Each of the clients only saw the UI variant which
they were assigned, during the entire experiment. In total,
3% of Android clients running the Beta version saw the ex-
perimental UIs. Similarly, we enabled the experimental UIs
for 2% of desktop clients, 1% for each of the two desktop
variants, and a 1% the control group (2% of desktop clients
saw the experimental UIs).
To decide which variant to release to all Chrome users,
we monitored and compared the grant rates from the experi-
mental groups with the control groups. Overall, the drop was
significant across all variants on both platforms. Specifically,
on Android we saw that the grant rate for variant 1 (Figure 5a)
dropped by 81% compared to the control group, for variant
2 (Figure 5b) by 98% and for variant 3 (Figure 5c) by 89%.
On desktop, the grant rate dropped by 79% for variant 1 (Fig-
ure 6a) and by 93% for variant 2 (Figure 6b), as compared to
the control group.
In light of those results, we chose the mini info-bar (variant
3) for the Android platform and the animated icon (variant
1) for desktop. Although variant 3 on Android has a slightly
lower grant rate compared to variant 1, we deemed the latter
to be sub-optimal because, as a system heads-up notification,
it would not be visible at all for users who have completely
disabled notifications for Chrome at the app-level, which is
likely to generate confusion.
4.2 Automated activation for websites with a
low grant rate
As we have observed, the quiet UI undoubtedly leads fewer
clients to re-engage with websites. As it is important that
the improved user experience does not disproportionately
affect the web ecosystem, it is crucial that the quiet UI can be
enabled selectively for users and websites. In particular, we
want to enable it for users who are unlikely to want to receive
notifications at all, and for websites that have a very high
average deny rate (such as 90%). Hereafter we describe how
Chrome chooses those websites and how users can activate
776 30th USENIX Security Symposium USENIX Association

the quiet either manually or adaptively.
The analysis we conducted in Section 3.3 has shown that,
fortunately, only 1%-2% of websites with a non-negligible
user base in our dataset have such a high (standard) deny rate,
although this is the case for more than 5% of websites if we
consider the explicit deny rate (i.e., if only counting grants
or denies). This signal can be interpreted as strong evidence
that users not only do not see much benefit in receiving no-
tifications, but they explicitly want to block them from ever
asking again. In order to prevent those interrupting websites
to send unwanted notification requests to the vast majority of
their visitors, Chrome displays the quiet UI every time a user
visits those websites, unless the user has created an exception
for it in the browser’s settings. When any such website wants
to show the notification prompt, the user sees the quiet UI
with an accompanying message that informs her that most
people block notifications from that site. The user can still
choose to enable notifications by clicking on the “bell” icon
and subsequently on “Allow for this site”.
Using telemetry from the Chrome users
1
, we maintain two
lists of interrupting websites on the Google systems, one for
the desktop clients and one for the Android ones. We keep
two separate lists because the data indicates that there is
only a 14% overlap between interrupting websites reported
by desktop and Android clients. We add a website to the
corresponding desktop or Android platform list if it satisfies
the following criteria:
1.
Has displayed at least 1000 notification permission
prompts, as reported by the Chrome clients, over the last
28 days on a given platform (desktop or Android). Fur-
thermore, we exclude data from clients who revert their
decision for a website too frequently, as those could also
come from test account or devices. Specifically, we discard
data from devices that report more than 3 grant or deny
decisions for the same website and platform during the
study period. This ensures that (i) there is enough evidence
that most clients do not see a value in getting notifications
from the website, (ii) the website is reasonably popular
so that it has an incentive in providing value to the users
through notifications, and (iii) the size of the interrupt-
ing sites list is small enough to be sent by using the Safe
Browsing APIs (as described later). As many as 95% of
all reported notification prompts come from websites and
clients that pass this criterion.
2.
Has a high-enough explicit deny rate (> 49%) and a high-
enough relative rank (
≥
95th percentile) with respect to
explicit deny rate as compared to other websites. We de-
fine the explicit deny rate as the ratio between the sum of
deny decisions over the sum of deny or grant decisions
only. This is different from the standard deny rate that
we show in the charts, where the denominator includes
1
Only from the set of users who have opted in to provide crash reports
and usage statistics to Google, who are signed-in with their Google account
and have the “sync” functionality enabled.
grants, denies, ignores and dismissals. The reason we use
the explicit deny rate for generating the interrupting web-
sites lists is that we want to get as much explicit signal of
unwanted or interrupting prompts as possible. As grants
and denies are choices that are remembered for successive
visits to the same website, we believe that they also con-
vey the highest amount of information about unwanted or
interrupting prompts. Second, by having two conditions
on the explicit deny rate (i.e., rank and absolute value), we
ensure that websites have a strong incentive to continu-
ously improve their standing with respect to others, and
that they are not unnecessarily penalized in case the whole
ecosystem moves towards a state in which the average
explicit deny rate drops significantly.
3.
Is satisfying the previous condition continuously over a
certain number of successive iterations. For instance, if
we recompute the list of interrupting sites every day, we
may add a website to it only if its average explicit deny
rate and rank are consistently above the threshold over
multiple successive iterations (e.g., during 28 successive
runs). This would help to avoid adding a website and then
removing it too frequently in case it is near the threshold.
With these very conservative initial thresholds, the interrupt-
ing website lists contains around 500 entries for the desktop
and 2000 for the Android platform. In total, these websites
typically surface 1% of all reported notification prompts on
Android and 3% on desktop, which means that there is a mar-
gin to relax the threshold in the future. Users can see whether
the website they are currently visiting is on the interrupting
list by checking if there is a related message on the Chrome de-
veloper console. As we continuously monitors the product
feedback channels for any user and website complaints due
to these changes, we intend to relax these thresholds in the
future in the absence of any significant negative feedback.
To limit the risks related to data manipulation by malicious
clients, in addition to the other conditions for data inclusion
that we already described in Section 3.2, we adopt additional
security measures to limit the number of records that could
come from test accounts or devices, the specifics of which are
not public.
After a website has been added to the interrupting list,
it clearly has an incentive to get off as quickly as possi-
ble, which usually happens after it starts to follow the best
practices guidelines when showing notification prompts. For
that, we need to be able to track its explicit deny rate on the
legacy prompt. Therefore, Chrome shows the quiet prompt
for a random sample of 70% of the clients that see the prompt
on that website, while showing the legacy prompt to the re-
maining 30%. We then keep monitoring the explicit deny rate
from the latter 30% of clients, and when any of the above
criteria is not consistently met over a certain period of time
(e.g., 28 days), we remove the interrupting website from the
list. We chose to use a threshold of 30% as holdback as it
would allow us to get at least 300 decisions on which to test
USENIX Association 30th USENIX Security Symposium 777

whether the criteria are satisfied. This would ensure a maxi-
mum error rate on the true statistic of at most
±
5% with a
95% confidence level, even for the website with the lowest
amount of decisions in our dataset. Moreover, using a limited
time window (e.g., 28 days) limits the effects of inter-day
spurious variations that might be due to specific events that
are not necessarily representative of the users’ behavior on a
site over a longer period of time.
For performance reasons, we use the Safe Browsing API
– which is already in place to protect users from malicious
websites – to regularly send a compressed version of that list
to each Chrome client, as prefix sets [20]. Then, every time a
website wants to display the notification permission prompt,
the client first checks whether the website is present on the
local prefix list of interrupting websites. If so, Chrome then
verifies with the Safe Browsing service whether the website
is indeed in the most recent version of the list. If and only if
that is the case, it displays the quiet UI. This is the default
way that Safe Browsing enforcement works in Chrome.
4.3 Activation Mechanisms on Clients
Having described the quiet UI and how we maintain the two
lists of interrupting websites, we now outline the client-side
changes that were introduced to support the redesigned per-
mission prompt and the interrupting website lists.
In order to reduce the unwanted interruptions to the brows-
ing experience, Chrome provides two ways for users to enable
the quiet notification prompts, which are purely based on be-
havioral data that can be observed on the client, without any
interaction with the Google’s backend services:
1.
A toggle in the Chrome settings page, which enables
the quiet UI for all notification prompts, irrespective of
whether the website is on the interrupting list. This gives
users the choice to enable or disable the quiet prompts
whenever they wish.
2.
Automatic activation after three consecutive “deny” deci-
sions are recorded for a client on any website over the last
28 days. This reduces the unwanted interruptions for users
who are very unlikely to want to receive any notifications
at all. The telemetry shows that this applies to 28% of
Android clients and 14% of desktop ones.
The choice of the last parameter – the number of consecutive
denies before the quiet UI is automatically activated on the
client – was made after a careful analysis of the impact it
would have on clients and websites. We chose to use three
because our data showed that it would help a substantial frac-
tion of users who are more likely to be interrupted, while not
interfering with users who do not see many prompts in the
first place.
In addition to these two activation mechanisms, we are
further exploring the use of machine learning methods that
can leverage a larger number of on-device signals, in order to
show the quiet UI in more instances where clients are unlikely
Parameter Exp. 1 Exp. 2
Browser version 78 80
Channel Beta Stable
Experiment start 09/2019 02/2020
Experiment duration 7 days 10 days
Nr. of participants ≥300 M ≥40 M
Nr. of websites ≥70 K ≥70 K
Nr. of actions ≥800 M ≥100 M
Table 1: Experimental parameters.
to grant the notification permission.
4.4 Second Experiment
When designing the above mechanisms that enable the
quiet prompts, we could mostly think of their effects in iso-
lation with respect to each other. Taken independently, they
should be able to help users to have a less interrupting brows-
ing experience, to reduce the number of required interactions
and to allow them to revert to the legacy UI more easily should
they change their mind. However, it is difficult to evaluate the
combined effect of these changes on the interaction metrics
that we want to influence. That is why we conducted a second
large-scale study on a subset of Chrome clients running the
stable release of the browser, which is the default one that
normal users install and use.
We conducted a 10-day A/B experiment between the 7th
and the 16th of March, 2020. We selected a random sample
of 9% of desktop and 9% of Android clients running the sta-
ble release of Chrome version 80 as the experiment groups,
for which we enabled both the client activation logics of the
quiet prompts (Section 4.3) and the one based on the interrupt-
ing website lists (Section 4.2). Similarly, we selected another
set of 9% of clients on each platform as the control groups,
for which we disabled the quiet prompt feature completely.
In other words, the clients in the control group could only see
the legacy prompt. The data for this experiment is subject to
the same conditions as described in Section 3.2.
4.5 Results
More than 40 million clients participated in the experiment,
half of which were assigned to the control group and half to
the experiment group on each platform. We recorded more
than 100 million actions overall, coming from more than
70 thousand websites.
2
Table 1 summarizes the parameters
of the two large-scale experiments that we conducted. As
shown in Figure 7a and 7b, there is a very similar distribution
2
Thanks to the extremely large number of samples in our experiments, we
omit adding any statistical tests of the differences between the decision rates
we report for the control and experiment groups, such as the Mann Whitney
U Test. Even an extremely small difference, such as
10
−6
, is statistically
significant at the p <.05 level.
778 30th USENIX Security Symposium USENIX Association

(a) By client percentile and experiment group.
Percentile of URL origins
(b) By percentile of URL origin and experiment group.
Figure 7: Number of notification permission prompts seen, by percentile of clients, URL origins and experiment group.
(a) Grant rate. (b) Deny rate. (c) Ignore rate.
Figure 8: Comparison between the control and experiment groups of the grant, deny and ignore rates across client percentiles.
of prompts seen across the experimental and control groups,
across both clients and websites. This indicates that the con-
trol and experiment groups should be comparable in terms of
the browsing behavior and volume of prompts observed.
Next, we look at the actions that clients of both groups
took on the prompts. The first key observation is that there is
only a very small reduction of the grant rate in the experiment
groups, as compared to the control groups. This is a positive
result, as it indicates that the quiet prompt and activation logic
did not significantly affect the grant rates for websites on
both platforms. The per-client average grant rates are 10%
and 9.8% on desktop for the control and experiment groups,
respectively, whereas they are 20.1% and 19.1% on Android,
respectively. Similarly, we did not observe any significant
change in the grant rate percentiles across websites either
(Figure 8a), with a per-website average grant rate of 13.6%
and 13.1% on desktop for the control and experiment groups,
respectively, and 29.8% and 27.1% on Android, respectively.
On the contrary, the deny rate distributions shifted signifi-
cantly in the experiment group compared to the control group,
as expected, in particular on Android. Figure 8b shows that
there are 39% more clients in the experiment group that have
never denied any prompt, as compared to the control group.
This means that the quiet prompt has removed at least one
unnecessary prompt for 15% more Android clients already
during the initial 10-day period that the feature was active.
The per-client average deny rate was 31.4% lower in the exper-
iment group relative to the control group (38.5% vs. 56.1%).
On desktop, the reduction of 17.5% in deny rate was smaller
(from 14.5% to 11.5%) but significant nevertheless. We ob-
served a similar trend also when looking at the per-website
average deny rates (Figure 9b), where the experiment groups
on both desktop and Android were reporting reduced deny
rates across all types of websites. We observed a reduction of
the per-website average deny rate of 22.5% on Android (31%
vs 51.6% in the experiment and control groups, respectively)
and on 30% on desktop (9.8% vs 14% in the experiment and
control groups, respectively).
As for the ignore rates, they increased in the experiment
groups across both clients (Figure 8c) and websites (Fig-
ure 9c), and in particular on Android. The per-client average
ignore rate jumped by a factor of 5 from 4% (control) to 20%
(experiment) on Android, and from 39.6% to 44.4% on desk-
top, respectively. Across websites, the per-website average
USENIX Association 30th USENIX Security Symposium 779

(a) Grant rate. (b) Deny rate. (c) Ignore rate.
Figure 9: Comparison between the control and experiment groups of the grant, deny and ignore rates across percentiles of URL
origins.
ignore rate also increased more than 7 times on Android (from
3% in the control group to 22.7% in the experiment group)
and from 39.8% to 46.2% on desktop. The increase in the
ignore rate on Android is particularly important because it
suggests that many of the clients who would choose to deny
a permission request opted instead to ignore it, as the grant
rates are only minimally affected.
Compared to the experiment for the choice of the quiet UI
described in Section 4.1, the drop in deny rates and increase
in ignore rates are smaller in this experiment. We believe that
such differences are mainly due to the different user base that
was sampled (Beta channel vs. Stable) in the two experiments.
Users in the Beta channel willingly use a non-final version
of Chrome that is used for experimenting with new features,
which could suggest that users of the Beta version might have
a different browsing behavior than the users of the standard
Stable version.
Given the results of the experiment, we can conclude that
the quiet UI and its activation mechanisms are very effective
in achieving the two main goals: The increased ignore rates,
the reduced deny rates and the marginally affected grant rates
signal that the the browsing experience of Chrome users can
be improved without negatively affecting the benefits for the
websites and users who show a clear benefit of the web noti-
fications API. We plan to roll out the quiet UI feature to all
of the Chrome clients in the coming months, as we monitor
feedback from both users and website owners. We did not
observe any significant changes in reports from users due to
the quiet UI so far (September 2020).
4.6 Releasing the Notification Action Rates to
the Public
To complement our quiet UI efforts with an increase level of
transparency for both end-users as well as website owners,
Chrome includes the average grant, deny, dismiss and ignore
rates as part of the Chrome User Experience Report [18].
This publicly accessible website enables visitors to obtain
aggregated URL-level metrics about loading performance
from opted-in users. By making this information public, we
hope to provide a positive incentive for website owners to
continuously improve their notification rates in order to meet
the users’ expectations. Moreover, this also makes it easier
for medium and high-traffic websites to check the reported
rates without requiring them to implement any additional data
collection and processing on their properties.
5 Discussion & Limitations
Web push notifications can be a very useful feature for users
to receive timely updates about information they care about,
such as breaking news, instant messages or tweets. When
asking for permission to send notifications, websites should
follow a set of best practices, in order to ensure that users
are asked for them within the right context and at the right
time. For instance, websites should give visitors some time to
allow them to understand the context of the page they are on,
and they should wait for a signal of explicit intent to receive
notifications before showing them the permission prompt.
However, our telemetry indicates that 90% of the time web-
sites fail to successfully enroll their visitors to notifications
on desktop, and 79% of the time on Android. In other words,
the vast majority of Chrome users do not see enough value
in receiving notifications from the websites they visit, which
means that notification prompts are most often unnecessar-
ily interrupting their browsing experience. That is why we
redesigned and rethought the process by which users interact
with the notification permission prompt.
In Section 4, we described the main goals of the redesign
of the notification prompt, which are to (i) make the prompt
UI less interruptive, (ii) reduce the number of interactions
that users have with them and (iii) make it easier to change
the previous choice. In this study, which is focused on the
former two objectives, we are able to show that the redesigned
permission prompt is very successful in reducing both the
“interruptiveness” of the UI and the number of interactions
that users have to make.
780 30th USENIX Security Symposium USENIX Association

When running such a large-scale behavioral study with
real users, we understand that it is extremely important to
account for the vast diversity of both users and websites that
are accessible on the Internet. It is therefore crucial to assess
the effect our redesign has on the entire population of users
and websites. That is why, in addition to providing statistics
about the average reduction in unwanted interaction rates (i.e.,
deny and dismiss actions), we show the more fine-grained
results that cover each percentile of both users and websites.
The fact that the positive effects – a minor reduction in grant
rates compared to a double-digit reduction in deny rate and
large increase in ignore rates – are consistent across all per-
centiles of both populations is extremely important. It shows
that all sorts of users – those who interact with many different
websites as well as those who seldom ever see a notification
prompt – benefit from a more interruption-free browsing ex-
perience. Moreover, it shows that those users who want to
be engaged with the websites through notifications are only
slightly impacted. Furthermore, we expect the already mi-
nor reduction in grant rates to become even smaller, as more
users and sites learn and adapt to the new permission prompt
UI
3
. As it is extremely challenging to determine the necessity
and context of notification prompts in general, Chrome has
opted for a phased roll-out of the feature. Microsoft Edge –
a Chromium-based browser, has adopted a different roll-out
approach [40]; since the quiet UI code was publicly released
in February 2020, Edge elected to leverage this and enabled
it by default to all of its users and websites.
Designing a solution that effectively balances the needs of
web users who are unlikely to want to get notifications, of
those that do seem to want them and of the many websites
who rely on them for increased engagement and higher ser-
vice utility [16] is challenging. We showed that it is possible
to achieve that by bringing together the following elements:
user behavior data, website metrics, proxy metrics, a new UI,
and an incentive mechanism for website owners to get off the
block list. The quiet UI in Chrome takes a first step towards
improving the user experience, which results in a small drop
in grant rates for websites. By introducing activation mecha-
nisms that depend on each user’s past actions, users who often
see unwanted notification permission prompts will also be the
first ones to benefit from the quiet UI. As the quiet feature
activates automatically only for users who denied the prompt
at least 3 times in a row, it clearly benefits the more active
users who see more prompts than the average user. This was
a design choice, as users who see and deny the prompt more
often are also the ones who are more like to experience unnec-
essary interruptions. As more and more users will eventually
transition to the quiet UI, websites will have a strong incentive
to rethink the way they use the Notifications API and to align
3
For instance, at the time of this experiment, several popular websites
(such as twitter.com) guide their users on how to enable notifications on the
web by assuming that users would see only the legacy prompt, instead of
possibly also seeing the less visible quiet UI.
it with the best practices, which ultimately will improve the
browsing experience for all users.
We also acknowledge several limitations of our experimen-
tal design and the data collection process, which are inherent
to the nature of the methodology itself. The data we analysed
in this study comes from a random subset of Chrome users, but
not from a “fully” random set. As mentioned in Section 3.2
and 4, we collect and analyse telemetry only from users who
satisfy certain conditions, in order to respect their privacy
choices and preferences. We acknowledge that, although such
a population represents a double digit fraction of the overall
Chrome user base, we might miss on some of the notification
interactions that might have occurred on less popular websites
from users who do not satisfy the criteria for inclusion in our
study. However, we made various efforts to limit the impact
of spurious or extremely long-tail behavior on our results. For
instance, we accept data only from genuine clients that report
a limited number of samples for each website, and we only
consider websites with at least 1000 decisions reported in the
study period. According to the telemetry, those websites ac-
count for more than 95% of all reported notification prompts,
and therefore they should provide an accurate view of the
web push notifications landscape. Moreover, our study did
not include qualitative user feedback, which might surface
additional issues and user preferences.
Finally, although this study focused on notification per-
mission prompts in Chrome, we hope its implications will
spur research into further permission types and goals, such as
time-limited and more granular web permissions, and a more
fine-grained measurement of cognitive load and disaffection.
More broadly, our multiple activation mechanisms that blend
both the user’s own behavior with those of other users have
shown one possible way to quickly and effectively limit the
unwanted interruptions for users who, at least initially, are
likely to suffer the most from them. One challenge that re-
mains when designing such solutions is to identify who those
users are and to actually assess whether the issues that experts
have identified are indeed the most pressing ones for the users.
Several studies of a related problem – computer security prac-
tices and advice of security experts vs. non-experts [8, 23, 38]
– seem to suggest that they might not always be the same.
As a note, the experiment was conducted during the first
half of March, 2020, and lasted 10 days. In China and South
Korea, this was at the time when the peak of the COVID-
19 pandemic had already passed or was flattening. However,
it was growing in several other countries in Europe (Italy,
France, Germany, Switzerland) and to some extent in other
parts of the world [33]. Therefore, we cannot exclude nor
quantify the effect that this extraordinary situation had on our
results.
USENIX Association 30th USENIX Security Symposium 781

6 Conclusion
Other researchers and web browser developers have observed
that notification prompts for web pages are a source of annoy-
ance for users and that users rarely agree to receive notifica-
tions. Our first contribution was to assess this on a very large
scale. We conducted analysis that included more than 300 mil-
lion users, 70 thousands websites and 800 million actions on
the prompts. Chrome telemetry indicated that the notifica-
tion permission is the most frequently asked for permission
type (74% of all permission requests are for notifications),
and yet with a grant rate of 10% on desktop and 21% on
Android, respectively, it is also the least likely to be granted.
The frequent requests, coupled with low grant rates on both
mobile and desktop, as well as high ignore and dismiss rates
on desktop, indicate altogether that notification permissions
are interrupting and that mostly they do not lead to a useful
experience. This motivated us to rethink how users interact
with notification prompts. At the same time, our study showed
that 20% of users on desktop, and 30% of Android users, do
grant the permission at least once. Thus for users who do
want to enable notifications, it is important not make it more
difficult for them to do so.
Our second contribution was thus to take on the challenge
of rethinking the conditions as to when and how users interact
with the notification prompts. This required us to balance the
dual goals of reducing interruptiveness for the large majority
of users, while having negligible impact on users who do want
to receive notifications. In this paper, we presented our the
process and challenges that led to the redesign of the UI and
the creation of a novel activation logic.
Our first analysis study also revealed that there are fun-
damental differences across desktop and Android platforms,
partially due to the fact that on desktop the prompt can be
ignored whereas on mobile it requires an interaction in or-
der to continue browsing the website. Therefore our redesign
made it possible for Android users to also ignore the prompt
with a new UI that does not block the content of the website,
while allowing interested users to easily enable notifications.
To support users who want notifications, the quiet UI is still
visible on both platforms, albeit in a less conspicuous way.
Our third contribution was a second large-scale study,
wherein we evaluated whether the redesigned prompt is suc-
cessful at reducing unwanted interruptions while limiting the
negative effect on the grant rates across users and websites.
Our A/B test with 40 millions users and 100 million actions
on the prompts has shown that the new quiet UI, together
with its activation logic on clients and the crowd-sourced list
of interrupting websites, is very effective in reducing the un-
wanted interruptions while only slightly affecting the grant
rates across users and websites. Specifically, the deny rate de-
creased by 22.5% on desktop and by 30% on Android, while
the average grant rate decreased by 3.7% and 5%, respectively.
As the legacy UI is particularly interrupting on Android, we
were pleased to see that the ignore rate jumped by a factor of
7. Thanks to the positive results obtained in our experiments,
we intend to roll out the quiet UI feature to all clients in the
next few months, while we monitor the feedback from users
and website owners.
Although our quantitative experiments have shown that
the new UI is very effective in achieving the goals we set,
they were not instrumented to capture more qualitative data
about users’ attitudes and understanding of the new UI. For
that reason, we intend to conduct a separate user study to
evaluate whether indeed the quiet UI is easy to use, find and
understand via the iconography, setting discoverability, and
activation mechanisms.
7 Acknowledgements
We would like to express our sincere gratitude to Adrienne
Porter Felt, Stephan Micklitz, Ji Chen, Noelle Kvasnosky
Luiten, Scott Monroe Westover, the anonymous reviewers
and our shepherd for helping us to improve the quality of this
paper.
References
[1]
Lada A Adamic and Bernardo A Huberman. Zipf’s law
and the internet. Glottometrics, 3(1):143–150, 2002.
[2]
Airship. New urban airship study reveals app publishers
that don’t message users waste 95 percent of their
acquisition spend.
https://www.airship.com/
company/press-releases/new-urban-airship-
mobile-app-retention-study/, 2017.
[3]
Efthimios Alepis. Notify this: Exploiting android notifi-
cations for fun and profit. In International Conference
on Information Systems Security and Privacy, pages
86–108. Springer, 2018.
[4]
Apple. Safari 12.1 Release Notes | Apple Developer
Documentation.
https://developer.apple.com/
documentation/safari_release_notes/safari_
12_1_release_notes, 2019.
[5]
Pieter Arntz. Browser push notifications: a feature ask-
ing to be abused.
https://blog.malwarebytes.com/
security-world/technology/2019/01/browser-
push-notifications-feature-asking-abused/
,
2019.
[6]
Namraata Badheka. The history of push notifi-
cations.
https://medium.com/the-pushcrew-
journal/the-history-of-push-notifications-
43343bdf2d85, 2017.
782 30th USENIX Security Symposium USENIX Association

[7]
Brian P Bailey and Joseph A Konstan. On the need for
attention-aware systems: Measuring effects of interrup-
tion on task performance, error rate, and affective state.
Computers in human behavior, 22(4):685–708, 2006.
[8]
Karoline Busse, Julia Schäfer, and Matthew Smith.
Replication: no one can hack my mind revisiting a study
on expert and non-expert security practices and advice.
In Fifteenth Symposium on Usable Privacy and Security,
SOUPS, 2019.
[9]
Carlos R Cunha, Azer Bestavros, and Mark E Crovella.
Characteristics of www client-based traces. Technical re-
port, Boston University Computer Science Department,
1995.
[10]
Apple Developer. Notifications - Apple Developer.
https://developer.apple.com/notifications/
,
2020.
[11]
Android Developers Documentation. Notifications
Overview.
https://developer.android.com/
guide/topics/ui/notifiers/notifications
,
2020.
[12]
Balazs Engedy. Issue 900997: abuse tech-
nique: redirect to re-prompt for notifications.
https://bugs.chromium.org/p/chromium/
issues/detail?id=900997, 2019.
[13]
Adrienne Porter Felt, Serge Egelman, Matthew Finifter,
Devdatta Akhawe, David A Wagner, et al. How to ask
for permission. HotSec, 12:7–7, 2012.
[14]
Joel E Fischer, Chris Greenhalgh, and Steve Benford.
Investigating episodes of mobile phone activity as in-
dicators of opportune moments to deliver notifications.
In Proceedings of the 13th international conference on
human computer interaction with mobile devices and
services, pages 181–190, 2011.
[15]
Andrew Gazdecki. What is a push notification? and why
should you care?
https://www.biznessapps.com/
blog/what-is-a-push-notification/, 2017.
[16]
George Deglin – One Signal Podcast. The
Importance of Good Notifications.
https:
//onesignal.com/podcasts/the-importance-
of-good-notifications-w-pj-mclachlan, 2020.
[17]
Lauren Goode. A brief history of smartphone notifi-
cations.
https://www.wired.com/story/history-
of-notifications/, 2019.
[18]
Google. Chrome User Experience Report.
https:
//developers.google.com/web/tools/chrome-
user-experience-report#notification_
permissions, 2020.
[19]
Google. Google Chrome Privacy Whitepaper.
https://www.google.com/chrome/privacy/
whitepaper.html, 2020.
[20]
Google. Safe Browsing Update API (v4).
https://developers.google.com/safe-
browsing/v4/update-api, 2020.
[21]
Johann Hofmann. Reducing Notification Permis-
sion Prompt Spam in Firefox.
https://blog.
nightly.mozilla.org/2019/04/01/reducing-
notification-permission-prompt-spam-in-
firefox, 2019.
[22]
Gary Illyes, Henner Zeller, Lizzi Harvey, and Martijn
Koster. Robots exclusion protocol.
https://tools.
ietf.org/html/draft-koster-rep-00, 2019.
[23]
Iulia Ion, Rob Reeder, and Sunny Consolvo. “... no one
can hack my mind”: Comparing expert and non-expert
security practices. In Eleventh Symposium On Usable
Privacy and Security , SOUPS, pages 327–346, 2015.
[24]
Jiyeon Lee, Hayeon Kim, Junghwan Park, Insik Shin,
and Sooel Son. Pride and prejudice in progressive web
apps: Abusing native app-like features in web applica-
tions. In Proceedings of the 2018 ACM SIGSAC Confer-
ence on Computer and Communications Security, CCS,
pages 1731–1746. ACM, 2018.
[25]
Daniel C McFarlane and Kara A Latorella. The
scope and importance of human interruption in human-
computer interaction design. Human-Computer Interac-
tion, 17(1):1–61, 2002.
[26]
PJ McLachlan. Introducing quieter permission ui for no-
tifications.
https://blog.chromium.org/2020/01/
introducing-quieter-permission-ui-for.html
,
2020.
[27]
Abhinav Mehrotra, Mirco Musolesi, Robert Hendley,
and Veljko Pejovic. Designing content-driven intelli-
gent notification mechanisms for mobile applications.
In Proceedings of the 2015 ACM International Joint
Conference on Pervasive and Ubiquitous Computing,
UbiComp ’15, pages 813–824. ACM, 2015.
[28]
Abhinav Mehrotra, Veljko Pejovic, Jo Vermeulen,
Robert Hendley, and Mirco Musolesi. My phone and
me: Understanding people’s receptivity to mobile notifi-
cations. In Proceedings of the 2016 CHI Conference on
Human Factors in Computing Systems, CHI ’16, pages
1021–1032. ACM, 2016.
[29]
Tomas Meskauskas. Browser Push Notifications:
Useful Feature Exploited by Deceptive Marketers.
https://securityboulevard.com/2019/08/
browser-push-notifications-useful-feature-
exploited-by-deceptive-marketers/, 2019.
USENIX Association 30th USENIX Security Symposium 783

[30]
Microsoft. Change notification settings in Win-
dows 10.
https://support.microsoft.com/en-
us/help/4028678/windows-10-change-
notification-settings, 2020.
[31]
Mozilla. Restricting Notification Permission
Prompts in Firefox.
https://blog.mozilla.
org/futurereleases/2019/11/04/restricting-
notification-permission-prompts-in-firefox
,
2019.
[32]
Tadashi Okoshi, Julian Ramos, Hiroki Nozaki, Jin
Nakazawa, Anind K. Dey, and Hideyuki Tokuda. Re-
ducing users’ perceived mental effort due to interrup-
tive notifications in multi-device mobile environments.
In Proceedings of the 2015 ACM International Joint
Conference on Pervasive and Ubiquitous Computing,
UbiComp ’15, pages 475–486. ACM, 2015.
[33]
Our World in Data. COVID-19: Daily
new confirmed cases, rolling 7-day average.
https://ourworldindata.org/grapher/daily-
covid-cases-7-day, 2020.
[34]
push notifications permissions ux.
https:
//docs.google.com/document/d/1WNPIS_
2F0eyDm5SS2E6LZ_75tk6XtBSnR1xNjWJ_DPE, 2015.
[35]
Constantinos Patsakis and Efthimios Alepis. Knock-
knock: The unbearable lightness of android notifications.
arXiv:1801.08225 [cs], 2018.
[36]
Veljko Pejovic and Mirco Musolesi. InterruptMe: de-
signing intelligent prompting mechanisms for pervasive
applications. In Proceedings of the 2014 ACM Interna-
tional Joint Conference on Pervasive and Ubiquitous
Computing, UbiComp ’14, pages 897–908. ACM, 2014.
[37]
Martin Pielot, Amalia Vradi, and Souneil Park. Dis-
missed! a detailed exploration of how mobile phone
users handle push notifications. In Proceedings of the
20th International Conference on Human-Computer In-
teraction with Mobile Devices and Services, pages 1–11,
2018.
[38]
Elissa M Redmiles, Noel Warford, Amritha Jayanti,
Aravind Koneru, Sean Kross, Miraida Morales, Rock
Stevens, and Michelle L Mazurek. A comprehensive
quality evaluation of security and privacy advice on the
web. In 29th USENIX Security Symposium, pages 89–
108, 2020.
[39]
Internet World Stats. World Internet Users Statis-
tics and 2020 World Population Stats.
https://www.
internetworldstats.com/stats.htm, 2020.
[40]
Microsoft Edge Team. Reducing distractions with quiet
notification requests.
https://blogs.windows.com/
msedgedev/2020/07/23/reducing-distractions-
quiet-notification-requests, 2020.
[41]
Phani Vadrevu and Roberto Perdisci. What you see
is NOT what you get: Discovering and tracking social
engineering attack campaigns. In Proceedings of the
Internet Measurement Conference, IMC ’19, pages 308–
321. ACM, 2019.
[42]
Anne van Kesteren and Johann Hofmann. Up-
coming notification permission changes in Firefox
72 – Mozilla Hacks - the Web developer blog.
https://hacks.mozilla.org/2019/11/upcoming-
notification-permission-changes-in-firefox-
72, 2019.
[43]
W3C. Web Notifications.
https://www.w3.org/TR/
notifications/, 2015.
[44]
MDN web docs. Introduction to web APIs - Learn web
development | MDN.
https://developer.mozilla.
org/en-US/docs/Learn/JavaScript/Client-
side_web_APIs/Introduction, 2020.
[45]
MDN web docs. Notifications API - Web APIs |
MDN.
https://developer.mozilla.org/en-US/
docs/Web/API/Notifications_API, 2020.
[46]
MDN web docs. Web Push API Notifications best prac-
tices.
https://developer.mozilla.org/en-US/
docs/Web/API/Push_API/Best_Practices, 2020.
[47]
Xu and Sencun Zhu. Abusing notification services on
smartphones for phishing and spamming. In Presented
as part of the 6th USENIX Workshop on Offensive Tech-
nologies, 2012.
784 30th USENIX Security Symposium USENIX Association
