
HSMAI SPECIAL REPORT
Hotel Management
Company
Sales Incentive Plans
Produced in partnership with

HMC Sales Incentive Plans HSMAI SPECIAL REPORT
Table of Contents
02 Introduction
03 Why are incentives so important?
04 Framework for sales incentive plan design
05 Incentives overview
06 Sales compensation design
07 Metrics
08 Plan types
09 Payout curves
12 ZS POV
13 State of incentives in hotel management companies
14 Our participants
15 Hotel management company incentive plan summary
21 Appendix
22 Director of sales incentive plan summary
24 Sales manager incentive plan summary

2
HMC Sales Incentive Plans HSMAI SPECIAL REPORT
By Robert A. Gilbert, CHME, CHBA, President and CEO,
Hospitality Sales & Marketing Association International (HSMAI)
A
t a time when everything about hospitality sales is changing, the potential for
incentive plans to recognize and motivate sales professionals has never been more
important. But what makes for an effective, impactful incentive program?
HSMAI has partnered with ZS Associates on an original study that addresses this very
question for hotel management companies (HMCs). This report — made possible with the
support of HSMAI Organizational Member companies — presents the results of our study.
Drawing on data that ZS collected from 39 HMCs, the report begins with a general outline
of the five guiding principles and three defining traits of a good sales incentive plan as well
as the advantages and disadvantages of different types of plans. Then we share key findings
from the HMCs that ZS surveyed, including the predominant structure, performance
metrics, maximum payouts, and payout frequency of their incentive plans for both
directors of sales and sales managers.
You’ll also find information about the HMCs that generously contributed data to this
study, which we hope is a valuable resource for your organization as you design an
incentive plan that empowers and elevates your sales professionals.
Hospitality Sales & Marketing
Association International (HSMAI)
is the hospitality industry’s leading
advocate for intelligent, sustainable hotel
revenue growth. HSMAI provides hotel
professionals and their partners with tools,
insights, and expertise to fuel sales, inspire
marketing, and optimize revenue through
programs such as HSMAI’s Revenue
Optimization Conference, Digital Marketing
Strategy Conference, Sales Leader
Forum, and Adrian Awards. HSMAI oers
organizational and individual membership,
with more than 7,000 members in four
global regions — the Americas, Asia Pacific,
Europe, and the Middle East. — hsmai.org
ZS is a professional services firm that works
side by side with companies to help develop
and deliver products that drive customer
value and company results. — zs.com
ABOUT HSMAI
ABOUT ZS
introduction

3
HMC Sales Incentive Plans HSMAI SPECIAL REPORT
Why are incentives
so important?
Three entities are impacted by the incentive plan:
Company
Customer
Sales Force
Sales force drives
the top-line
Output is typically
measurable
Need to
acknowledge success
Lack of supervision
why are incentives so important?

4
HMC Sales Incentive Plans HSMAI SPECIAL REPORT
Framework for
sales incentive
plan design
5
HMC Sales Incentive Plans HSMAI SPECIAL REPORT
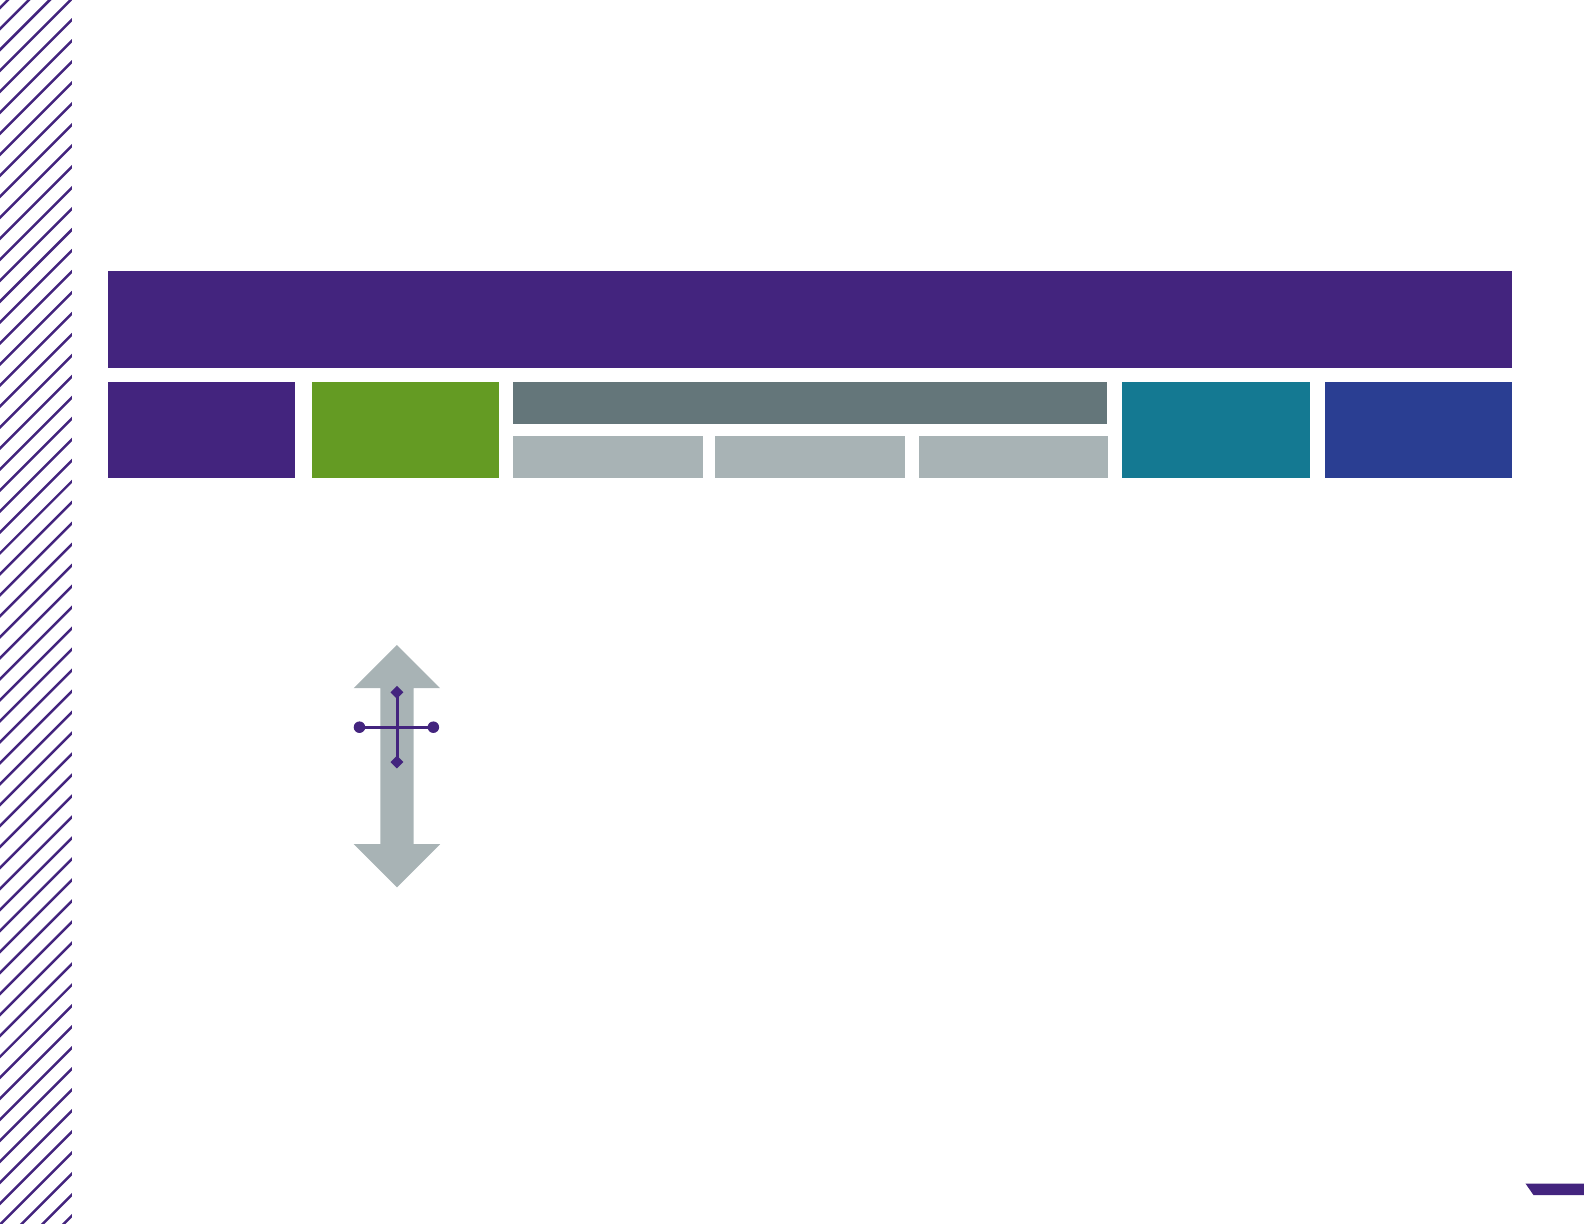
Incentives Overview
We need to look at the entire sales compensation spectrum
when thinking about a sales compensation program
Compensation Guiding Principles
Strategic | Motivational | Simple | Fair | Fiscally Responsible
Eligibility
Metrics Methods Mechanics
Plan Period
Additional
Elements
Pay Level & Mix
Plan Design
What are
the criteria
for a role to
receive sales
compensation?
ɠ Customer
contact
ɠ Financial
influence
What level of
base and
variable pay is
appropriate?
What should be
the measuring
metric for each
of the identified
components?
ɠ $ sales
ɠ Unit sales
ɠ Orders
ɠ Gross
margin
What plan type
to choose from?
ɠ Commission
ɠ Goal based
ɠ Forced
ranking
ɠ Matrix
ɠ MBOs
ɠ Combination
What will the
payout curve
look like?
ɠ Threshold
ɠ Slopes
ɠ Accelerators
ɠ Kickers
ɠ Caps
How long is the
plan period?
What is the
payout
frequency?
ɠ Monthly
ɠ Quarterly
ɠ Semi-
annually
ɠ Annually
ɠ SPIFs/
contests
ɠ Recognition
program
ɠ Long-term
incentives
$200K
$50K
100%
salary
100%
incentive

6
HMC Sales Incentive Plans HSMAI SPECIAL REPORT
Guiding Principles: A good incentive plan
is strategic, motivational, fair, simple,
and fiscally responsible
Why do so many companies
have diiculties designing
their IC plans?
Sales Compensation Design
Answer: There are tensions
between the guiding principles.
Simple
Controllable
Motivational
Fair
Measurable
Financially
responsible
ɠ Supports sales and marketing objectives
ɠ Focuses on the “right” activities and customers
ɠ Proper emphasis / focus on key products
ɠ Flexible to account for changes in environment
ɠ Sellers with dierent conditions have similar
earning potential
ɠ Does not penalize sellers for forecasting uncertainties
ɠ Simple to understand and communicate to the sales force
ɠ Can be implemented given IC infrastructure/resources
ɠ Total payout is within acceptable range of budget
ɠ Total payout varies appropriately according
to company success
ɠ Substantial eort leads to significant reward
ɠ Keeps most people engaged
ɠ Focus on what matters to salespeople
Aligned with strategy
Motivational
Fair
Simple
Fiscally responsible

7
HMC Sales Incentive Plans HSMAI SPECIAL REPORT
There are many decisions that can
be made with regard to metrics,
and each has an impact on
representative behavior.
Measurement
Level
Point of Comparison
ɠ Revenue
ɠ RevPAR
ɠ Room nights
ɠ Bookings
ɠ Person/territory
ɠ Property
ɠ Account (above property)
ɠ Other team
ɠ Relative to goal
ɠ Change over time (percent, value)
Ideally, sales incentive plan metrics should
be strategic, controllable, and measurable
Metrics
Strategic
Controllable
Measurable
ɠ Supports key strategic goals
ɠ Critical to the business
ɠ Mostly within the control of the salesperson
ɠ Visibility of the link between behavior
and reward
ɠ Metric can be measured at the appropriate
level
ɠ Systems are able to track and report
on the metric
Dimensions
Requiring a Decision
Sales incentive plans should
be limited to 3 metrics, each
weighted at least 20%
3
KEY TAKEAWAY

8
HMC Sales Incentive Plans HSMAI SPECIAL REPORT
Plan Types
Each incentive plan type has relative advantages and disadvantages;
each is appropriate in certain circumstances
Commission Plan Relative Plan Goal Based PlanMatrix Plan MBO Plan
ɠ New products
ɠ Hunters
ɠ Territory potential
must be balanced
ɠ Minimizes
forecasting issues
ɠ Can cause
unhealthy
competition
ɠ Uncommon
ɠ Territory potential
considered
ɠ Requires accurate
national forecast
ɠ Prevalent for AMs
ɠ Used to balance
competing priorities
ɠ Complex
ɠ Uncommon
ɠ Can be subjective
ɠ Little pay
dierentiation
ɠ Administrative
burden
ɠ May not require
sales data
PAY
% OF
SALES
Goal Attainment
Pay
Objective 1 25%
Objective 2 15%
Objective 3 35%
Objective 4 25%
------------------------
Total 100%
HSMAI
© 2019 ZS | CONFIDENTIAL
− 9−
Each incentive plan type has relative advantages and disadvantages;
each is appropriate in certain circumstances
Plan Types
Objective 1 25%
Objective 2 15%
Objective 3 35%
Objective 4 25%
------------------------
Total 100%
Pay 5%
of sales
Goal Attainment
Pay
§ Minimizes
forecasting
issues
§ Can cause
unhealthy
competition
§ Uncommon
§ Used to balance
competing
priorities
§ Complex
§ Uncommon
§ Territory
potential
considered
§ Requires
accurate
national
forecast
§ Prevalent for
AMs
§ New products
§ Hunters
§ Territory
potential must
be balanced
§ Can be
subjective
§ Little pay
differentiation
§ Administrative
burden
§ May not require
sales data
Commission
Plan
Relative
Plan
Matrix
Plan
Goal Based
Plan
MBO
Plan

9
HMC Sales Incentive Plans HSMAI SPECIAL REPORT
-7
-4
-2
-13
-17
Payout Curves
Laggards
Bottom 20% Top 20%
Stars
Middle 60%
Core Performers
-10
Percent reduction in revenue seen, by segment, when no overachievement commission rates were present
Percent reduction in revenue seen, by segment, when no quarterly bonuses were present
Research suggests
more frequent
performance period
evaluation drives
higher sales,
particularly for low
performers
Research suggests
that overachievement
commission rates are
critical in driving top
performers
SOURCE: HARVARD BUSINESS REVIEW, JULYAUGUST
What does the research say about payouts?

10
HMC Sales Incentive Plans HSMAI SPECIAL REPORT
Payout Curves
Caps reduce the motivation of your top performers
Improvement in revenue
after caps were removed
from the plan
9%
RESEARCH SETTING
Data were collated from the sales
organization of a large U.S. contact
lens manufacturer
KEY TAKEAWAY
Payout curves can be designed such that the right amount of money is paid to the right population
GUIDING PRINCIPLE OBJECTIVE METRIC REP BENCHMARK
MANAGER
BENCHMARK
Motivating
Engagement rate Percent receiving payout 90-100% 100%
Meaningful engagement rate Percent paid at least 75% of target $ payout 60-80% 60-80%
Pays for performance;
Fiscally responsible
Median % of target payout Percent of target payout received at the median 100% 100%
Average % of target payout Percent of target payout received on average 100-110% 100-110%
Excellence to target ratio Top 10% $ payout vs. target 200-300% 150-200%
Bottom performer vs. target ratio Bottom 10% payout vs. target 10-30% 30-50%
0%
50%
100%
150%
200%
250%
300%
100%0% 200%
% of Target Paid
% of Quota Attained
Uncapped
Capped

11
HMC Sales Incentive Plans HSMAI SPECIAL REPORT
0% 50%25% 100% 125%75% 150% 175%
200%
0%
50%
100%
150%
200%
250%
300%
Payout Curves
An optimal payout curve considers performance in four payout zones
Too many salespeople below threshold can result in:
ɠ Loss of motivation / morale
ɠ Account managers holding back sales until next pay period
ɠ Loss of confidence in sales management
ɠ Note: A high threshold suggests very strong forecasting ability
Too many in the windfall zone can result in:
ɠ Overpayment
ɠ Culture of entitlement
ɠ Low incentive to drive sales (reduced slope)
ɠ Account managers holding back sales until next pay period
Underperformers
Receive no payout
Good performers
Increased payout for
increased sales
Overachiever
Accelerated payout rate
for increased sales
Windfall possibility
Payout may be due
to windfall conditions rather
than performance
Percent of Target Payout
Attainment
Payout
Threshold
Decelerator
Point
Target
Payout
Attainment
Distribution

12
HMC Sales Incentive Plans HSMAI SPECIAL REPORT
ZS POV
Based on our experience, eective quota-setting processes
include a variety of common characteristics
Territory Opportunity Rigorous Methodology Manager Refinement
ɠ Territory potential must
be incorporated
ɠ Can include multiple metrics
related to accounts or geographic
elements
ɠ Typical metrics include account
characteristics and population
demographics
ɠ Accuracy is tested using
historical simulations to check for
correlations to actual sales results
ɠ Fairness is evaluated by
grouping territories with similar
characteristics and observing
any historical biases
ɠ Local knowledge helps refine
quotas to reflect on-the-ground
reality and increases buy-in of
sales managers
ɠ Reasonable limits on the degree
of change should be imposed,
as well as a rigorous process
HSMAI
© 2019 ZS | CONFIDENTIAL
− 16 −
Based on our experience, effective quota-setting processes include a
variety of common characteristics…
ZS POV
§ Territory potential must
be incorporated
§ Can include multiple metrics
related to accounts or
geographic elements
§ Typical metrics include
account characteristics and
population demographics
§ Accuracy is tested using
historical simulations to
check for correlations to
actual sales results
§ Fairness is evaluated by
grouping territories with
similar characteristics and
observing any historical
biases
§ Local knowledge helps refine
quotas to reflect on-the-
ground reality and increases
buy-in of sales managers
§ Reasonable limits on the
degree of change should be
imposed, as well as a
rigorous process
Territory Opportunity Rigorous Methodology Manager Refinement
20
60
100
140
160
Low Medium High
PREVIOUS-YEAR GROWTH
% GOAL ATTAINMENT CURRENT YEAR
40
80
120
20
60
100
140
160
Low Medium High
PREVIOUS-YEAR GROWTH
% GOAL ATTAINMENT CURRENT YEAR
40
80
120
20
60
100
140
160
Low Medium High
PREVIOUS-YEAR GROWTH
% GOAL ATTAINMENT CURRENT YEAR
40
80
120

13
HMC Sales Incentive Plans HSMAI SPECIAL REPORT
State of incentives
in hotel management
companies

14
HMC Sales Incentive Plans HSMAI SPECIAL REPORT
ɠ AMResorts
ɠ Atlific Hotels
ɠ Atrium Hospitality
ɠ Benchmark Global Hospitality
ɠ Charlestowne Hotels
ɠ Commonwealth Hotels
ɠ Crescent Hotels and Resorts
ɠ Donohoe Hospitality Services
ɠ Dow Hotel Company
ɠ Genuine Hospitality
ɠ GF Management
ɠ Growth Properties
Hospitality Management
ɠ HHM Hospitality
ɠ HVMG - Hospitality Ventures
Management Group
ɠ Hostmark
ɠ HVS Hotel Management
ɠ Interstate Hotels
ɠ Kessler Collection
ɠ Lodging Hospitality Management
ɠ M&R Hotel Management
ɠ Marcus Hotels & Resorts
ɠ NCG - North Central Group
ɠ Newport Hospitality Group
ɠ OTO Development
ɠ Outrigger Enterprises Group
ɠ Pacifica Hotels
ɠ Prism Hotels
ɠ Regency Hotel Management
ɠ Remington Hotels
ɠ Sage Hotels
ɠ Salamander Hotels
ɠ Shaner Hotel Group
ɠ Sound Hospitality Management
ɠ StayPineapple
ɠ Two Roads/CoralTree Hospitality
ɠ White Lodging
ɠ Widewaters Hotels
ɠ Windsor Capital Group
(WCG Hotels)
ɠ Wright Investments
our Participants
We collected incentive
plans from 39 hotel
management companies
15
HMC Sales Incentive Plans HSMAI SPECIAL REPORT
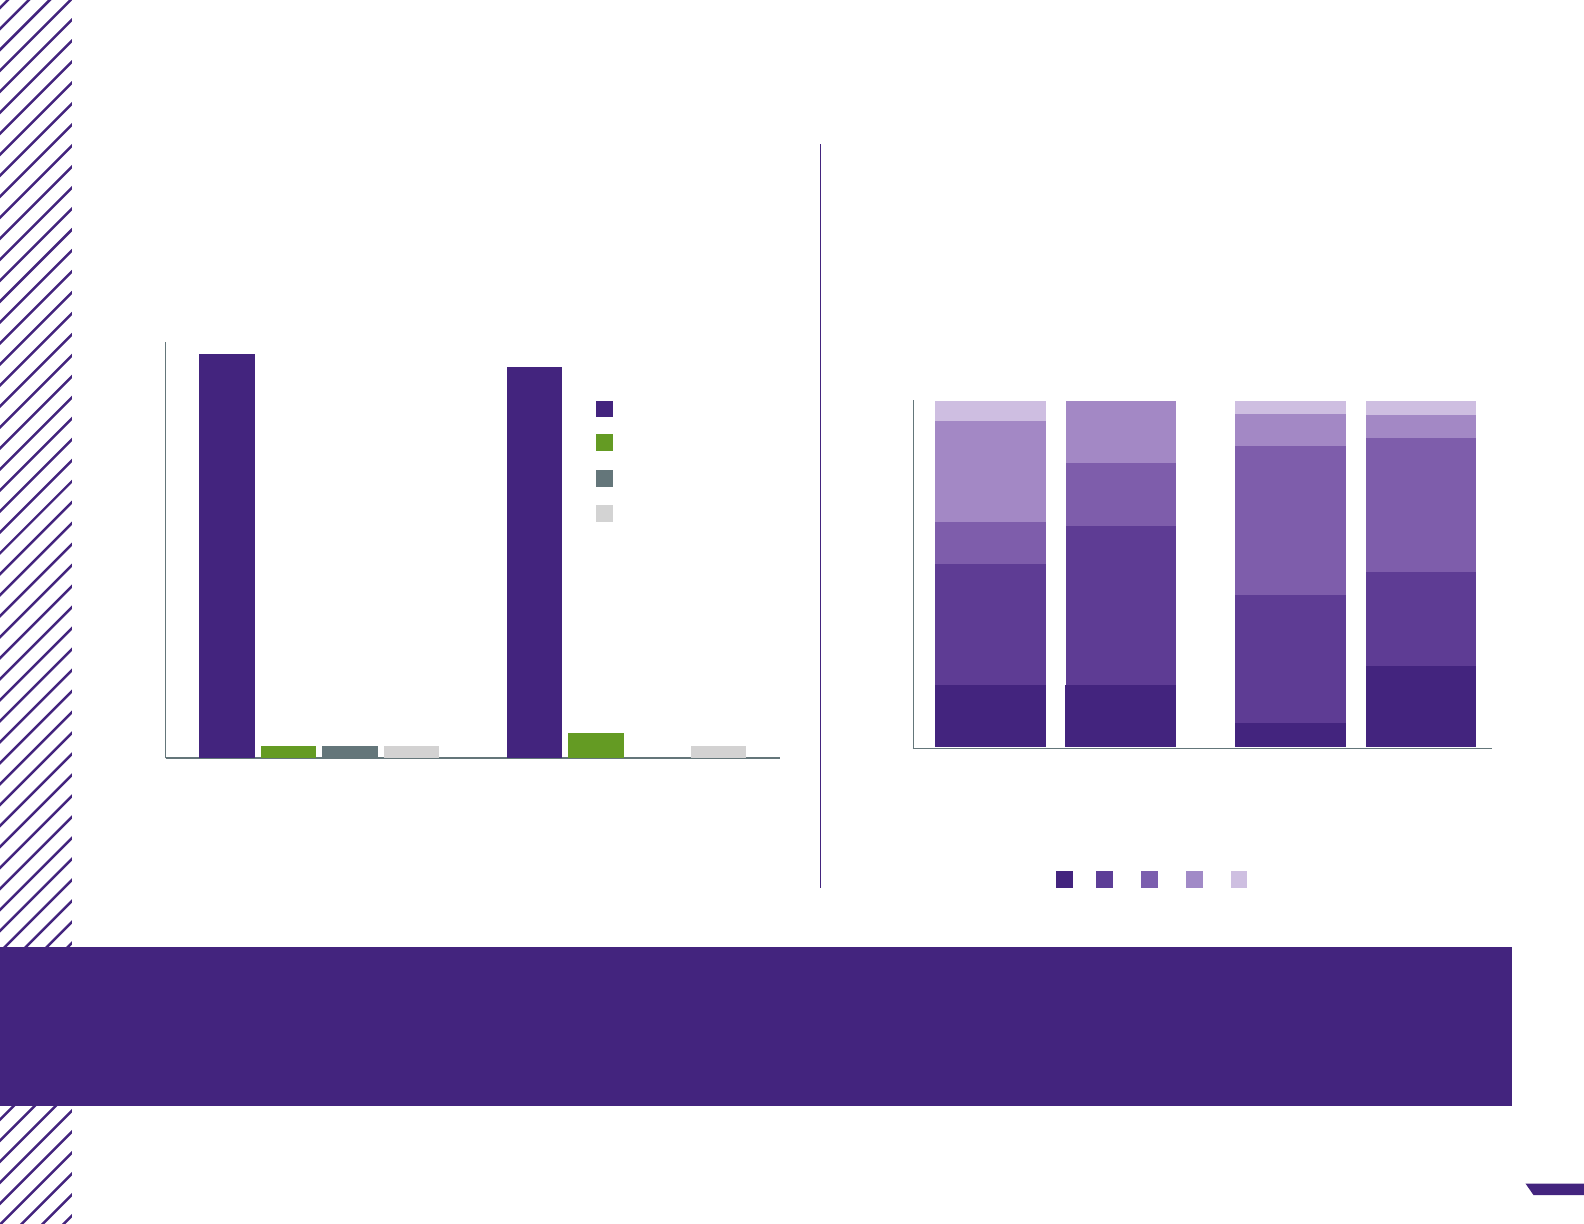
Some “Other” responses include Market Share, House Profit, STR & Revenue Based, Overall Hotel Performance, GOP, Shop Evaluation, Customer Service Scores, and Communications.
0%
100%
0%
100%
Hotel management companies use goal-based plans as
the dominant compensation structure
Hotel companies are simplifying
their plans by carrying fewer metrics
Hotel Management Company Incentive Plan Summary
Incentive Compensation Structure
Number of Performance Metrics
Used in Compensation Plan
97%
6%
4% 4%
29%
12%
35%
18%
18%
18%
9%
7%
40%
27%
23%
7%
43%
37%
18%
45%
94%
3%
Goal based
1
MBO
2
Commission
3
Other*
4 5+
3% 3% 3%
6%
Percentage of Respondents
Number of Metrics Used
to Evaluate Incentive Amount
Director of Sales
HSMAI management
company sample
(N=35)
Sales Manager
HSMAI management
company sample
(N=33)
Previous Study Today’s Sample
Director
of Sales
(n=17)
Director
of Sales
(n=35)
Sales
Manager
(n=12)
Sales
Manager
(n=33)
As compared to our previous study, the majority of companies
build their incentive compensation plans using 3 or fewer metrics

16
HMC Sales Incentive Plans HSMAI SPECIAL REPORT
0%
100%
* “Primary” metrics have the highest weight of all performance metrics that contribute to determining the total target incentive payout amount; sample metrics are listed in order of popularity.
Revenue is the primary metric for
both DOS and Sales Managers
Hotel Management Company Incentive Plan Summary
Primary* Performance Metric Used to Determine Incentive Compensation
Revenue: Total Hotel Contribution Revenue: Individual Contribution RevPAR
Percentage of Respondents
Director of Sales (N=35)
Primary Metric
Sales Manager (N=33)
Primary Metric
Management
companies are
mostly aligned with
metrics: hotel/team
revenue for DOS and
individual revenue
for managers, with
differences tied to
budget, targets, and
consumption
Sample
Metrics
Sample
Metrics
23%
81%
11% 12%
66%
8%
RevPAR
ɠ RevPAR Index
ɠ RevPAR vs. Budget
ɠ RevPAR Index YOY
ɠ RevPAR Index vs.
Budget
ɠ Budgeted RevPAR
Penetration
ɠ RevPAR Rank
Revenue: Total
Hotel Contribution
ɠ Total Hotel
Revenue vs. Budget
ɠ Room Revenue vs.
Budget
ɠ Team Consumed
Revenue
ɠ Team Consumed
Rev. vs. Budget
ɠ Team Bookings vs.
Budget
Revenue: Individual
Contribution
ɠ Individual Bookings
vs. Target
ɠ Individual
Consumed
Revenue vs. Target
ɠ Individual
Consumed Reve-
nue vs. Budget
ɠ Individual Revenue
vs. Budget
ɠ Individual Revenue
Consumption vs.
Budget
Sales Managers have metrics
based on individual contributions
far more often than DOS.
17
HMC Sales Incentive Plans HSMAI SPECIAL REPORT
0%
100%
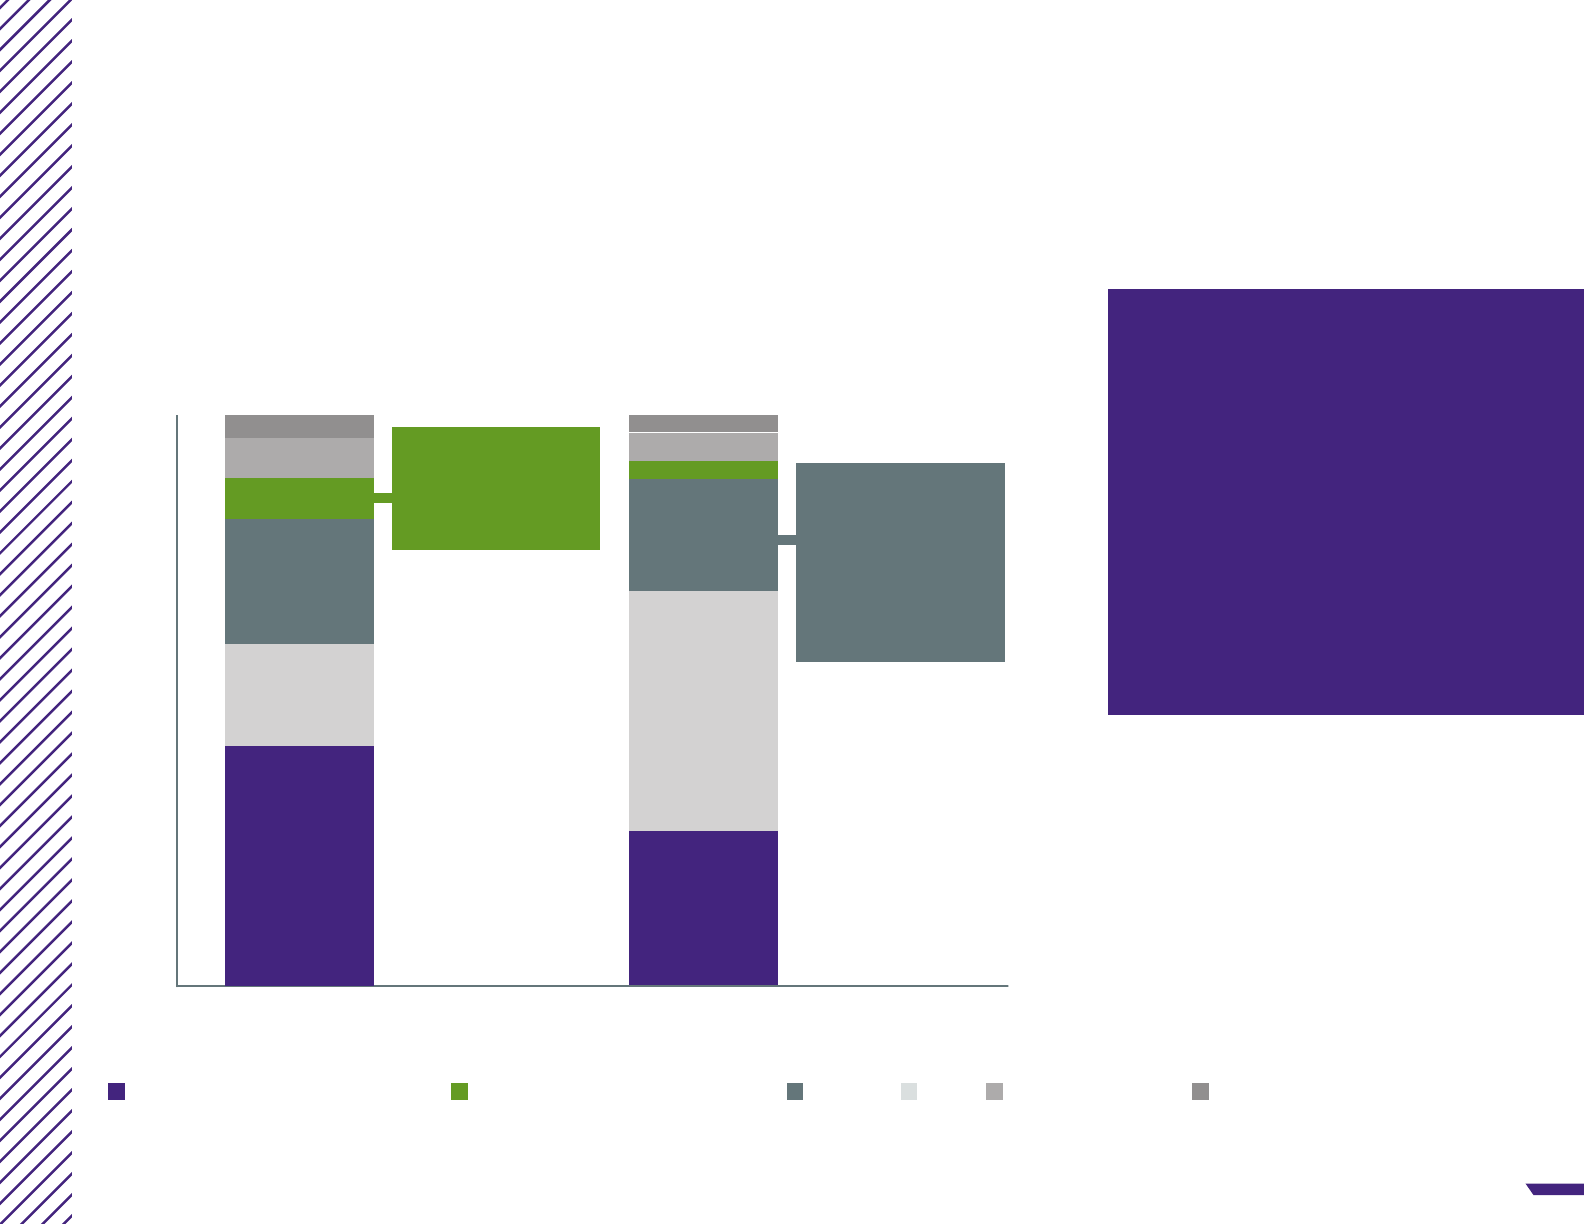
Hotel Management Company Incentive Plan Summary
Some plans also place a lower weight on Gross Overall Profit
and Guest Satisfaction metrics to determine incentive pay
All Performance Metrics Used to Determine Incentive Compensation
Sample Metrics are listed in order of popularity.
Revenue: Total Hotel Contribution Revenue: Individual Contribution RevPAR GOP OtherGuest Satisfaction
% Weight in the Sales Comp Plan
Director of Sales (n=35)
All Metrics
Sales Manager (n=33)
All Metrics
Usage of RevPAR
as performance
metric has remained
constant across
the companies as
compared to the
previous study
Sample
Metrics
Sample
Metrics
18%
22%
7%
7%
4%
42%
19%
5%
3%
3%
42%
27%
Gross Overall Profit
ɠ Gross Overall Profit
ɠ Gross Overall
Profit - Budget
Guest Satisfaction
ɠ Guest Satisfaction
Score
ɠ Guest & Associate
Satisfaction
ɠ Brand Guest
Service Score

18
HMC Sales Incentive Plans HSMAI SPECIAL REPORT
0%
60%
Hotel Management Company Incentive Plan Summary
The majority of plans we collected were capped, and the max payouts
for Sales Manager and DOS have converged at 30% of base
Maximum Incentive Payout (Percentage of Base Salary)
Maximum Payout (Percentage of Base Salary)
Director of Sales
(n=25)
Sales Manager
(n=26)
High performers
for Sales Managers
averaged 28% in
a previous study,
slightly lower than
today’s sample
50%
10%
30%30%
50%
10%
Maximum
Minimum
Average
28% typical
max payout from
previous study
35% typical
max payout
from previous
study
88% 84%
% of Plans That
Have Pay Caps

19
HMC Sales Incentive Plans HSMAI SPECIAL REPORT
60%
80%
100%
120%
140%
160%
180%
200%
220%
Hotel Management Company Incentive Plan Summary
Ranges for minimum and maximum goal attainment to determine incentive
pay vary by company; most sit between 95% and 125% attainment
Companies C – O award a fraction of their incentive
pay if they achieve close to 100% of their goal
Companies P – W award incentive pay
only if they achieve 100% of their goal
Percent Goal Attainment Required for Minimum and Maximum Incentive Pay
Percent of Target Payout
All Companies Using Thresholds and Caps (n=23)
Minimum thresholds for DOS and Sales Managers averaged
98% in a previous study, similar to our current sample
22% currently have
max payout of 100%
35% currently have 100%
as minimum threshold
Range 30%
A
100%
70%
30%
C
120%
90%
30%
I
130%
95%
35%
J
125%
95%
15%
K
115%
95%
10%
D
100%
90%
10%
T
115%
100%
15%
U
110%
100%
15%
V
108%
100%
20%
B
100%
80%
20%
E
111%
91%
20%
G
200%
95%
23%
N
120%
98%
25%
Q
125%
100%
25%
S
115%
100%
21%
R
121%
100%
2%
O
100%
98%
8%
P
125%
100%
8%
W
108%
100%
45%
H
140%
95%
5%
F
200%
95%
105%
L
110%
95%
105%
M
100%
95%
Maximum Payout
(Higher performance will
not increase pay)
Minimum Payout
(Lower performance will
result in no incentive pay)

20
HMC Sales Incentive Plans HSMAI SPECIAL REPORT
0%
100%
*The Performance Period and Incentive Payout Frequency are the same for each company in our sample.
Hotel management companies most commonly pay out
incentives quarterly to both DOS and Sales Managers
Hotel Management Company Incentive Plan Summary
Frequency of Performance Period and Incentive Payout*
Quarterly and Annually Annually Quarterly
Director of Sales
(N=31)
Sales Manager
(N=30)
The distribution of
performance period and
payout frequency is roughly
the same as those reported
in a previous study
23%
21%
9%
68%
79%
For companies that pay quarterly and annually:
Quarterly payments tend to be based on revenue metrics such as RevPAR; annual payments tend to be based on GOP or guest satisfaction metrics.

21
HMC Sales Incentive Plans HSMAI SPECIAL REPORT
Appendix:
Plan component details
22
HMC Sales Incentive Plans HSMAI SPECIAL REPORT
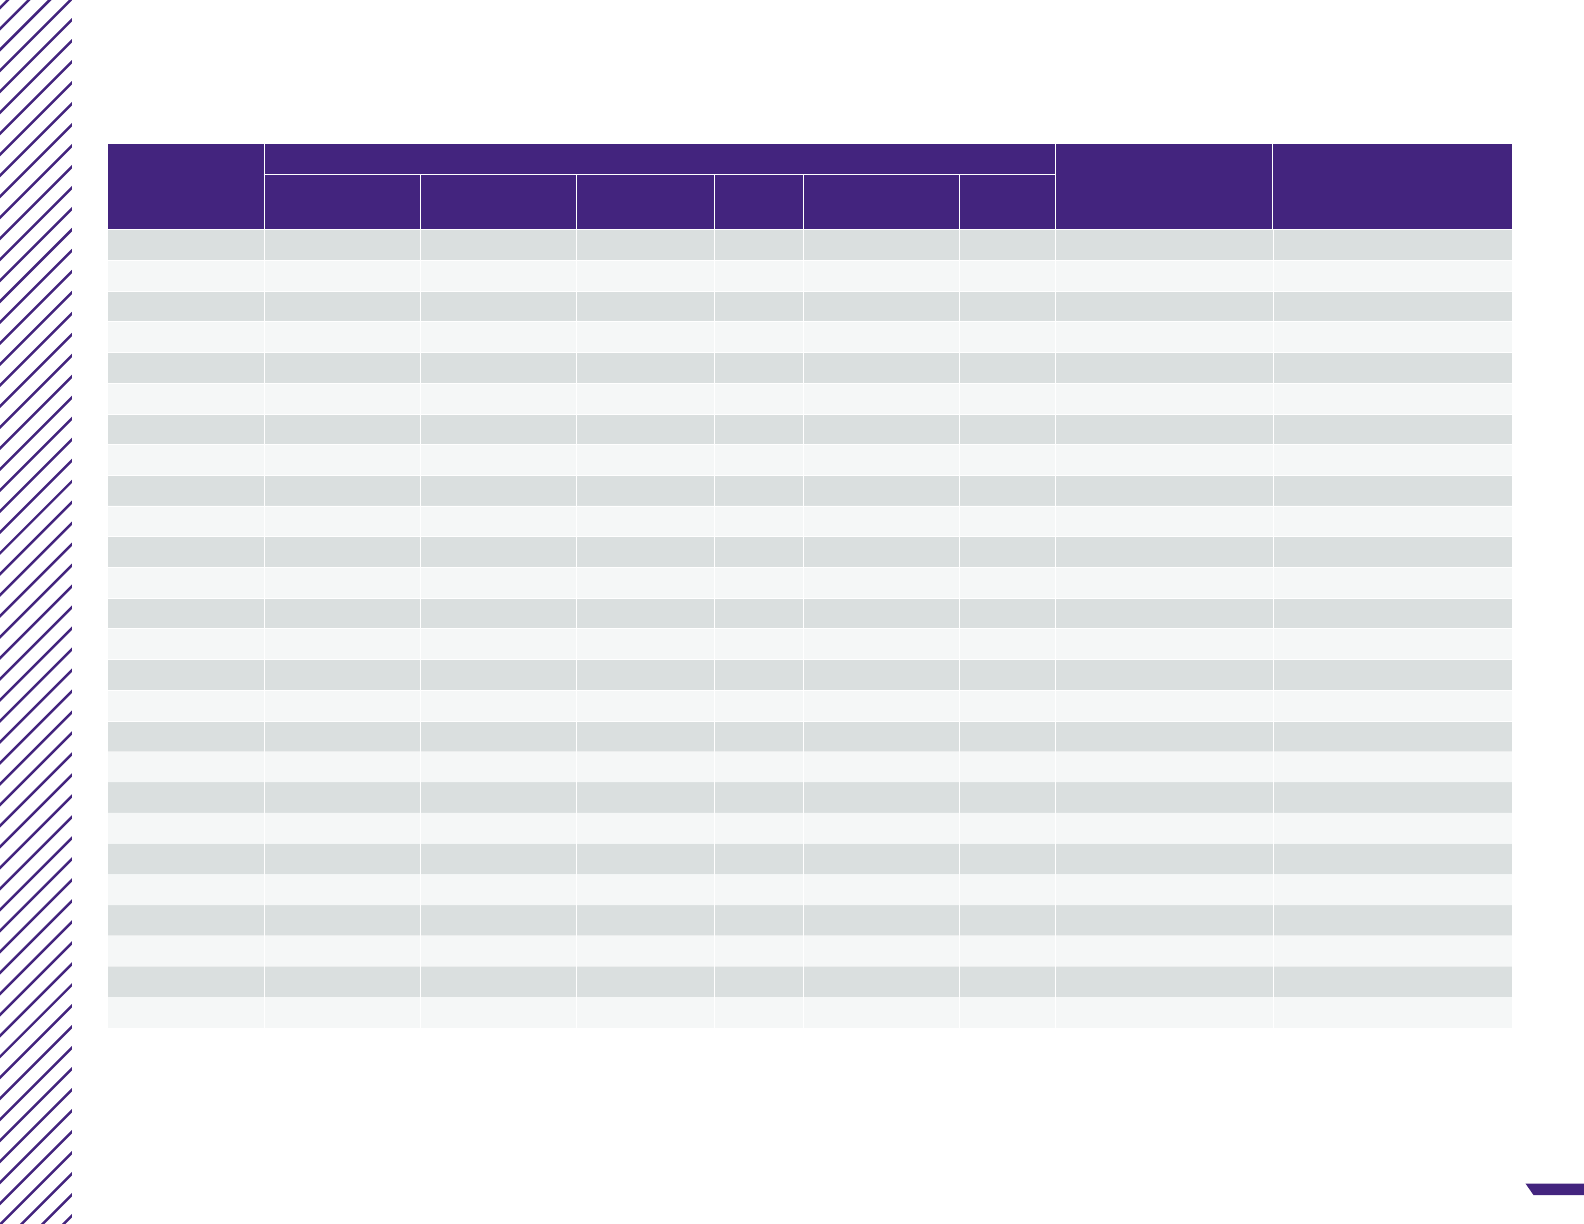
Director of Sales Incentive Plan Summary (1/2)
Sample
Performance Metrics
1
Max Payout
(% of Base)
Payout Frequency
Revenue
Team
Revenue
Indiv.
RevPAR GOP
Revenue to
Budget
Other
2
A X X 25% Annual
B X X X 35% Annual & Quarterly
C X X X Uncapped Quarterly
D X Uncapped Annual & Quarterly
E X X X 40% Quarterly
F X X X 25% Q & 15% A Annual & Quarterly
G X GK GK Uncapped Annual & Quarterly
H X X X 12.5% Quarterly
I X GK X 30% Quarterly
J X GK X X Uncapped Quarterly
K X Uncapped Quarterly
L X X X X Uncapped Annual & Quarterly
M X X X 37% Semi-Annual & Quarterly
N X X X X 30% Annual & Quarterly
O X
X GK X X 30% Annual & Quarterly
P X Uncapped Quarterly
Q X X X X 20% Annual
R X X X Uncapped Quarterly
S X X X X 57% Annual & Quarterly
T X X X 15% Quarterly
U X X 35% Quarterly
V X X X X 20% Quarterly
W X X X 25% Quarterly
X X X X 30% Annual & Quarterly
Y X X X $3,000 Quarterly
Z X X X X 50% Quarterly
1) Performance metrics: “X” indicate category used in incentive plan and “GK” indicates gatekeeper required for incentives to be paid out.
2) “Other” metrics include: sales activities, catering/banquet revenues, employee satisfaction scores, guest scores, physical state of hotel, etc.
23
HMC Sales Incentive Plans HSMAI SPECIAL REPORT
Director of Sales Incentive Plan Summary (2/2)
Sample
Performance Metrics
1
Max Payout
(% of Base)
Payout Frequency
Revenue
Team
Revenue
Indiv.
RevPAR GOP
Revenue to
Budget
Other
2
AA X X X X X X 30% Annual
AB X X GK $17,500 Quarterly
AC X X X 17.5% Annual & Quarterly
AD X X X 35% Annual
AE X X 24% Annual
AF X X X 35% Annual & Quarterly
AG X GK Uncapped Annual & Quarterly
AH GK X X 50% Quarterly
AI X X X 25% Annual & Quarterly
1) Performance metrics: “X” indicate category used in incentive plan and “GK” indicates gatekeeper required for incentives to be paid out.
2) “Other” metrics include: sales activities, catering/banquet revenues, employee satisfaction scores, guest scores, physical state of hotel, etc.

24
HMC Sales Incentive Plans HSMAI SPECIAL REPORT
Sales Manager Incentive Plan Summary (1/2)
Sample
Performance Metrics
1
Max Payout
(% of Base)
Payout Frequency
Revenue
Team
Revenue
Indiv.
RevPAR GOP
Revenue to
Budget
Other
2
A X X X X X 32% Annual & Quarterly
B X X Uncapped Quarterly
C X Uncapped Annual & Quarterly
D X X 35% Quarterly
E X X X X Uncapped Quarterly
F X X GK GK Uncapped Quarterly
G X X 25% Quarterly
H X X GK Uncapped Quarterly
I
X
GK
Uncapped Annual & Quarterly
J X X X Uncapped Annual & Quarterly
K X X X 19% Semi-Annual & Quarterly
L
X
GK
X 30% Quarterly
M
X
GK
Uncapped Annual & Quarterly
N X Uncapped Quarterly
O X X X 20% Annual
P X X X X Uncapped Quarterly
Q
X
X 31% Annual and Quarterly
R
X X X 15% Quarterly
S X X 7% Quarterly
T X X X 20% Quarterly
U X X X X 20% Quarterly
V X X X 50% Annual & Quarterly
W X X X 25% Quarterly
X X X 30% Annual & Quarterly
Y X X 25% Quarterly
Z X X GK $17,500 Quarterly
1) Performance metrics: “X” indicate category used in incentive plan and “GK” indicates gatekeeper required for incentives to be paid out.
2) “Other” metrics include: sales activities, catering/banquet revenues, employee satisfaction scores, guest scores, physical state of hotel, etc.

25
HMC Sales Incentive Plans HSMAI SPECIAL REPORT
Sales Manager Incentive Plan Summary (2/2)
Sample
Performance Metrics
1
Max Payout
(% of Base)
Payout Frequency
Revenue
Team
Revenue
Indiv.
RevPAR GOP
Revenue to
Budget
Other
2
AA X X X 17.5% Annual & Quarterly
AB X X X GK X 25% Annual & Quarterly
AC X X
X
GK
X 30% Annual & Quarterly
AD X $35,000 Annual & Quarterly
AE X GK Uncapped Annual & Quarterly
AF X X GK 40% Quarterly
AG X X 20% Annual & Quarterly
1) Performance metrics: “X” indicate category used in incentive plan and “GK” indicates gatekeeper required for incentives to be paid out.
2) “Other” metrics include: sales activities, catering/banquet revenues, employee satisfaction scores, guest scores, physical state of hotel, etc.

26
HMC Sales Incentive Plans HSMAI SPECIAL REPORT
http://www.seeklogo.net
C=0 M=26 J=56 N=0
C=22 M=42 J=65 N=20
ACCOR
LOGO
Nº dossier : 18J3476
Date : 4/07/18
Validation DA/DC :
Validation Client :
This report is presented with the support of HSMAI’s Organizational Member companies:
Diamond Members
Emerald Members
Sapphire Members
Ruby Members Start-Up Members University Members
Avvio
The Breakers
Cendyn
Cvent
Diamond Resorts
Duetto
Explore St. Louis
GitGo
Google
Host Hotels
Hostmark
IDeaS Revenue Solutions
JD Power
Kessler Collection
Marcus Hotels & Resorts
Marketo,
An Adobe Company
Milestone
MMGY Global
Nor1
OTA Insight
Outrigger Enterprises Group
Rainmaker
Regency Hotel Management
SearchWide
Spire Hospitality
STR
Venetian/Palazzo
Visit Dallas
Visit Tampa Bay
Burgess Crest
CoralTree Hospitality Group
Dragonfly Hospitality
Resources
Hospitality Digital Marketing
IVvy INC.
Kate Burda & Company
Navesink Advisory Group, LLC
Tim Peter & Associates
Cornell University
Johnson & Wales University
Michigan State University
Penn State University
University of Nevada
Las Vegas
Virginia Tech

27
HMC Sales Incentive Plans HSMAI SPECIAL REPORT
hsmai.org
