
Measuring Economic Policy Uncertainty
Scott R. Baker
a
, Nicholas Bloom
b
, and Steven Davis
c
September 12
th
2011
Abstract: Many commentators argue that uncertainty about taxes and spending and other
policy choices deepened the recession of 2007-2009 and slowed the recovery. To
investigate this issue, we develop a new index of policy-related economic uncertainty and
estimate its impact on aggregate output and employment. Our index is an average of
several components that reflect the frequency of news media references to policy-related
economic uncertainty, the number of tax code provisions set to expire in future years, and
the extent of forecaster disagreement over future federal government expenditures and
inflation outcomes. The index spikes around presidential elections and major events such
as the Gulf wars and the 9/11 attack. Index values are high in recent years and show clear
jumps associated with the Lehman bankruptcy, the 2010 midterm elections, the Euro
crisis and the U.S. debt-ceiling dispute. VAR estimates imply that higher policy
uncertainty leads to persistent negative effects on aggregate output and employment.
Greater policy uncertainty in 2011, relative to 2006 levels, lower GDP by about 1.4
percent and employment by about 2.5 million according to these VAR estimates.
JEL No. D80, E22, E66, G18, L50
Keywords: economic uncertainty, political uncertainty, policy uncertainty, volatility
Acknowledgements: We would like to thank the National Science Foundation, the Sloan
Foundation and the Stigler Center for the Study of the Economy and the State for
financial support.
a
Stanford, [email protected]
b
Stanford, Centre for Economic Performance, CEPR and NBER,
c
University of Chicago Booth School of Business, NBER and AEI;

1
1. INTRODUCTION
A rapidly growing literature centers on the impact of uncertainty on economic activity.
Many measures of uncertainty rise in recessions and fall in recoveries, suggesting that
uncertainty could play an important role in driving business cycles.
1
More generally, the
uncertainties arising after major economic and political shocks, like the 9/11 attacks, the
Cuban Missile Crisis and the Gulf Wars appear to generate short sharp recessions and
recoveries (Bloom, 2009).
One intuition behind this depressing effect of uncertainty on the economy goes back at
least to Bernanke (1983). Bernanke points out that when it is expensive for firms to make
a mistake – because investment projects are expensive to cancel or workers are costly to
hire and fire – firms will wait when uncertainty is high. If every firm waits to invest or
hire, the economy contracts, generating a recession. Of course, once uncertainty falls
back down, firms start hiring and investing again to address pent-up demand. Other
reasons for a depressing effect of uncertainty include pushing up the cost of finance (e.g.,
Gilchrist et al. (2010), Fernandez-Villaverde et al. (2011) and Pastor and Veronesi
(2011)), increasing managerial risk-aversion (Panousi and Papanikolaou, 2011), and an
intensification of agency problems that reduces the value of new and existing
employment, business and financial relationships (DeMarzo and Sannikov (2006) and
Narita (2011)).
Recently, many commentators have argued that policy-related uncertainty has been a key
factor in slowing the recovery from the recession of 2007-2009. The claim is that firms
and consumers are uncertain over future tax and spending, regulations, health-care reform
1
See, for example, evidence of counter-cyclical volatility in: macro stock returns in Schwert (1989); in
firm-level stock returns in Cambell et al. (2001), Bloom, Bond and Van Reenen (2007) and Bekaert et al.
(2010); in plant, firm, industry and aggregate output and productivity in Bloom, Floetotto and Jaimovich
(2009); and in price changes in Berger and Vavra (2010). Alexopolous and Cohen (2011) find that the
frequency of the word “uncertainty” close to the word “economy” in news articles rises steeply in
recessions. Some papers find little impact of uncertainty on economic activity – for example, Bachman et
al. (2010), Bachman and Bayer (2011) and Knotek and Khan (2011).

2
and interest rates. This uncertainty leads them to postpone spending on investment and
consumption goods, impeding the usual recovery from recessions.
In this paper we seek to investigate to what extent this is true. To do so, we take two
steps. First, we construct a new measure of economic policy uncertainty, and examine its
evolution since 1985.
2
Figure 1 plots our index of economic policy uncertainty. We build
the index from components that measure three aspects of economic policy uncertainty: (i)
the frequency of references to policy-related economic uncertainty in the Google-media
catalog; (ii) the number of tax measures set to expire in future years; and (iii) the extent
of disagreement among economic forecasters over future federal government
expenditures and the future CPI price level. The resulting index of policy-related
uncertainty looks sensible, with spikes around presidential elections and major political
shocks like the Gulf Wars and 9/11. Recently, it has risen to historic highs after the
Lehman bankruptcy, the 2010 midterm elections, the Euro crisis and the U.S. debt-ceiling
dispute.
Second, we estimate the impact of policy-related uncertainty shocks on economic activity
using our index in a vector autoregressive (VAR) model. We find that a policy
uncertainty increase equal to the rise from 2006 to 2011 generates declines in real GDP
of about 1.4% and of employment of around 2.5 million, with peak effects occurring after
one to two years. Bonn and Pfeifer (2011), Fernandez-Villaverde at al. (2011), and Pastor
and Veronesi (2011) also consider the potential impact of policy-related uncertainty on
economic activity, but their methods differ greatly from our approach.
Section 2 describes in more detail the data we use to construct our policy-related
uncertainty indices. Section 3 identifies specific policy areas that underlie policy
uncertainty levels and movements over time. Section 4 reports our estimates for the
impact of policy uncertainty on economic outcomes. Section 5 considers several proof-
of-concept tests for our policy-related uncertainty indexes and comparisons to other
2
Note that all our data is available on www.stanford.edu/~nbloom/policyuncertainty.zip

3
uncertainty measures. Section 6 concludes and lays out some directions for future
research.
2. MEASURING ECONOMIC POLICY UNCERTAINTY
To measure policy-related economic uncertainty, we construct an index from three types
of underlying components. One component quantifies newspaper coverage of policy-
related economic uncertainty. A second component reflects the number of tax code
provisions set to expire in future years. The third component uses disagreement among
economic forecasters as a proxy for uncertainty.
News coverage about policy-related economic uncertainty
Our first component is constructed from an index of Google News searches. To construct
the index, we perform month-by-month searches of Google News, starting in January of
1985, for terms related to economic and policy uncertainty. In particular, we search for
articles containing the term ‘uncertainty’ or ‘uncertain’, the terms ‘economic’ or
‘economy’ and one or more of the following terms: ‘policy’, ‘tax’, ‘spending’,
‘regulation’, ‘federal reserve’, ‘budget’, or ‘deficit’. In other words, to meet our criteria
for inclusion the article must include terms in all three categories pertaining to
uncertainty, the economy and policy. We restrict the searches to Google News sources
defined as being within the United States.
3
Our goal is to select articles in US news
sources that discuss something about economic uncertainty and that also discuss policy in
that regard. We count the number of articles that satisfy our search criteria each month,
giving us a monthly series.
One difficulty of using a straight news search index is the ever increasing volume of
news available online. The volume of news articles covered by Google News rises by
over 600% from 1985 to 2011, a huge increase over time. So to construct our index we
normalize the raw counts by the number of news articles in the same Google News
3
These are mainly US newspapers but also include some US hosted domains of foreign news sources, like
the BBC and the Times of London.

4
sources that contain the term ‘today’. We use the term ‘today’ as an indicator of an article
that is likely to be news focused. This approach yields a normalizing series that rises from
approximately 50,000 articles in 1985 to over 300,000 articles in July of 2011.
4
We then
employ a Hodrick-Prescott filter to smooth this series at a monthly level (smoothing
parameter of 129,600, as is standard for a monthly series) to remove high-frequency
variation.. Finally, we calculate our Google News index of policy-related economic
uncertainty by dividing the policy-related uncertainty counts described above by the
smoothed value of the ‘today’ series.
Figure 2 shows our Google News index of policy-related economic uncertainty. Here we
see clear spikes corresponding to the first and second Gulf Wars, the 1992 presidential
election, 9/11, the 2009 stimulus debate, the Lehman Brothers bankruptcy and TARP
bailout, intensification of the European debt crisis, the 2010 midterm elections, and the
recent debt-ceiling dispute, among other events.
The Appendix shows several other Google news search indices, which provide additional
evidence that these types of news searches yield sensible quantitative indicators of
political and economic uncertainty. For example, searches for uncertainty and energy
spike after events like the Gulf Wars, the Arab Spring and oil price spikes.
Tax Expiration Data
The second component of our index draws on reports by the Joint Committee on Taxation
(JCT) with data on the number of federal tax provisions set to expire in the current and
next 10 years.
5
Temporary tax measures are a source of uncertainty for businesses and
households because Congress often extends such measures at the last minute,
undermining stability in and certainty about the tax code. An important recent example
involves the Bush-era income tax cuts originally set to expire at the end of 2010.
Democrats and Republicans adopted opposing positions about whether to reverse these
4
For July 2011, we calculate this normalized value based on only the first 15 days of the month, as Google
News exhibits volatile behavior in the days nearest the current date.
5
Joint Committee on Taxation, U.S. Congress, 2011. List of Expiring Federal Tax Provisions, 2010-2020,
JCX-2-11, and similar documents in earlier years. Available at www.jct.gov.

5
tax cuts and, if so, for which taxpayers. Rather than resolving the uncertainty in advance,
Congress waited until December 2010 before deciding to extend the cuts for all
taxpayers. However, Congress extended the tax cuts for two years only, setting the stage
for another major political battle in 2012 and additional taxpayer uncertainty.
Such temporary taxes also lead to murkier views of federal spending and borrowing and
discrepancies between the tax revenue projections of the Congressional Budget Office
(CBO) and the Office of Management and Budget (OMB). The CBO uses ‘current law’
as a baseline (taking into account all tax expirations) while the OMB uses ‘current policy’
as a baseline, thus basing projections on policies likely to be extended, despite any
current expiration date. The CBO also produces alternative projections based on its
judgments about ‘current policy'.
Each year, the JCT provides data on these expirations for the current calendar year and
each of the following 10 years. The JCT identifies the month of expiration (typically but
not always December). As the JCT notes, for the “purposes of compiling this list, the
staff of the Joint Committee on Taxation considers a provision to be expiring if, at a
statutorily specified date, the provision expires completely or reverts to the law in effect
before the present-law version of the provision.” We apply a simple weighting to these
data in January of each year, multiplying expirations by 0.5^((T+1)/12) for T equal to the
number of months in the future when the tax code provision expires. This weighting
formula corresponds to an annual discount rate of 100 percent. We then sum the
discounted number of tax code expirations to obtain an index value for each January,
which we then hold constant during the calendar year.
6
. For the purposes of inclusion in
our final index, we perform a linear interpolation to fill in the non-January values. We
utilize a high discount rate because many expiring tax code provisions are regularly
renewed, and are unlikely to be a major source of uncertainty until the expiration date
looms near.
6
Currently, we are seeking to gather data that will enable us to construct a true monthly index for future tax
code expirations.

6
Figure 3 portrays the discounted sum of expiring tax provisions. Here we see a generally
increasing series. This pattern reflects a secular increase in the number of tax provisions
involving temporary measures subject to continual renewal, debate and uncertainty.
Economic Forecaster Disagreement
The third component of our policy-related uncertainty index comes from the Federal
Reserve Bank of Philadelphia’s Survey of Professional Forecasters. This quarterly survey
covers a wide range of macroeconomic variables. Each quarter, every forecaster receives
a form in which to fill out a number of values corresponding to forecasts for a variety of
variables in each of the next five quarters, as well as annualized values for the following
2 years.
7
We utilize the individual-level data for two of the forecast variables, the
consumer price index (CPI) and expenditures by the federal government for one year in
the future. We chose these variables because they are directly influenced by monetary
policy and fiscal policy actions. We treat the dispersion in the forecasts of these variables
as proxies for uncertainty about monetary policy and about government spending at the
federal level. This approach builds on a long literature using disagreement among
forecasters as a proxy for economic uncertainty.
8
For both series, we use the forecasts for 4 quarters in the future. For each quarter’s set of
forecasts, we calculate the interquartile range. In the case of future government
expenditures, we divide the interquartile range of forecasts by the mean forecast to obtain
a scaled measure of forecaster disagreement. Due to the quarterly nature of this data
source, we perform linear interpolation to fill in the missing values.
Figure 4 shows the dispersion in forecasts for federal spending four quarters in the future.
Relevant spikes include the passage of the Balanced Budget Act in 1985, a contentious
7
A sample form for Q1 2010 can be seen at http://www.philadelphiafed.org/research-and-data/real-time-
center/survey-of-professional-forecasters/form-examples/SpfForm-10Q1.pdf
8
See, for example, Zarnowitz and Lambros (1987), Bomberger (1996), Giordani and Soderlind (2004) and
Boero, Smith and Wallis (2008). These papers find a significant correlation between disagreement among
forecasters over future outcomes such as inflation and other measures of uncertainty. However, there is
disagreement over the strength and the interpretation of the link between forecaster disagreement and
uncertainty about future outcomes. See, for example, Rich and Tracy (2010), who claim a very weak link
for inflation.

7
budget battle in 1987, the 1992 presidential election, 9/11, and the stimulus spending
debates in from 2008 to 2010. Figure 5 shows the dispersion in CPI forecasts, with larger
spikes coming in both earlier and in later years following federal budgetary indecision,
major actions by the Federal Reserve, and recent stimulus measures by the federal
government.
Generating our overall policy-related economic uncertainty index
To generate our overall index of policy-related economy uncertainty, we first divide each
of our series by its own standard deviation, and then set each of the four component
series to have mean 100. In constructing the overall index we give weights of 0.6 on our
news-based index, 0.1 on our tax expirations index, 0.15 on CPI forecast disagreement
measure, and 0.15 on our federal expenditure disagreement measure. These weights
roughly reflect the distribution of specific sources of policy-related uncertainty, as
measured in Table 1 below. We give more weight to indices with broader coverage and
less weight to those with narrower coverage. We use a linear spline to create monthly
series for the forecaster disagreement and tax expiration components. To deal with
missing values, we set the pre-1998 tax expiration index to its 1998 value, and we set the
July 2011 value of the forecaster disagreement index to its June 2011 value.
In addition to our preferred weighting, we also calculate policy-related economic
uncertainty indices using two other weighting methodologies. First, we equally weight
the news-based measure, the combination of the two forecast disagreement measures, and
the tax expiration measure. The result is seen in Figure A4, and is very similar to our
preferred measure. Second, we perform a principle component analysis on our four series
and use these weights to construct an alternate index. This yields weights of 0.38 on our
news-based index, 0.39 on our tax expirations index, 0.22 on CPI forecast disagreement
measure, and 0.02 on our federal expenditure disagreement measure. We again find a
similar final index, seen in Figure A5. Our preferred index has correlations of 0.965 and
0.958 with the equally weighted and principle components weighted indices,
respectively.

8
Figure 1 displays our resulting Policy-Related Economic Uncertainty index. We find
spikes in uncertainty corresponding to several well-known prominent events and a
substantially higher level of uncertainty since the onset of the Great Recession in 2007. In
particular, we find spikes associated with consequential presidential elections, wars, 9/11,
contentious budget battles, and a number of spikes during and after the Great Recession.
The average index value is 93 in 2006 (the last year before the current crisis) and 178 in
the first six months of 2011, a difference of 85. We use this jump in the average index
value to quantify the impact of the recent surge in policy uncertainty on output and
employment.
3. SPECIFIC SOURCES OF POLICY UNCERTAINTY
To quantify the specific policy areas that contribute to policy uncertainty and drive
changes in its level and composition over time, we construct a categorical breakdown of
our news-based policy uncertainty index. We construct a number of category-specific
news-based indexes following the approach as before. In addition to requiring an article
to satisfy all the search criteria for our main policy uncertainty index, we now require it
to also mention category-specific terms such as “interest rate” or “inflation” for our
Monetary Policy category or “taxes” for our Taxes category.
Table 1 contains the results for twelve categories of policy uncertainty. The second row
reports average values of our Google News Index of Economic Policy Uncertainty in
each indicated period (scaling by the smoothed series for ‘today’), expressed as a
percentage of the average index value for the entire sample period from 1985:1 to 2011:7.
For example, the value of 36.9 for Economic Policy Uncertainty from 1985:1 to 1990:6
says that the value of the index in that period is 36.9% of its average value over the full
sample period. The top row reports the value of our Google News Index of Overall
Economic Uncertainty, also expressed as a percentage of the average value of the news-
based policy uncertainty index. Entries in Rows 1 to 12 report the values for specific
policy categories. For example, the value of 145.3 for “Monetary Policy” from 2010:1 to
2011:7 says that the number of scaled references to monetary policy uncertainty in this

9
period is 145 percent of the average number of scaled references to ALL forms of policy-
related uncertainty during the full 1985:1 to 2011:7 period.
Not surprisingly, Table 1 shows that national security matters loom large around Gulf
War I and after 9/11. The extraordinary levels of policy uncertainty in 2010 and 2011 are
dominated instead by concerns related to Monetary Policy and Taxes. Fiscal Policy more
generally, Health Care, Labor Regulation, National Security and Sovereign Debt &
Currency matters are also important contributing factors. Based on our current set of
category-specific search criteria, concerns related to Entitlement Programs, Financial
Regulation, Energy & Environment, Trade Policy, Competition Policy and Legal Policy
have been modest sources of economic policy uncertainty in recent years and earlier. It is
entirely possible that our findings in this regard reflect some inadequacies in our current
set of category-specific search criteria. We welcome suggestions for improvements in this
regard.
4. THE ECONOMIC IMPACT OF POLICY UNCERTAINTY
Does policy uncertainty drive overall economic uncertainty?
One obvious impact of policy uncertainty is to increase overall economic uncertainty. As
discussed in the introduction, there is a sizable literature on the negative impact of
economic uncertainty on growth. An interesting question is to what extent economic
uncertainty this reflects policy uncertainty. Perhaps most economic uncertainty is about
things not directly related to policy – for example, uncertainty over rates of technological
growth, consumer demand or commodity prices. Alternatively, perhaps economic
uncertainty is mostly driven by uncertainty over factors directly determined by policy
such as taxes and government regulation. Yet another possibility is that the same factors
that give rise to economic uncertainty also present new and difficult questions for
policymakers, generating an increase in policy uncertainty at the same time.
To help throw some light on these alternatives, Figure 6 plots our Google News measure
of economic policy uncertainty and a more general Google News measure of economic

10
uncertainty. The broader economic uncertainty measure is the count of articles containing
just the search terms (“uncertain” or “uncertainty”) and (“economic” or “economy”)
scaled by a smoothed version of ‘today’, while our narrower policy-related economic
uncertainty includes only those articles that also contain one or more of the policy terms
listed above, e.g., “tax” or “spending” or “regulation”.
Prior to 2001, Figure 6 shows several large jumps in economic uncertainty that involve
rather modest changes in economic policy uncertainty. Examples include the 1987 stock
market crash, the dissolution of the Soviet Union, and the 1997 Asian Financial Crisis.
Since 2001, however, there is a closer correspondence between large jumps in overall
economic uncertainty and large jumps in policy-related economic uncertainty. Figure 7
makes this point in a more systematic way. The figure shows a scatterplot of the log
economic uncertainty index against the log policy uncertainty index and linear regression
fits for three periods – 1985 to 1989, 1990 to August 2001 and September 2001 to July
2011. The regression R-squared values are 0.53 in the first period, 0.68 in the second
period, and 0.88 in the period since 9/11. In other words, policy uncertainty accounts for
a large share of the high-frequency variation in overall economic uncertainty since 9/11
and a substantially larger share in the past ten years than in the two earlier periods.
9
Returning to Figure 6, we can also calculate the ratio of news articles that meet our
criteria for policy-related economic uncertainty to those that meet our criteria for the
broader index of economic uncertainty. This is about 1/2 early in our sample period,
when the levels of both policy uncertainty and overall economic uncertainty were
relatively low. This means that about one in three of our economic uncertainty articles
also discussed policy. This ratio fell to about 1/3 throughout most of the 1990s, but
turned sharply upward in 2000 and again in 2008, reaching arounover 60%. Remarkably,
by July 2001, news articles about economic policy uncertainty account for 80% of all
news articles about economic uncertainty.
9
Although hard to see in the scatterplot, several data points from the 1990 to August 2001 period lay along
or very close to the post 9/11 regression line. They are October 1990 (two months after the Iraqi invasion of
Kuwait), January 1991 (start of Allied Operation Desert Storm to expel Iraq from Kuwait), September-
October 1992 (leading up to the presidential election of Bill Clinton in early November 1992), November
2000 (presidential election of George W Bush), and February-May 2001.

11
In summary, Figures 6 and 7 make three points. First, according to our news-based
approach, overall economic uncertainty is considerably higher in the past 10 years than in
the previous 15 years covered by our sample period. (See Table 1 as well.) Second,
policy-related uncertainty has increased more rapidly than overall uncertainty. As a
result, it accounts for a larger share of economic uncertainty in the past decade, more than
50% since 2005 and peaking at an astonishing 80% in July 2011 during the debt-ceiling
debate. Third, policy uncertainty accounts for most of the high-frequency movements in
economic uncertainty since 9/11, and a considerably larger share than in earlier periods.
These results imply that policy-related concerns are an increasingly important aspect of
overall economic uncertainty, and that by July 2011 they appear to be the major driving
force behind movements in overall economic uncertainty.
Vector Auto Regression Estimates of the Impact of Economic Policy Uncertainty
We are also interested in the impact of policy-related uncertainty on aggregate economic
activity. Here we adopt a simple empirical approach to this issue, using Vector Auto
Regressions (VAR) and simple identify assumptions to estimate the impact of policy
uncertainty on aggregate output and employment. We estimate the empirical relationships
among a series of current and lagged variables to investigate which variables appear to
drive other variables, as indicated by changes in driving variables followed in time by
changes in other variables they potentially influence.
We take a simple approach, running a monthly Cholesky Orthogonalized VAR on our
policy uncertainty index, the S&P 500 (a control for broader economic conditions), the
federal funds rate (a control for interest rates), log employment and log real GDP. The
VAR is run on monthly data with three lags, and a monthly time trend.
Of course, this approaches identifies relationships between variables from our Cholesky
ordering and differences in the timing of changes in each variable. So, for example, it
could be that policy uncertainty causes recessions, or that policy uncertainty is a forward-
looking variable that rises in advance of anticipated recessions. With these caveats in

12
mind, the VAR estimates provide evidence at least of important co-movements between
our index of policy-related uncertainty and economic activity, with some suggestive
evidence on causation.
Looking at Figure 8, we see that an 85 point rise in policy uncertainty (the rise in our
policy uncertainty index from 2006 to the first six months of 2011) is followed by a
persistent fall in real GDP with a peak negative impact of about -1.4% at 15 months.
Similarly, it also followed by a persistent fall in employment, with a peak effect of about
2.5 million at 18 months. These appear to be substantial effects, lending support to recent
concerns over the damage of policy uncertainty on economic activity.
These effects of political uncertainty on growth and employment appear to be robust to
controlling for other related factors. For example, if we add controls for broad economic
uncertainty using the index in Figure 6 or from Bloom et al. (2009), we find that the
impact of political uncertainty still yields a drop in real GDP of almost 1%. Similarly,
using our Google News-based index of policy uncertainty, or changing the functional
form by using the log of the uncertainty index (to get proportional increases) again leads
to significant negative impacts on GDP and employment. For readers interested in
investigating the data and relationships further, we place the full data set for Figures 1 to
5 plus Stata files to recreate Figures 6, 7 and 8 on the web at
www.stanford.edu/~nbloom/policyuncertainty.zip.
5. HOW GOOD ARE THE NEWS SEARCHES?
Our index relies critically on the ability of Google News searches to proxy for changes in
economy policy uncertainty. To investigate this we also use Google News to perform a
number of proof-of-concept tests. In these proof-of-concept tests we modify our approach
to Google News indexes to consider various types of uncertainty and check whether the
series respond to known sources of uncertainty.
13
For our first proof-of-concept test, we compare a modified version of our Google News
uncertainty index to a widely used measure of financial uncertainty. Specifically, we
search for articles containing the terms ‘uncertain’ or ‘uncertainty’ and ‘economic’ or
‘economy’, as in our primary Google News-based index of overall economic uncertainty,
but now require the additional terms ‘stock prices’, ‘equity prices’, or ‘stock market’. We
then compare our series with monthly mean values of the VIX index. The VIX is
commonly known as the ‘fear index’, as it gives one measurement of the volatility of the
S&P 500 stock market index. The VIX is constructed from the prices of a variety of
options on the S&P, with the stated intent to give a forecast of the next month’s implied
volatility of the S&P Index. Thus, it is often taken as a forward-looking measure of
uncertainty, predicting the likelihood of large swings in equity prices. We find in Figure 9
that our Google News-based search for uncertainty about equity prices and the stock
market and the VIX measure of uncertainty about stock prices are reassuringly similar.
A second test involves examining trends in media citations regarding competition with
Japan and China. We do this because most economists would agree that competition from
China has been increasing over time relative to competition from Japan. We perform
searches for articles containing ‘Economic’, ‘Competition’, and either ‘China’ or ‘Japan’.
We then normalize by the smoothed number of articles containing the word ‘today’.
Results are displayed in Figure 10. We can see a gradually declining trend for
competition with Japan, while media reference to economic competition with China rise
rapidly, passing the Japan references decisively during the early 2000’s. This pattern
mirrors our perception of trends in public sentiment, with economic competition from
China becoming a major concern for many, rather than the fear of economic competition
with Japan that held sway in earlier years.
Finally, Fernandez-Villaverde, et al. (2011) conduct an exercise to measure uncertainty
regarding economic decision-making in regards to consumption taxes, capital taxes, labor
taxes, and government spending. They proceed with a different methodology than our
own, employing a dynamic stochastic general equilibrium (DSGE) framework in order to
generate a time series of fiscal volatility shocks for each instrument. They then carry
14
these indices forward to estimate the harm done to growth by policy uncertainty, finding
significant negative effects. Comparing their findings to our own Economic Policy
Uncertainty Index, we find correlations of 0.44, 0.31, and 0.67 with their indices for
fiscal volatilities of capital taxes, labor taxes, and government expenditures. All
correlations are highly significant at a 1% level. We find no correlation with their fiscal
volatility index for consumption taxes. The strong correlations between our policy
uncertainty index and three of the four indexes developed by Fernandez-Villaverde et al.
using a completely different approach is again reassuring that we are picking up trends in
economic policy uncertainty.
6. CONCLUSION
Policy-related economic uncertainty has become the subject of contentious debate since
the recession of 2007-2009 and the most recent presidential and congressional elections.
Many commentators have argued that uncertainty over future policies regarding taxation
and spending, health-care reform, and financial regulation prolonged the recession and
hindered a strong recovery. Despite the debate, there exists no standard measure of this
type of uncertainty. We hope to provide an objective measure through the construction of
an index composed of a variety of policy-related uncertainty indicators. In our index, we
include measures of forecaster disagreement over the future path of consumer price
inflation and federal government expenditures, the number of tax code provisions set to
expire in the coming years, and a measure of the frequency of media mentions of policy-
related economic uncertainty.
We find that our index displays spikes around a number of major events such as federal
elections, 9/11, the Gulf Wars, the Lehman bankruptcy, and debates over the stimulus
package and the debt ceiling dispute. We see higher ‘base’ levels of our index since 2005
as well as larger spikes, and even higher levels since 2008. We also find that our news-
based index of policy-related economic uncertain accounts for a larger share of the high-
15
frequency variation in overall economic uncertainty in the past 10 years, as compared to
the previous 15 years.
Finally, we conduct a VAR analysis using our new policy-related uncertainty index to
investigate its role as one potential driver of real economic variables such as employment
and GDP. We find that the rise in our index that occurred between 2006 (prior to the
onset of the financial crisis) and the first six months of 2011 lowered real GDP by an
estimated 1.4% and reduced employment by 2.5 million within one to two years. This
finding gives some credence to concerns that policy-related uncertainty played a role in
the slow growth and fitful recovery of recent years, and invites further research into the
effects of policy-related uncertainty on economic performance.
16
APPENDIX: Additional News-Search Proof-of-Concept
We also look at an energy uncertainty index, measuring the frequency of the words
‘uncertain’, ‘politics’ or ‘policy’, and ‘energy’, and find the spikes match key energy
related shocks as shown in Figure A1. We do a similar exercise for the term ‘middle east’
and ‘terror’, again finding spikes in these indices that match known important terrorist
events and major shocks in the Middle East. See Figures A2 and A3. In summary, our
Google News indexes appear to provide a useful approach to quantifying various types of
economic and political uncertainty.
17
REFERENCES:
Alexopoulos, M. and J. Cohen, 2009. “Nothing to Fear but Fear itself? Exploring the
effect of economic uncertainty”, Manuscript, University of Toronto working paper.
Bachmann, Rüdiger, and Christian Bayer (2011). “Uncertainty Business Cycles—
Really?” unpublished manuscript.
Bachmann, Rüdiger, Steffen Elstener, and Eric Sims (2010). “Uncertainty and Economic
Activity: Evidence from Business Survey Data,” unpublished manuscript.
Bekaert, Geert, Robert Hodrick and Xiaoyan Zhang, 2010. “Aggregate Idiosyncratic
Uncertainty,” NBER Working Paper No. 16058.
Berger, D., and J. Vavra (2010): “Dynamics of the U.S. Price Distribution,” Yale mimeo
Bernanke, B. (1983): “Irreversibility, Uncertainty and Cyclical Investment,” Quarterly
Journal of Economics, 98, pp. 85–106.
Bloom, Nick. (2009): “The Impact of Uncertainty Shocks,” Econometrica, 77, pp. 623-
685.
Bloom, Nick, S. Bond, and J. Van Reenen (2007): “Uncertainty and Investment
Dynamics,” Review of Economic Studies, 74, pp. 391–415.
Bloom, N. M. Floetotto, and N. Jaimovich (2009): “Really Uncertain Business Cycles,”
Mimeo, Stanford.
Boero, Gianna, Jeremy Smith, and Kenneth F. Wallis, “Uncertainty and Disagreement in
Economic Prediction: The Bank of England Survey of External Forecasters,”
Economic Journal 118 (2008), 1107–1127.
Born, Benjamin and Pfeifer, Johannes, “Policy risk and the business cycle”, University of
Bonn mimeo, 2011.
Bomberger, W. A. (1996), "Disagreement as a Measure of Uncertainty", Journal of
Money, Credit and Banking, 28(3), 381-392.
Born, Benjamin and Johannes Pfeifer, 2011. “Policy Risk and the Business Cycle,”
University of Bonn.
Campbell, J., Lettau, M., Malkiel B. and Xu, Y. (2001), "Have Individual Stocks Become
More Volatile? An Empirical Exploration of Idiosyncratic Risk", Journal of
Finance, 56(1), 1-43.
DeMarzo, Peter M. and Uuliy Sannikov, 2006, “Optimal Security Design and Dynamic
Capital Structure in a Continuous-Time Agency Model,” Journal of Finance, 61, no
6 (December), 2681-2724.
Fernandez-Villaverde, Jesus, Guerron-Quintana, Pablo, Kuester, Keith and Juan Rubio-
Ramirez (2011), “Fiscal volatility shocks and economic activity”, University of
Pennsylvania mimeo.
Gilchrist, Simon, Jae W. Sim and Egon Zakrajsek, 2010, “Uncertainty, Financial Friction
and Investment Dynamics,
Giordani, P. and Soderlind, P. (2003). Inflation forecast uncertainty. European Economic
Review, 47, 1037-1059.
Joint Committee on Taxation, 2011. List of Expiring Tax Proficions, 2010-2020 (JCX-2-
11), January 21, and similar documents for earlier years. Available at www.jct.gov.
Knotek, E and Khan, S. (2011), “How do households respond to uncertainty shocks?”,
Kansas City Federal Reserve Board Economic Revivew, Second Quarter.
18
Narita, Futoshi, 2011. “Hiddent Actions, Risk-Taking, and Uncertainty Shocks,”
University of Minnesota, February.
Panousi, Vasia and Papanikolaou, Dimitris (2011), “Investment, idiosyncratic risk and
ownership”, forthcoming Journal of Finance.
Pastor, Lubos and Veronesi, Pietro, (2011), “Uncertainty about government policy and
stock prices”, forthcoming Journal of Finance
Rich, Robert and Tracy, Joseph. (2010), “The relationship among expected inflation,
disagreement, and uncertainty: evidence from matched point and density forecasts”,
Review of Economic Studies, 92(1), 200-207.
Schwert, G. W. (1989): “Why Does Stock Market Volatility Change Over Time?”
Journal of Finance 44, 1115-1153.
Zarnowitz, Victor, and Louis A. Lambros, “Consensus and Uncertainty in Economic
Prediction,” Journal of Political Economy 95 (1987), 591–621.

19
Table 1: The Intensity and Composition of Policy-Related Economic Uncertainty by Time Period.
Time period
1985:1-
1990:6
1990:7-
1991:12
1992:1-
2001:8
2001:9-
2007:6
2007:7-
2008:8
2008:9-
2009:12
2010:1-
2011:7
1985:1-
2011:7
Mid 1980s
to Gulf
War I
Gulf
War I
1990s
boom until
9/11
9/11 attacks
and 2000s
expansion
Beginning
of Credit
Crunch
Lehman
collapse to
‘recovery’ start
Start of
‘recovery’
onwards
Overall
Average
Overall Economic Uncertainty
57.7
228.5
91.3
259.0
338.0
497.0
442.7
181.0
Overall Economic Policy Uncertainty
36.9
62.1
38.7
143.9
205.4
276.8
340.9
100.0
1. Monetary policy
18.8
23.8
17.2
22.1
119.9
94.6
145.3
35.0
2. Taxes, spending & fiscal policy
18.3
27.7
20.7
40.5
61.6
119.4
165.0
40.3
2a. Fiscal Policy
4.3
4.1
4.1
4.8
6.5
16.7
32.2
6.7
2b. Taxes
16.4
24.9
19.0
36.7
53.6
86.0
118.5
33.5
2c. Government spending
4.1
6.4
4.8
4.3
3.4
8.2
14.1
5.3
3. Entitlement programs
3.4
5.0
6.2
6.9
5.1
7.9
13.8
6.2
4. Health care
3.8
7.7
9.8
11.9
10.6
17.0
21.4
10.0
5. Financial regulation
0.7
1.4
0.6
0.6
1.8
7.1
8.7
1.5
6. Labor regulation
13.3
20.1
15.5
19.9
19.1
42.2
28.5
18.5
7. Energy & environmental
4.0
7.1
5.1
7.3
9.2
13.8
14.4
6.7
8. National security
17.3
47.3
18.4
58.5
26.3
39.3
31.7
30.8
9. Sovereign debt & currency
2.0
1.5
3.2
4.7
6.9
8.9
28.3
5.1
10. Trade policy
3.1
4.4
5.1
5.7
4.7
4.8
4.3
4.7
11. Competition policy
3.3
3.8
3.7
6.5
6.6
8.1
9.2
4.9
12. Legal policy
0.8
0.7
0.9
2.0
0.9
1.1
1.2
1.2
Sum of Rows 1 to 12
89.0
150.5
98.9
186.8
272.5
364.1
471.8
164.9
Ratio of Policy Uncertainty To
Overall Economic Uncertainty
0.64
0.27
0.42
0.56
0.61
0.56
0.77
0.55

20
Notes to Table 1:
1. The second row reports average values of our Google News Index of Economic Policy Uncertainty in each indicated period (scaling by the smoothed
series for ‘today’), expressed as a percentage of the average index value for the entire sample period from 1985:1 to 2011:7. For example, the value of 36.9
for Economic Policy Uncertainty from 1985:1 to 1990:6 says that the value of the index in that period is 36.9% of its average value over the full sample
period.
2. The top row reports the value of our Google News Index of Overall Economic Uncertainty, also expressed as a percentage of the average value of the
news-based policy uncertainty index.
3. Entries in Rows 1 to 12 index report analogous values for narrower policy categories based on news article references to specific policy-related terms. For
example, the value of 145.3 for “Monetary Policy” from 2010:1 to 2011:7 says that the number of scaled references to monetary policy uncertainty in this
period is 145 percent of the average number of scaled references to ALL forms of policy-related uncertainty during the 1985:1 to 2011:7 sample period.
4. The categories in Rows 1 through 12 are not mutually exclusive in two respects. First, a given news article may discuss multiple distinct sources of
uncertainty such as monetary policy and entitlement reforms. Second, some of the category boundaries overlap. For example, Medicaid is an entitlement
program and a major part of the U.S. health care system. Google queries run August 28-29, 2011.
Specific search terms by row:
• Row 1: "monetary policy" OR "interest rates" OR "Fed funds rate" OR "inflation";
• Row 2 is a composite of all Row 2a-2c terms. Row 2a: "fiscal policy" OR "fiscal stimulus" OR "stimulus debate" OR "budget deficits" OR "government debt"
OR "balanced budget" OR "debt ceiling"; Row 2b: “taxes” OR “taxation” OR “tax”; Row 2c: "government spending" OR "budget battle" OR "balanced
budget";
• Row 3: "entitlement programs" OR "government entitlements" OR "Social Security" OR "Medicaid" OR "Medicare" OR "government welfare" OR
"unemployment insurance";
• Row 4: "health care" OR "Medicaid" OR "Medicare" OR "health insurance" OR "Obamacare" OR "medical tort reform" OR "prescription drugs" OR "drug
policy" OR "Food and Drug Administration";
• Row 5: "financial regulation" OR "banking regulation" OR "financial services regulation" OR "Glass-Steagall" OR "TARP" OR "executive compensation
regulation" OR "bank regulation" OR "Dodd-Frank" OR "consumer financial protection bureau" OR "commodity futures trading commission" OR "house
financial services committee" OR "Basel ii" OR "capital requirement" OR "Volcker rule";
• Row 6: "labor market regulation" OR "union rights" OR "collective bargaining" OR "card check" OR "National Labor Relations Board" OR "discrimination"
OR "minimum wage" OR "living wage" OR "right to work" OR "closed shop" OR "wage and hour" OR "workers compensation" OR "advance notice
requirement" OR "advance warning" OR "worker protection" OR "affirmative action" OR "disability act" OR "maternity leave" OR "at-will employment" OR
"overtime regulation" OR "overtime requirements" OR "overtime rights";
• Row 7: "energy policy" OR "energy regulation" OR "energy taxes" OR "carbon taxes" OR "cap and trade" OR "cap and tax" OR "drilling restrictions" OR
"offshore drilling" OR "pollution controls" OR "environmental restrictions" OR "environmental regulations" OR "Clean Air Act" OR "Clean Water Act" OR
"Environmental Protection Agency";
• Row 8: "national security" OR "war" OR "military conflict" OR "terrorism" OR "terror" OR "9/11" OR "defense spending" OR "military spending";
• Row 9: "sovereign debt" OR "currency crisis" OR "Euro crisis" OR "Asian financial crisis" OR "Russian financial crisis" OR "exchange rate";
21
• Row 10: "trade policy" OR "import tariffs" OR "import duty" OR "import barrier" OR "export subsidy" OR "WTO" OR "trade treaty" OR "trade agreement"
OR "trade act" OR "world trade organization" OR "Doha round" OR "Uruguay round" OR "GATT" OR "agriculture subsidies" OR "dumping" OR "anti-
dumping";
• Row 11: "competition policy" OR "antitrust" OR "merger policy" OR "monopoly" OR "patent" OR "copyright" OR "Federal Trade Commission" OR "unfair
business practices" OR "competition regulator" OR "cartel" OR "competition law" OR "price fixing" OR "consumer protection"";
• Row 12: "legal policy" OR "class action" OR "healthcare lawsuits" OR "frivolous lawsuits" OR "tort reform" OR "tort policy" OR "class action system" OR
"punitive damages" OR "medical malpractice". Having assuredly forgotten some aspects of these components, we welcome suggestions to improve these search
terms.
The authors welcome suggestions for improving the foregoing category-specific search terms.

Policy Uncertainty Index
(mean=100)
1
st
Gulf War
9/11
Clinton Election
2
nd
Gulf War
Bush Election
Balanced
Budget Act
Lehman
and
TARP
Figure 1: Index of Economic Policy Uncertainty
Euro
Crisis,
2010
Midterms
Stimulus
Debate
Obama
Election,
Banking
Crash
Debt
Ceiling
Dispute
Notes: Index of Policy-Related Economic Uncertainty composed of 4 series: monthly number of news articles containing uncertain or uncertainty,
economic or economy, and policy relevant terms (scaled by the smoothed number of articles containing ‘today’); the number of tax laws expiring
in coming years, and a composite of interquartile ranges for quarterly forecasts of federal government expenditures and 1-year CPI from the
Philadelphia Fed Survey of Forecasters. Weights: .6 Google News, .1 tax expirations, .15 CPI disagreement, .15 Federal expenditures disagreement.
Google query run August 11, 2011. Components are normalized to mean 100 then averaged. Index covers January 1985-July 2011.

Figure 2: News-Based Policy Uncertainty Index
Policy Uncertainty News Index
1
st
Gulf War
9/11
Clinton Election
2
nd
Gulf War
Bush Election
Stimulus
Debate
Lehman
and
TARP
Euro
Crisis,
2010
Midterm
Notes: News-Based Policy Uncertainty Index composed of monthly number of news articles containing uncertain or uncertainty, economic or
economy, as well as policy relevant terms (scaled by the smoothed number of articles containing ‘today’). Policy relevant terms include: ‘policy’,
‘tax’, ‘spending’, ‘regulation’, ‘federal reserve’, ‘budget’, and ‘deficit’. Series is normalized to mean 100. Index covers January 1985-July 2011.
Query Run August 11, 2011.
Tax Cuts
Russian Crisis/LTCM
Debt
Ceiling
Dispute
Obama
Election,
Banking
Crash

Figure 3: Tax Legislation Expiration Index
Notes: Utilizes List of Tax Expirations from the Joint Committee on Taxation. Each year’s forecast is a 10-year horizon of expiring tax laws. Future
months expirations are weighted by 0.5^((T+1)/12) where T is the number of months in the future the tax is expiring.
Tax Legislation Expiration Index

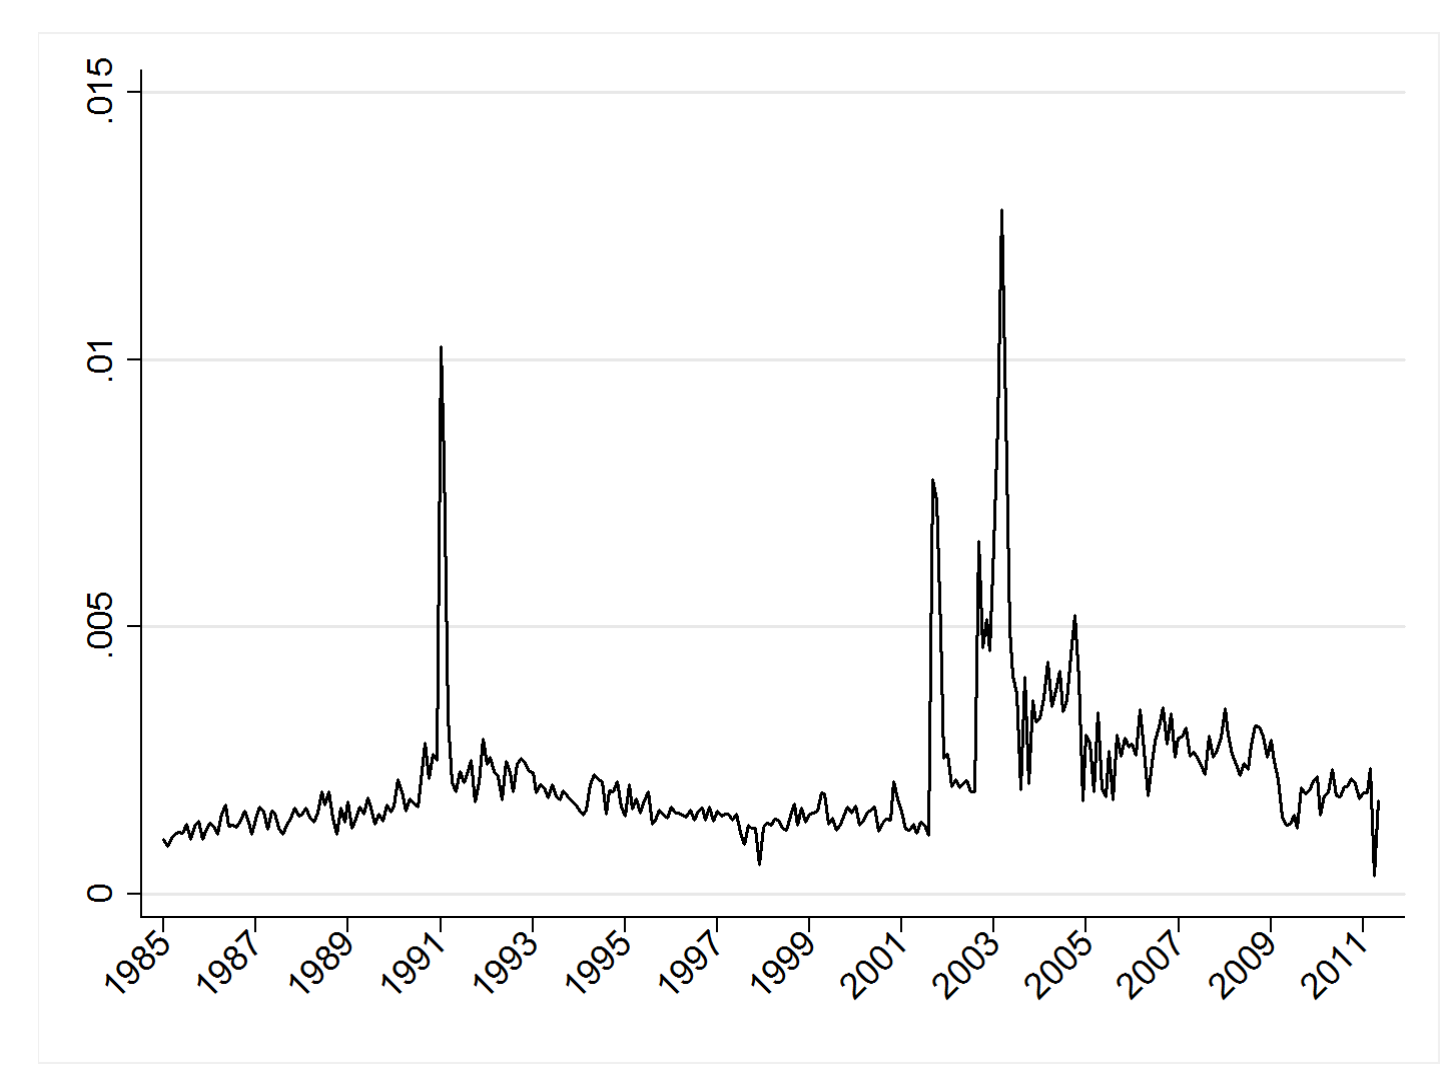
Figure 4: Federal Expenditures Forecast Interquartile Range Index
Federal Expenditures Forecasters IQ Range Index
Notes: From the Philadelphia Federal Reserve Survey of Professional Forecasters. Takes the interquartile (IQ) range of the 1-year ahead forecasts
(which are made every quarter) of total federal government expenditures relative to the mean forecast. Normalized to a mean 100 index.
Balanced Budget Act
Clinton Election
9/11
Budget Battle
Obama
Election,
Banking Crash

Figure 5: CPI Forecasters Interquartile Range Index
Notes: From the Philadelphia Federal Reserve Survey of Professional Forecasters. Takes the interquartile (IQ) range of the 1-year forecasts of CPI
(which are made every quarter). Normalized to a mean 100 index.
CPI Forecasters IQ Range Index
2
nd
Gulf War/
Fed Drops Interest Rates
1
st
Gulf War
Clinton Election
Obama
Election,
Banking
Crash
Euro
Crisis,
2010
Midterm
Balanced
Budget Act
Budget
Battle

Figure 6: Overall and Policy-Related Economic Uncertainty
Normalized Number of News Articles
Notes: Overall News-Based Economic Uncertainty Index composed of monthly number of news articles containing uncertain or uncertainty as well
as economic or economy (scaled by the smoothed number containing ‘today’). Policy Index set such that monthly average value is 100. Index
covers January 1985-July 2011. Axis shown as a log scale. Query run on August 11, 2011. Smoothed Ratio is the HP trend for the ratio of the levels
of Policy-Related Economic Uncertainty to Overall Economic Uncertainty.
Bush Election
Asian
Financial
Crisis
Gulf War I
Russian
Financial
Crisis/LTCM
Clinton
Election
Dissolution of
USSR
1987 Stock
Market Crash
Recession Fears
Recession Fears
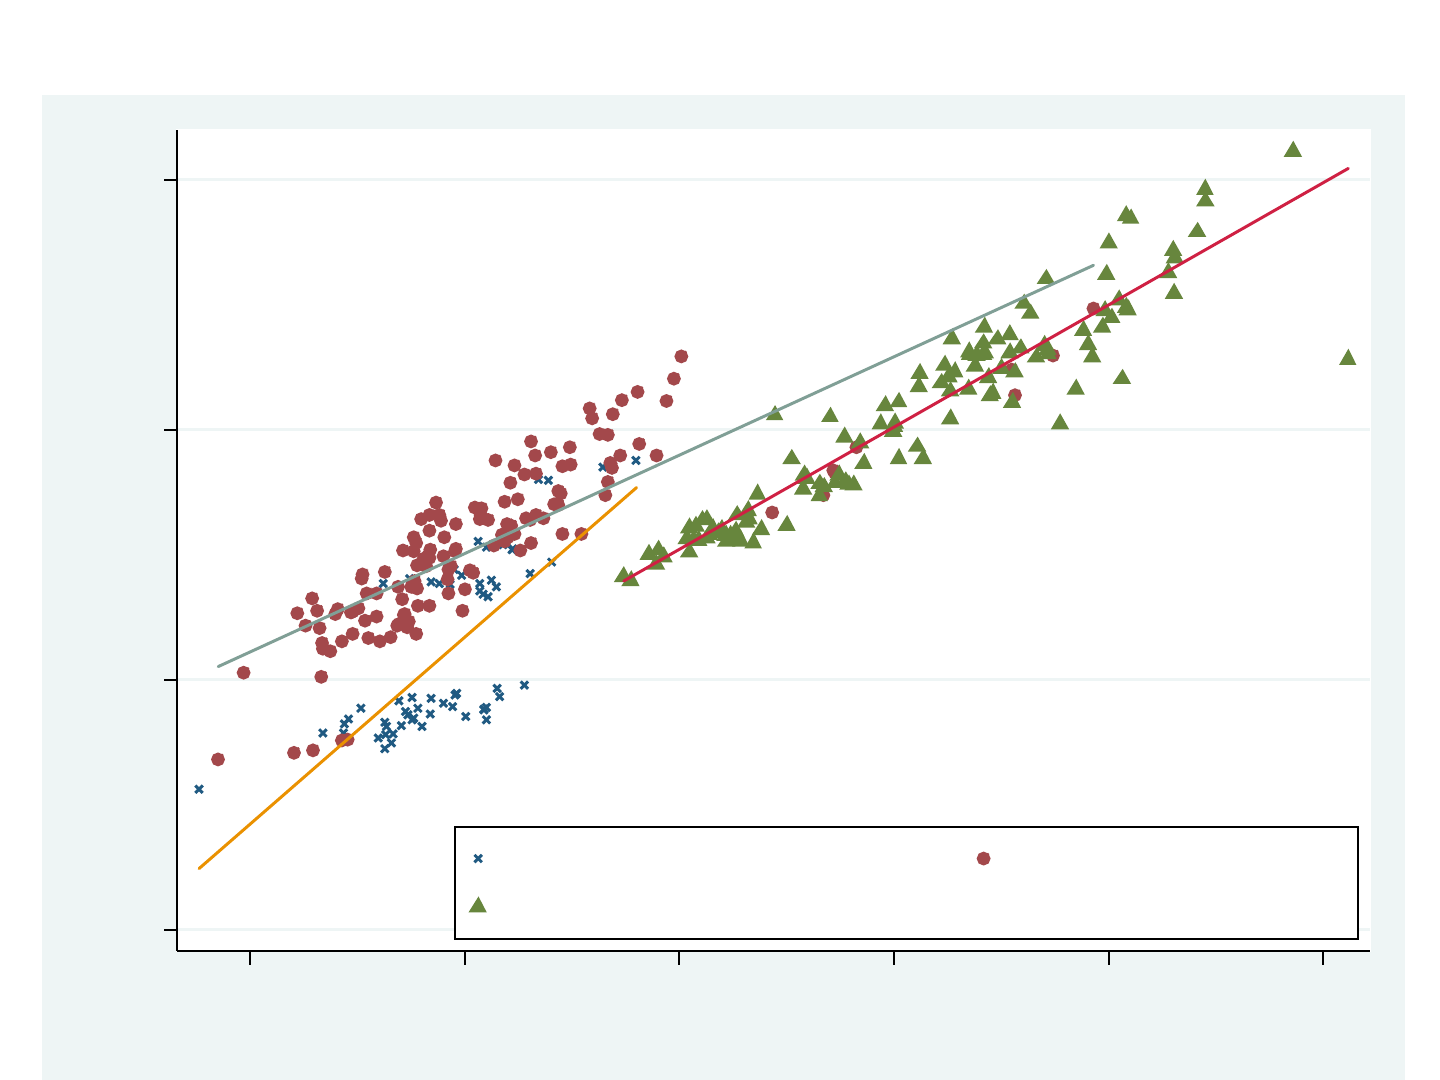
Figure 7: Relationship of News-Based Index of Overall Economic
Uncertainty to News-Based Index of Policy-Related Economic Uncertainty
4 5 6 7
log(Economic Uncertainty)
3.5 4 4.5 5 5.5 6
log(Policy Uncertainty)
1985-1989 1990 to August 2001
September 2001 Onwards
R-Squared: 0.68
Slope: 0.79 (0.05)
R-Squared: 0.88
Slope: 0.98 (0.03)
R-Squared: 0.53
Slope: 1.50 (0.19)

Figure 8: Estimated Impact of a Shock to Economic Policy Uncertainty
GDP Impact
(% deviation)
Months after the policy uncertainty shock
Notes: This shows the
impulse response
function for GDP and
employment to an 85
unit increase in the
policy-related
uncertainty index, the
increase from 2006 (the
year before the current
crisis) until the first 6
months of 2011. The
central (black) solid line
is the mean estimate
while the dashed (red)
outer lines are the one-
standard-error bands.
Estimated using a
monthly Cholesky
Vector Auto Regression
(VAR) of the uncertainty
index, the S&P 500
index, federal reserve
funds rate, log
employment, log GDP
and time trend. Data
from 1985 to 2011.
Employment Impact
(millions)

Figure 9: News-Based Financial Uncertainty Index
Financial Uncertainty Index
Notes: News-Based Financial Uncertainty Index composed of monthly number of news articles containing uncertain or uncertainty, economic or
economy, as well as terms relevant to financial markets (normalized by the number of articles containing ‘today’). These terms include economic or
economy as well as ‘stock prices’, ‘equity prices’, or ‘stock market’. VIX is scaled so both series have equal means. Google query run June 15,
2011. Data January 1985-May 2011.
1
st
Gulf War
9/11
Lehman Bankruptcy
2
nd
Gulf War
Asian Crisis
Russian Crisis/LTCM
Black Monday

China and Japan Competition Index
Figure 10: News-Based China and Japan Competition Indexes
Notes: News-Based China and Japan Competition Index composed of monthly number of news articles containing competition and economy and
Japan or China (scaled by the smoothed number of articles containing ‘today’). Google query run August 26, 2011. Index covers January 1985-July
2011.

Appendix Figure A1: News-Based Energy Uncertainty Index
Energy Uncertainty Index
Notes: Energy Uncertainty Index composed of monthly number of news articles containing uncertain or uncertainty as well as the term
‘energy’ (scaled by the smoothed number of articles containing ‘today’). Google query run June 15, 2011. Index covers January 1985-May 2011
1
st
Gulf War
2
nd
Gulf War
Arab Spring
Oil Spike
Oil Spike
Appendix Figure A2: News-Based War and Terror Uncertainty Index
War and Terror Uncertainty Index
Notes: News-Based War and Terror Uncertainty Index composed of monthly number of news articles containing uncertain or uncertainty as well as
the term ‘war’ or ‘terror’ (scaled by the smoothed number of articles containing ‘today’). Google query run June 15, 2011. Index covers January
1985-May 2011
1
st
Gulf War
2
nd
Gulf War
9/11
Bush Election

Appendix Figure A3: News-Based Middle East Uncertainty Index
Middle East Uncertainty Index
Notes: News-Based Middle East Uncertainty Index composed of monthly number of news articles containing uncertain or uncertainty as well as
the term ‘Middle East’ (scaled by the smoothed number of articles containing ‘today’). Google query run June 15, 2011. Index covers January 1985-
May 2011
1
st
Gulf War
9/11
2
nd
Gulf War
Arab Spring

Policy Uncertainty Index
1
st
Gulf War
9/11
Clinton Election
2
nd
Gulf War
Bush Election
Balanced
Budget Act
Lehman
and
TARP
Budget Battle
Appendix Figure A4: Equal Weighted Index
of Economic Policy Uncertainty
Euro
Crisis,
2010
Midterms
Stimulus
Debate
Obama
Election,
Banking
Crash
Debt
Ceiling
Debate
Notes: Index of Policy-Related Economic Uncertainty composed of 4 series. Included are monthly news articles containing uncertain or
uncertainty, economic or economy, and policy relevant terms (scaled by the smoothed number of articles containing ‘today’), the number of tax
laws expiring in coming years, and a composite of quarterly measures of the interquartile range of estimates of federal government expenditures
and 1-year CPI from the Philadelphia Fed Survey of Forecasters. Weights: .33 Google News, .33 tax expirations, .167 CPI disagreement, .167
Federal expenditures disagreement. Google query run August 11, 2011. Series normalized to mean 100. Index covers January 1985-July 2011.

Policy Uncertainty Index
1
st
Gulf War
9/11
Clinton Election
2
nd
Gulf War
Bush Election
Lehman
and
TARP
Appendix Figure A5: Principal Component Weighted
Index of Economic Policy Uncertainty
Euro
Crisis,
2010
Midterms
Stimulus
Debate
Obama
Election,
Banking
Crash
Debt
Ceiling
Debate
Notes: Index of Policy-Related Economic Uncertainty composed of 4 series. Included are monthly news articles containing uncertain or
uncertainty, economic or economy, and policy relevant terms (scaled by the smoothed number of articles containing ‘today’), the number of tax
laws expiring in coming years, and a composite of quarterly measures of the interquartile range of estimates of federal government expenditures
and 1-year CPI from the Philadelphia Fed Survey of Forecasters. Weights: .38 Google News, .39 tax expirations, .22 CPI disagreement, .02 Federal
expenditures disagreement. Google query run August 11, 2011. Series normalized to mean 100. Index covers January 1985-July 2011.
