
CORPORATE
INCOME TAX
Most Large Profitable
U.S. Corporations
Paid Tax but Effective
Tax Rates Differed
Significantly from the
Statutory Rate
Report to the Ranking Member,
Committee on the Budget,
U.S. Senate
March 2016
GAO-16-363
United States Government Accountability Office

United States Government Accountability Office
Highlights of GAO-16-363, a report to the
Ranking Member
, Committee on the Budget,
U.S. Senate
March 2016
CORPORATE INCOME TAX
Most Large Profitable U.S. Corporations Paid Tax but
Effective Tax Rates
Differed Significantly from the
Statutory Rate
Why GAO Did This Study
Congress and the administration
continue to express interest in
reforming the U.S. corporate income
tax and the rate at which U.S.
corporations’ income is taxed.
Currently, the top statutory corporate
income tax rate is 35 percent. GAO’s
2013 report on corporate ETRs found
that in tax year 2010, whether for all
large corporate filers or only profitable
ones, the average ETRs were
significantly below the statutory rate.
To provide an update, GAO was asked
to assess the extent to which U.S.
corporations pay federal income tax
and the percentage that had no federal
income tax liability. In this report, GAO
estimates (1) the percentage of all and
large corporations that had no federal
income tax liability and (2) average
ETRs based on financial statement
reporting and tax reporting. To conduct
this work, GAO reviewed economic
literature, analyzed IRS data for tax
years 2006 to 2012 (the most recent
data available), including the financial
and tax information that large
corporations report on Schedule M-3,
and interviewed Internal Revenue
Service (IRS) officials and subject
matter experts.
What GAO Recommends
GAO does not make recommendations
in this report. GAO provided a draft of
this report to IRS for review and
comment. IRS provided technical
comments, which were incorporated,
as appropriate.
What GAO Found
In each year from 2006 to 2012, at least two-thirds of all active corporations had
no federal income tax liability. Larger corporations were more likely to owe tax.
Among large corporations (generally those with at least $10 million in assets)
less than half—42.3 percent—paid no federal income tax in 2012. Of those large
corporations whose financial statements reported a profit, 19.5 percent paid no
federal income tax that year. Reasons why even profitable corporations may
have paid no federal tax in a given year include the use of tax deductions for
losses carried forward from prior years and tax incentives, such as depreciation
allowances that are more generous in the federal tax code than those allowed for
financial accounting purposes. Corporations that did have a federal corporate
income tax liability for tax year 2012 owed $267.5 billion.
Percentage of Corporations That Reported No Tax Liability after Tax Credits,
Tax Years 2006 to 2012
These reasons also explain why corporate effective tax rates (ETR) can differ
substantially from statutory tax rates. ETRs attempt to measure taxes paid as a
proportion of economic income, while statutory rates indicate the amount of tax
liability (before any credits) relative to taxable income, which is defined by tax law
and reflects tax benefits built into the law. The statutory tax rate on net corporate
income ranges from 15 to 35 percent, depending on the amount of income
earned. For tax years 2008 to 2012, profitable large U.S. corporations paid, on
average, U.S. federal income taxes amounting to about 14 percent of the pretax
net income that they reported in their financial statements (for those entities
included in their tax returns).
When foreign and state and local income taxes are included, the average ETR
across all of those years increases to just over 22 percent. GAO also computed
ETRs that combine large profitable corporations and those large corporations
with current year losses, which pay little if any actual tax. Over tax years 2008 to
2012, all large corporations—profitable and those that reported current year
losses—paid 25.9 percent of their pretax net income in U.S. federal income
taxes, and 40.1 percent when foreign and state and local taxes are included.
Including corporations with losses results in a more comprehensive estimate, but
makes the results difficult to interpret because ETR is not meaningful for a
corporation in a year in which it has a net loss. GAO could not examine the
variation in ETRs across corporations with the aggregated data available,
although GAO’s prior work suggests that ETRs are likely to vary considerably.
View GAO-16-363. For more information,
contact
Jessica Lucas-Judy at (202) 512-
9110
or
LucasJudyJ@gao.gov.

Page i GAO-16-363 Corporate Income Tax
Letter 1
Background 4
In Each Year from 2006 to 2012, Most Corporations Had No
Federal Income Tax Liability, but a Majority of Large
Corporations Did 10
Average ETRs for Large Corporations, Which Differed
Significantly from Their Statutory Rates, Increased Slightly from
2010 to 2012 13
Agency Comments and Our Evaluation 19
Appendix I Selected Issues Relating to the Calculation of Effective Corporate Income
Tax Rates 20
The Inclusion of Corporations with Losses in Effective Tax Rate
Estimates 20
Calculating Worldwide Effective Tax Rates 23
Appendix II Summary of Selected Past Estimates of Average Effective Tax Rates
Based on Financial Statement Data 27
Appendix III Number and Percentage of U.S. Corporations with No Federal Income
Tax Liability from Tax Years 2006 to 2012 31
Appendix IV Average Federal and Worldwide Effective Tax Rates for Varying
Populations of Large Corporations (Schedule M-3 Filers) 33
Appendix V GAO Contact and Staff Acknowledgments 35
Tables
Table 1: Example of How Losses Can Distort Effective Tax Rate
Estimates 21
Table 2: Alternative Calculations of Corporate Effective Tax Rates
for Profitable Large Corporations (Schedule M-3 Filers),
Incorporating Net Operating Loss Deductions (NOLD),
Tax Years 2008 to 2012 22
Contents

Page ii GAO-16-363 Corporate Income Tax
Table 3: Number and Percentage of All Corporations With No Tax
Liability After Credits, Tax Years 2006 through 2012 31
Table 4: Number and Percentage of All and Profitable Large
Corporations (Schedule M-3 filers) with No Federal Tax
Liability After Credits, Tax Years 2006 through 2012 32
Table 5: Average Effective Tax Rates for Profitable Large
Corporations (Schedule M-3 Filers), Tax Years 2008
through 2012 33
Table 6: Average Effective Tax Rates for All Large Corporations
(Schedule M-3 Filers), Tax Years 2006 through 2012 34
Figures
Figure 1: Federal Tax Revenues as a Percentage of Gross
Domestic Product, 1950 to 2014 (2015 to 2020
Projected) 6
Figure 2: Percentage of Corporations That Reported No Tax
Liability after Credits, Tax Years 2006 to 2012 12
Figure 3: Average Federal and Worldwide Effective Tax Rates for
Profitable Large Corporations (Schedule M-3 Filers), Tax
Years 2008 through 2012 15
Figure 4: Average Federal and Worldwide Effective Tax Rates for
All Large Corporations (Schedule M-3 Filers), Tax Years
2006 through 2012 18
Figure 5: Average Effective Tax Rates for Selected Studies on
U.S. Companies, Using Worldwide Pretax Net Book
Income 29

Page iii GAO-16-363 Corporate Income Tax
Abbreviations
ETR Effective Tax Rate
IRC Internal Revenue Code
IRS Internal Revenue Service
NOLD Net Operating Loss Deduction
This is a work of the U.S. government and is not subject to copyright protection in the
United States. The published product may be reproduced and distributed in its entirety
without further permission from GAO. However, because this work may contain
copyrighted images or other material, permission from the copyright holder may be
necessary if you wish to reproduce this material separately.

Page 1 GAO-16-363 Corporate Income Tax
441 G St. N.W.
Washington, DC 20548
March 17, 2016
The Honorable Bernard Sanders
Ranking Member
Committee on the Budget
United States Senate
Dear Senator Sanders:
Congress and the administration continue to debate how to reform the
U.S. corporate income tax. One focus of this discussion is the rate at
which U.S. corporations’ income should be taxed—currently, the top
federal statutory corporate income tax rate is 35 percent. As policymakers
debate this issue, it will be helpful to also have an understanding of the
average effective tax rate (ETR) for corporations, which equals the
amount of income tax corporations pay divided by their pretax income.
ETRs are more appropriate measures of corporate tax burdens than
statutory rates because ETRs reflect the combined effects of exemptions,
deferrals, tax credits, and other tax benefits. Our previous report on
corporate ETRs found that in 2010, whether for all large corporations or
only profitable ones, the average ETRs were significantly below the
statutory rate.
1
As Congress continues discussions on corporate tax reform and what
burden corporations should bear, you asked us to assess the extent to
which U.S. corporations pay federal income tax and the percentage that
had no federal income tax liability. In this report, we estimate (1) the
percent of all corporations and large corporations that had no federal
income tax liability in each year for tax years 2006 to 2012, and (2) the
average corporate effective tax rates for large corporations based on
financial statement reporting and tax reporting for tax years 2006 to
2012.
2
1
GAO, Corporate Income Tax: Effective Tax Rates Can Differ Significantly from the
Statutory Rate, GAO-13-520 (Washington, D.C.: May 30, 2013).
2
For the purposes of this report, we refer to corporations that filed a Schedule M-3 as
large corporations. In general, corporations with $10 million or more in assets are required
to file a Schedule M-3.
Letter

Page 2 GAO-16-363 Corporate Income Tax
To estimate the number and percentage of corporations that had no
federal income tax liability, we analyzed data on the number of
corporations with and without total income tax after credits for all
corporations from the Internal Revenue Service’s (IRS) Corporation
Income Tax Returns Complete Report, as well as for the population of
large corporations that filed Schedules M-3.
3
The Schedule M-3
reconciles income and expense amounts that corporations report for
financial statement purposes with amounts they report for tax purposes,
and is the data source we used for analyzing ETRs, as described below.
We report data for all corporations for tax years 2006 to 2012, for all
Schedule M-3 filers for tax years 2006 to 2012, and for profitable
Schedule M-3 filers for tax years 2008 to 2012. These were the most
recent estimates available at the time of our work and are subject to
sampling errors.
4
To report what available data indicate about the difference between
average effective tax rates based on financial statement reporting versus
those based on tax reporting, we computed a variety of such rates using
income and expense data that large corporations report on the Schedules
M-3 that they file with IRS. These data, which the joint Department of the
Treasury-IRS M-3 First Look Team compiles for a large sample of
taxpayers, allowed us to compare and estimate U.S. and worldwide
effective tax rates on worldwide income of entities included in the federal
income tax return, first using only financial statement data, then using
only data reported for tax purposes, and finally using income data from
financial statements and tax return data for the amount of taxes paid.
3
See IRS Statistics of Income, Corporation Income Tax Returns Complete Report. Data
on all corporations include active corporations filing tax forms 1120 (U.S. Corporation
Income Tax Return), 1120-L (U.S. Life Insurance Company Income Tax Return), 1120-PC
(U.S. Property and Casualty Insurance Company Income Tax Return), and 1120-F (U.S.
Income Tax Return of a Foreign Corporation). Data are not included for certain “pass-
through” entities, which file on forms 1120-REIT (U.S. Income Tax Return for Real Estate
Investment Trusts), 1120-RIC (U.S. Income Tax Return for Regulated Investment
Companies), and 1120S (U.S. Income Tax Return for an S Corporation). The amount for
total income tax after credits includes the following: income tax, personal holding company
tax, recapture and other taxes, alternative minimum tax, branch tax (Form 1120-F), tax
from page 1, line 5 (Form 1120-PC), and adjustments to income tax, and to total tax.
4
Data compiled by IRS Statistics of Income are based on a stratified random sample of
corporate income tax returns. See https://www.irs.gov/uac/SOI-Tax-Stats-Corporation-
Complete-Report. The number of noncertainty corporations in the Schedule M-3 sample is
over 10,000 for each year after 2004.

Page 3 GAO-16-363 Corporate Income Tax
The financial statement data we used from the Schedules M-3 for
worldwide income and tax expenses—including federal, foreign, and U.S.
state and local income taxes—are limited to the entities that are included
in the U.S. taxpayer’s federal tax return. Consequently, the scope of the
corporate entities included in our analysis can differ from the scope of the
entities included in publicly filed financial statements because not all
foreign entities represented in those statements are included in a federal
tax return.
5
In addition, our estimates of effective tax rates remain limited
to corporations with assets of $10 million or more because those are the
ones that filed a Schedule M-3. Our analysis covers all large corporations
for tax years 2006 to 2012 and profitable large corporations (i.e., those
that did not report net losses in their financial statements) for tax years
2008 to 2012.
6
The Schedule M-3 data were available to us in aggregated
form and therefore we were not able to provide any information on the
distribution of ETRs across individual corporations; instead, we estimated
ETRs averaged over the populations of all corporations and profitable
corporations (see appendix I for a detailed discussion of several
limitations of the data for purposes of estimating ETRs).
We also reviewed and summarized the relevant economic and accounting
literature on ETRs since March 2013 (the end date of the literature review
in our previous report).
7
We also discussed our methodology with subject
matter experts from the Congressional Research Service and from the
Department of the Treasury, each of whom has written on effective tax
rates. Based on these discussions, we supplemented our analysis where
we deemed appropriate and possible based on available data.
5
As we discuss in appendix I, this scope limitation, combined with the complexity of U.S.
tax rules pertaining to foreign income, complicates the computation of worldwide ETRs.
6
IRS has compiled data separately for corporations that had nonnegative values for net
income on their financial statements for only tax years 2008 to 2012. The Schedule M-3
data are drawn from IRS’s Statistics of Income division’s annual stratified random samples
of corporate tax returns. The results we present based on these samples are subject to
sampling error. We do not have the detailed information needed to estimate the size of the
sampling error; however, we believe these errors are negligible because a significant
proportion of the returns with Schedules M-3 attached, which are a part of the Schedule
M-3 dataset are sampled at a 100 percent rate and the remaining M-3 filers are sampled
at rates of 27 percent or more. Those returns that were sampled at the 100 percent rate
accounted for 99 percent of the total assets of all returns filed with a Schedule M-3 for tax
year 2012.
7
See appendix II for a summary of past studies that used financial statement data to
estimate average effective tax rates.

Page 4 GAO-16-363 Corporate Income Tax
To assess the reliability of the data and estimates, we reviewed agency
documentation, interviewed agency officials, and reviewed our prior
reports that have used the data and estimates. While there are limitations
to the data provided on the Schedules M-3 and general reporting
problems with tax return data, we determined that the data were
sufficiently reliable to meet our reporting objectives.
We conducted our work from August 2015 to March 2016 in accordance
with all sections of GAO’s Quality Assurance Framework that are relevant
to our objectives. The framework requires that we plan and perform the
engagement to obtain sufficient and appropriate evidence to meet our
stated objectives and to discuss any limitations in our work. We believe
that the information and data obtained, and the analysis conducted,
provide a reasonable basis for any findings and conclusions in this
product.
The base of the federal corporate income tax includes net income from
business operations (receipts, minus the costs of purchased goods, labor,
interest, and other expenses). It also includes net income that
corporations earn in the form of interest, dividends, rent, royalties, and
realized capital gains. The statutory rate of tax on net corporate income
ranges from 15 to 35 percent, depending on the amount of income
earned.
8
The United States taxes the worldwide income of domestic
corporations, regardless of where the income is earned, but allows a
8
26 U.S.C. § 11. In addition, present law imposes an alternative minimum tax on certain
corporations to the extent that their minimum tax liability exceeds their regular tax liability.
26 U.S.C. § 56. In general, the alternative minimum tax applies a lower tax rate to a
broader tax base. Specifically, the regular tax base is increased for alternative minimum
tax purposes by adding back certain items treated as tax preferences and disallowing
certain deductions and credits. Also, marginal rates are higher over limited income ranges
to recapture the benefits of the rates below 35 percent.
Background
Corporate Income Tax
System

Page 5 GAO-16-363 Corporate Income Tax
foreign tax credit for certain taxes paid to other countries.
9
The timing of
the tax liability depends on several factors. For example, income earned
by foreign subsidiaries is generally not taxed until it is distributed—such
as in the form of a dividend—to the U.S. parent corporation.
Another
important element of the U.S. corporate income tax system is the
treatment of losses incurred in a given tax year. If a corporation has a net
operating loss in a particular year, the corporation may carry those losses
forward into future tax years or backward into prior tax years.
10
When
carried back, corporations can deduct those losses from taxable income
and are eligible for a refund equal to the difference between previously
paid taxes and taxes owed after deducting the current year’s loss. Losses
carried forward may be used to reduce future taxable income and tax
liabilities, but cannot be used to reduce taxable income below zero. As a
result, a corporation with a substantial loss in a particular year may claim
deductions stemming from that loss over a number of years in the future.
While corporate income taxes have declined markedly as a share of
gross domestic product since the 1950s, they remain an important source
of federal revenue. In fiscal year 2014, corporate income tax revenue as a
share of gross domestic product was 1.9 percent and totaled $321 billion.
By comparison, revenues from individual income taxes and from social
insurance and retirement receipts (e.g., Medicare) were $1.4 trillion and
$1.02 trillion, respectively, in that year. Corporate income taxes
accounted for 10.6 percent of all federal revenues in 2014, up from 6.6
percent in 2009, but still below their recent high of 14.7 percent in 2006
(see figure 1).
11
9
Taxable income is, in general, total income, including taxable income from foreign
sources, minus deductions such as for salaries and wages, depreciation, and net
operating loss carryovers. The federal income tax owed is determined by multiplying this
income by the applicable tax rate and then subtracting any tax credits, including the
foreign tax credit, for which the taxpayer may be eligible.
10
26 U.S.C. §172. Corporations may carry losses back to two prior years’ taxable income
or forward for up to 20 years.
11
Office of Management and Budget, Historical Tables, Budget of the United States
Government, Fiscal Year 2016 (Washington, D.C.: February 2015).

Page 6 GAO-16-363 Corporate Income Tax
Figure 1: Federal Tax Revenues as a Percentage of Gross Domestic Product, 1950
to 2014 (2015 to 2020 Projected)
Businesses operating as publicly traded corporations in the United States
are required to report the income they earn and the expenses (including
taxes) they incur each year according to two separate standards. First,
corporations must produce financial statements in accordance with
generally accepted accounting principles in order to provide certain
information to investors and creditors. The income and expense items
reported in these statements are commonly known as book items.
Second, U.S. corporations must file corporate income tax returns on
which they report income, expenses, and tax liabilities, according to rules
set out in the Internal Revenue Code (IRC) and associated Department of
the Treasury regulations. While the IRC generally requires that a
corporation’s taxable year and overall method of accounting conform to
those standards used for financial reporting purposes, specific differences
are permitted (and, in some cases, required). These are known as book-
tax differences. One important source of book-tax differences is
incentives for investment and other specific activities that Congress has
chosen to incorporate into the tax code. For example, the bonus
Financial and Tax
Reporting Requirements
for Corporations

Page 7 GAO-16-363 Corporate Income Tax
depreciation allowance permits businesses to depreciate qualified capital
assets much more rapidly than they are permitted to do under financial
accounting. As a result, taxable income will be reduced by a greater
amount than will book income for the year in which the qualified
investment is made. However, in later years (until the asset is completely
depreciated), book income will be reduced by greater amounts than will
taxable income.
Corporations with assets that equal or exceed $10 million are required to
report these book-tax differences to IRS on the Schedule M-3 of their
income tax returns.
12
In tax year 2012, 42,301 corporations filed a
Schedule M-3 return. Of these, 27,546 were profitable according to their
financial statements. By comparison, in that same year, there were
almost 1.62 million active corporations, which include Schedule M-3
filers.
13
A Schedule M-3 filer is required to report the worldwide income of
the entity represented in its financial statements and then follow a well-
defined series of steps—subtracting out income and losses of foreign and
U.S. entities that are included in the financial statements but not in
consolidated tax returns; adding in the income and losses of entities that
are included in consolidated tax returns but not in financial statements;
and making other adjustments to arrive at the book income of entities
included in the federal tax return.
Effective tax rates on corporate income can be defined in several ways,
each of which provides insights into a different issue. This report focuses
on average corporate effective tax rates, which are generally computed
as the ratio of taxes paid or tax liabilities accrued in a given year over the
12
This requirement became effective in December 2004. Prior to 2004, corporations were
required to reconcile their book net income with tax net income reporting on Schedule M-
1. However, concern over the growing difference observed between pretax book net
income and tax net income, as well as the lack of detail available from the Schedule M-1
on the sources of these differences, led to the development of the more extensive
reporting now required on Schedule M-3.
13
IRS Statistics of Income, Corporation Income Tax Returns Complete Report, data on all
active corporations include corporations filing tax forms 1120 (U.S. Corporation Income
Tax Return), 1120-L (U.S. Life Insurance Company Income Tax Return), 1120-PC (U.S.
Property and Casualty Insurance Company Income Tax Return), and 1120-F (U.S.
Income Tax Return of a Foreign Corporation). Schedule M-3 data include only
noninsurance corporations filing tax Form 1120. The Schedule M-3 data are a subset of
the data from the Corporation Income Tax Returns Complete Report.
Effective Tax Rates

Page 8 GAO-16-363 Corporate Income Tax
net income the corporation earned that year.
14
Average effective tax rates
attempt to measure taxes paid as a proportion of economic income. By
contrast, the marginal effective tax rate focuses on the tax burden
associated with a specific investment (usually over the full life of that
investment), and thus is a better measure of the effects that taxes have
on incentives to invest. Meanwhile, statutory rates determine the amount
of tax liability (before any credits) relative to taxable income, which is
defined by tax law and reflects tax benefits and subsidies built into the
law. The highest corporate statutory tax rate of 35 percent applies to most
large U.S. corporations in years that they report positive amounts of
taxable income.
To estimate average effective tax rates, analysts need two components:
1. The measure of tax liabilities to be used as the numerator. Common
measures include
• current book tax expense, including either only federal taxes or
worldwide taxes—federal, foreign, and U.S. state and local income
taxes paid by entities included in the federal tax return,
• total book tax expense, which includes the sum of current and
deferred taxes (again, either federal only or worldwide), and
14
Our average effective tax rates (ETRs) are averages in multiple senses. First, the rate
reflects the average tax paid on every dollar of a corporation’s net income (as opposed to
the tax on the marginal dollar of income earned). Second, given that we had access to
only aggregated IRS data, our ETR estimates represent averages across all of the
corporations in our different populations of analysis (either all Schedule M-3 filers or the
subpopulation of profitable Schedule M-3 filers). Finally, we also compute averages of
these ETRs over a number of years. To do so, we sum the aggregate tax expense and
pretax income amounts over the years reported. For all Schedule M-3 filers, we do so for
tax years 2006 to 2012. For profitable Schedule M-3 filers, we do so for tax years 2008 to
2012. The multiyear averages for profitable large corporations include a population of
corporations for each year for only those which were profitable in that year; they are not
averages for corporations that were profitable in every year.

Page 9 GAO-16-363 Corporate Income Tax
• actual tax paid, which is what corporations report as their income tax
liability after credits.
15
2. The measure of income to be used as the denominator. The typical
measure of income for effective tax rate estimates based on financial
statements has been some variant of pretax net book income, which
we use for all of our ETR estimates.
15
Deferred taxes represent estimated taxes that will be paid (or refunded) in a future year
as timing differences between book and tax reporting reverse themselves and unused
losses and credits that have been carried forward are recognized. Taxes that are reported
as deferred in one tax year are included in current tax expenses in future years (which is
why some studies choose to exclude deferred taxes from their ETR measures). Our
measure of actual worldwide taxes paid by entities included in the federal tax return
equals the sum of total federal income tax after credits, the amount of state and local
income tax deduction claimed on the return, and the foreign tax credit. As explained in
appendix I, we had to estimate the foreign tax credit for certain years.

Page 10 GAO-16-363 Corporate Income Tax
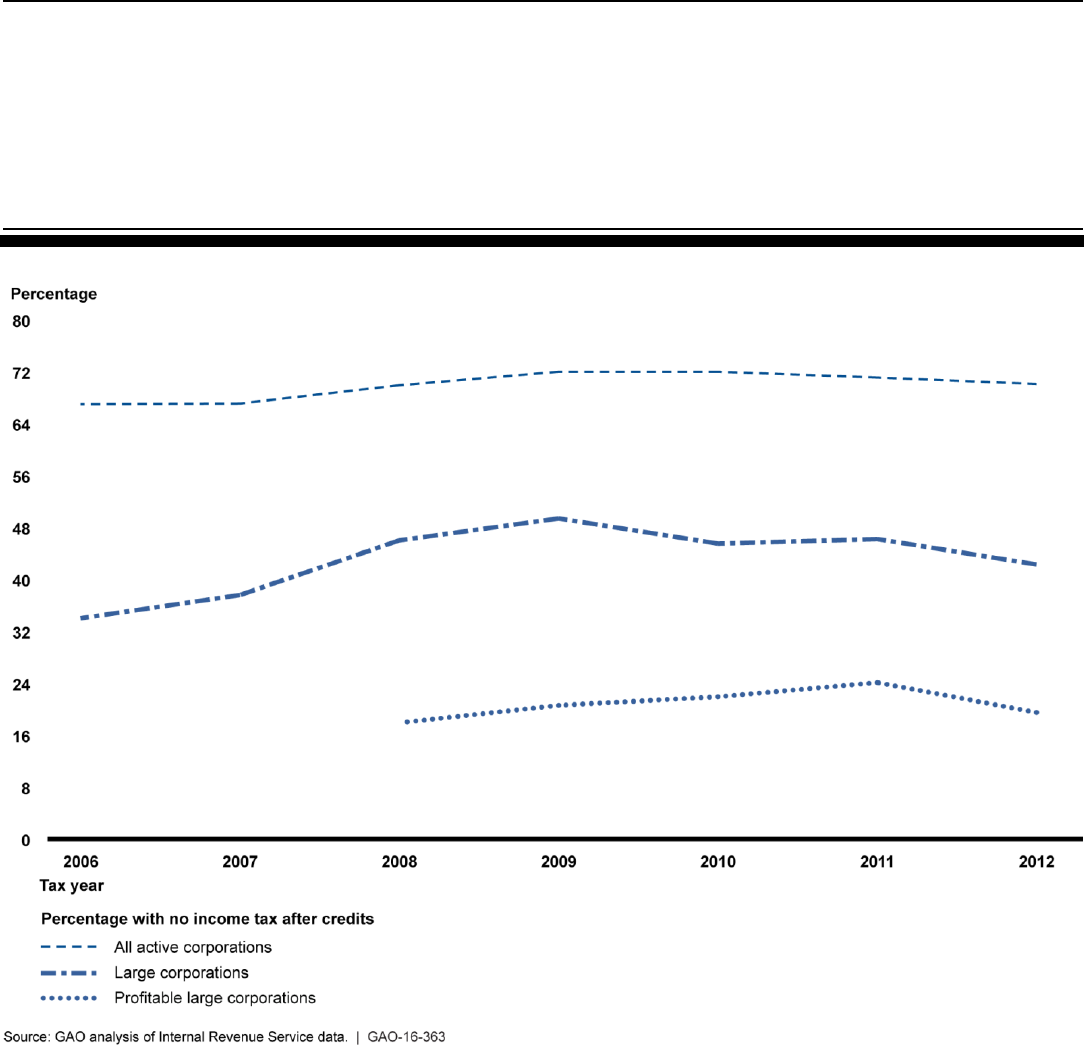
In each tax year from 2006 to 2012 at least two-thirds of active U.S.
corporations had no federal income tax liability after credits (see figure 2).
The percentage of such corporations with no tax liability remained
relatively stable, ranging between 67 and 72 percent during that
timeframe. In tax year 2012, 70.1 percent of the 1.62 million active
corporations had no federal income tax liability with the peak coming in
2009 near the end of the recession.
16
Among large corporations for 2012,
less than half—42.3 percent, or 17,882 returns—had no federal income
tax after accounting for tax credits.
17
Among profitable large corporations,
19.5 percent, or 5,359 returns, had no federal income tax liability in tax
year 2012. Corporations that did have a federal corporate income tax
liability for tax year 2012 owed $267.5 billion.
Corporations may pay no federal income tax for a number of reasons.
One important reason is that in each of the years from 2008 to 2012,
between approximately 49 to 54 percent of all active corporations had
negative net tax income based on federal tax accounting rules. Large
corporations were less likely to have incurred losses. In each year during
that period, between 34.9 percent and 44.2 percent of Schedule M-3 filers
had negative net tax income.
18
A second reason is that other corporations
16
Schedule M-3 filers generally have assets of $10 million or more. These filers are also
included in the top line of figure 2, showing all active corporations. When we subtracted
this subpopulation of Schedule M-3 filers out of that overall population, we found that the
remaining corporations (essentially those with assets of less than $10 million) had almost
the same likelihood of paying tax as the overall population. For example, in tax year 2012,
70.9 percent of corporations excluding Schedule M-3 filers had no federal tax liability after
credits compared to 70.1 percent for all corporations. See appendix III. We also divided
the subpopulation of Schedule M-3 filers into those with assets of less than $50 million
and those with assets of $50 million or more. We found that the group with lower assets
was slightly more likely to have paid no tax than the group with larger assets. For
example, in tax year 2012, 44.9 percent of corporations with total assets between $10
million and $50 million had no federal income tax liability, while 38.7 percent of
corporations with $50 million or more in total assets had no tax liability.
17
For purposes of this report, we refer to corporations which filed a Schedule M-3 as large
corporations. In general, corporations with $10 million or more in assets are required to file
a Schedule M-3. The percent of these corporations that had no federal income tax liability
was similar for all active corporations with at least $10 million in assets.
18
Many of these corporations may have had losses under both book and tax accounting
rules. In other cases, corporations may have been profitable under book accounting rules,
but had no net tax income because tax incentives, such as the bonus depreciation
allowance mentioned earlier, which could eliminate any positive net tax income without
affecting net book income. We are not able to quantify the effect that these incentives had
on the absence of tax liabilities.
In Each Year from
2006 to 2012, Most
Corporations Had No
Federal Income Tax
Liability, but a Majority
of Large Corporations
Did

Page 11 GAO-16-363 Corporate Income Tax
had positive net tax income that was completely offset by net operating
loss deductions (NOLD) carried forward from prior tax years. In each year
from 2008 to 2012, approximately 15 to 19 percent of all active
corporations had their income completely offset in this manner.
19
Similar
percentages of all and profitable large corporations had their income
completely offset by NOLDs from 2008 to 2012. The use of federal tax
credits appears to have had little effect on the number of corporations that
paid no tax in each year (this does not imply that these credits did not
significantly reduce the amount of tax that some corporations paid). For
all active corporations, federal tax credits increased the percentage of
corporations not paying tax by less than one percentage point each year.
Much the same was true for all and profitable large corporations (see
appendix III).
19
Any income remaining after the use of net operating loss deductions is known as taxable
income. Some corporations with no taxable income for regular income tax purposes may,
nevertheless, pay income tax in the form of the alternative minimum tax or one of the
other less common taxes included as part of total federal income tax.
Page 12 GAO-16-363 Corporate Income Tax
Figure 2: Percentage of Corporations That Reported No Tax Liability after Credits, Tax Years 2006 to 2012
Note: IRS Statistics of Income Corporation Income Tax Returns Complete Report data on all active
corporations include corporations filing tax forms 1120 (U.S. Corporation Income Tax Return), 1120-L
(U.S. Life Insurance Company Income Tax Return), 1120-PC (U.S. Property and Casualty Insurance
Company Income Tax Return), and 1120-F (U.S. Income Tax Return of a Foreign Corporation) while
Schedule M-3 data include only noninsurance corporations filing tax Form 1120. The Schedule M-3
data are a subset of the data from the Corporate Complete Report. In general, corporations with $10
million or more in assets are required to file a Schedule M-3.

Page 13 GAO-16-363 Corporate Income Tax
For tax year 2012, the actual U.S. federal income taxes paid by profitable
large corporations amounted to 16.1 percent of the income that those
corporations reported in their financial statements (for those entities
included in their tax returns); this federal effective tax rate averaged 14
percent from tax years 2008 to 2012 (see the first panel of figure 3).
20
This tax rate is slightly lower than the 17.3 percent rate based on the
current federal book tax expense, and the 18.5 percent rate based on
total federal book tax expenses for tax year 2012, which includes current
and deferred federal book tax expenses. Each averaged 15.3 percent and
18.6 percent, respectively, from tax years 2008 to 2012.
21
The subject matter experts with whom we spoke suggested it would be of
interest to estimate what profitable large corporations would have paid in
the current year if one did not take into account the deductions that
corporations are allowed to take for losses carried forward from prior
years. Adjusting for these net operating loss deductions (NOLD) raises
the effective rate of actual U.S. federal taxes paid to 19.5 percent in tax
20
For purposes of this report, we refer to corporations which filed a Schedule M-3 as large
corporations. In general, corporations with $10 million or more in assets are required to file
a Schedule M-3. See appendix IV for all effective tax rates we calculated.
21
For the sake of comparison with our May 2013 report, we also presented actual taxes
paid over taxable income; however, that measure is not a typical effective tax rate
because the income measure is reduced by various tax preferences. See GAO-13-520. All
of the rates we discuss above are significantly lower than the 24.6 percent rate of actual
taxes paid as a percentage of taxable income instead of pretax net book income.
Average ETRs for
Large Corporations,
Which Differed
Significantly from
Their Statutory Rates,
Increased Slightly
from 2010 to 2012
Average ETRs for Large
Profitable Corporations
Were Well Below Statutory
Rates, Even When
Deductions for Prior-Year
Losses Were Excluded

Page 14 GAO-16-363 Corporate Income Tax
year 2012 and averaged 16.5 percent from tax years 2008 to 2012.
22
These rates were 2.6 percentage points higher than the unadjusted rates
(see figure 3).
Even with the adjustment for NOLDs, these ETRs remain well below the
top statutory federal income tax rate of 35 percent for a number of
reasons. First, to the extent that corporations have foreign-source income
on which they have paid tax to foreign governments, their U.S. federal
income tax will be reduced by the foreign tax credit. Also, as noted earlier,
tax incentives, such as the bonus depreciation allowance, will cause
taxable income (on which the actual federal tax is based) to be less than
book income (which is the denominator of the ETR). Other types of
differences between financial statement and tax accounting can have the
same effect.
22
To make this adjustment, we multiplied the highest corporate statutory rate of 35 percent
by the NOLD amount claimed by profitable large corporations (Schedule M-3 filers) and
added that amount to the numerator of our measure. The result shows what the ETR on
current-year income would be if no NOLD had been available to offset any of that income.
Another approach would be to subtract the NOLD from the denominator, which would
show the ETR on the portion of current-year income that was not offset by prior-year
losses. Using this alternative approach, the federal “Actual taxes paid” ETR is 17.8
percent for tax year 2012 and averaged 15.1 percent from tax years 2008 to 2012. No
adjustment is required for losses that are carried backward because the tax return data
that we use do not include deductions for those losses.

Page 15 GAO-16-363 Corporate Income Tax
Figure 3: Average Effective Tax Rates for Profitable Large Corporations (Schedule M-3 Filers), Tax Years 2008 through 2012
Notes: The worldwide effective tax rates are based on the worldwide income and taxes—including
federal, foreign, and U.S. state and local income taxes—of entities included in the federal tax return.
The second panel of figure 3 presents ETRs that incorporate the
worldwide taxes of entities included in the federal tax returns of Schedule
M-3 filers. These worldwide ETRs for profitable large corporations ranged
between 3.5 and 8.7 percentage points higher than comparable federal
ETRs. For example, from tax years 2008 to 2012, the actual worldwide
taxes paid by profitable large corporations averaged 22.2 percent of the
income that those corporations reported in their financial statements (for
those entities included in their tax returns). As was the case with the
federal ETRs for profitable large corporations, the worldwide ETRs have

Page 16 GAO-16-363 Corporate Income Tax
increased somewhat since tax year 2010.
23
These measures do not
include income earned by foreign subsidiaries or the taxes that those
foreign subsidiaries pay, except in the cases where that income is
repatriated to U.S. corporations in the form of dividends or falls into
certain categories of income that are taxed immediately under federal tax
rules.
24
In our May 2013 report and in this report, we present ETR estimates for
all large corporations as well as for the population of profitable Schedule
M-3 filers.
25
Our estimates for profitable large corporations are not
intended to represent the tax burdens of all large corporations; their
purpose is to provide a more accurate picture of the tax burden for the
significant subpopulation of corporations that are profitable in a particular
year without the distortion caused by the losses of other corporations.
26
Profitable large corporations represented between 56 percent and 57
percent of all large corporations from 2008 through 2009; from 2010
through 2012, they represented between 64 percent and 65 percent of all
filers. Some of the past studies we identified in our May 2013 report and
during the course of this report have excluded unprofitable corporations;
others have not (see appendix II).
23
The peak in the effective tax rates based on total book tax in tax year 2011 in both figure
3 and figure 4 is due to a peak in the deferred federal tax expense in that year, which in
turn was likely due to the fact that the benefit of the bonus depreciation allowance peaked
in that year. Corporations had an added incentive to make a qualified investment in 2011,
increasing their deferred federal tax expenses in that year. In addition, investments in
2010 and 2012 were potentially artificially low because investments that might otherwise
have been made in those years would have been shifted into 2011.
24
Appendix I includes a discussion of how the complexity of U.S. tax rules pertaining to
foreign income and the limitations of the data available from Schedules M-3 complicate
the computation of worldwide ETRs.
25
GAO-13-520.
26
Appendix I includes a more detailed discussion of how losses complicate the
computation and interpretation of ETRs.

Page 17 GAO-16-363 Corporate Income Tax
In tax year 2012, all corporate returns with a Schedule M-3, including
those with current-year losses, paid actual U.S. federal income taxes
amounting to 21.2 percent of the income that they reported. Based on
current and total book tax expenses, these corporations had ETRs of 21.8
percent and 22.3 percent, respectively (see the first panel of figure 4). On
average, over tax years 2008 to 2012, all large corporations actually paid
25.9 percent of their pretax net income in U.S. federal income taxes.
The
inclusion of large corporations with losses raises federal ETRs between 3
and 15 percentage points higher than those of large profitable
corporations for years in which ETRs are calculated for both, including tax
years 2009 to 2012. This increase occurs because firms with current year
losses, which pay little if any actual tax, have a negligible effect on the
numerator of the ETR, but their losses can significantly reduce the pretax
net book income in the denominator. For example, in tax year 2009,
profitable large corporations had pretax net book income of $1.187 trillion,
while unprofitable large corporations had net current year losses of $619
billion, netting to a pretax book income of $568 billion. The inclusion of
large corporations with current year losses in that year more than doubles
the ETR based on actual federal taxes paid in comparison to the rate for
only profitable large corporations. In tax year 2008, the losses of
unprofitable large corporations more than completely offset the income of
profitable large corporations, resulting in negative pretax net book
income. Consequently, we were not able to compute ETRs for all large
corporations in that year.
From tax years 2008 to 2012, worldwide ETRs for all large corporations,
which includes federal, foreign, and state and local taxes paid by entities
included in federal tax returns, ranged between almost 5 to more than 16
percentage points greater than comparable federal ETRs for all large
corporations (see figure 4). Over those tax years, ETRs averaged 40
percent when foreign and state and local taxes are included.
The Inclusion of Large
Corporations with Current-
Year Losses Raises the
Average Effective Tax
Rates but Makes Those
Rates Difficult to Interpret

Page 18 GAO-16-363 Corporate Income Tax
Figure 4: Average Effective Tax Rates for All Large Corporations (Schedule M-3 Filers), Tax Years 2006 through 2012
Notes: The worldwide effective tax rates are based on the worldwide income and taxes—including
federal, foreign, and U.S. state and local income taxes—of entities included in the federal tax return.
We did not compute effective tax rates for all corporations for tax year 2008 because aggregate
pretax net book income was negative that year.

Page 19 GAO-16-363 Corporate Income Tax
We provided a draft of this report to the Commissioner of Internal
Revenue for review and comment. IRS provided technical comments,
which were incorporated, as appropriate.
As agreed with your office, unless you publicly announce the contents of
this report earlier, we plan no further distribution until 30 days from the
report date. At that time, we will send copies to the Chairmen and
Ranking Members of other Senate and House committees and
subcommittees that have appropriation, authorization, and oversight
responsibilities for IRS. We will also send copies of the report to the
Commissioner of Internal Revenue and other interested parties. In
addition, this report will be available at no charge on the GAO website at
http://www.gao.gov.
If you or your staff have any questions or wish to discuss the material in
this report further, please contact me at (202) 512-9110 or
[email protected]. Contact points for our Offices of Congressional
Relations and Public Affairs may be found on the last page of this report.
Key contributors to this report are listed in appendix V.
Sincerely Yours
Jessica Lucas-Judy
Acting Director, Tax Issues
Strategic Issues
Agency Comments
and Our Evaluation

Appendix I: Selected Issues Relating to the
Calculation of Effective Corporate Income Tax
Rates
Page 20 GAO-16-363 Corporate Income Tax
In this report, we present effective tax rate (ETR) estimates for both
profitable and all corporations. As we noted, the first set of estimates
provides meaningful information for an important population of firms
without the distortion caused by the losses of other corporations. The
second set of estimates covers a more comprehensive population of
firms; however, an ETR is not meaningful for a corporation in a year in
which it has a net loss. Consequently, it is not clear how to interpret
average ETRs for populations that include some corporations with net
income and others with net losses for a given year. The simplified
example in table 1 demonstrates the nature of this problem. In this
example, Corporation A is profitable in all years, while Corporation B
incurs losses in the first 2 years, which it then offsets against its income in
the third year.
1
A weighted average ETR based on the combined data for
the two corporations for all 3 years provides an accurate representation at
the aggregate level of the tax burden on income earned in those 3 years
(35 percent). However, when the time period is limited so that not all
losses can be used during the period, the estimates do not give an
accurate representation of the longer term rates. The average for the first
2 years (70 percent) overstates the burden because it does not include
the income against which Corporation B’s losses during these 2 years is
actually offset. Instead, those losses offset a completely different
corporation’s income. Conversely, the average for the last 2 years (26.3
percent) understates the burden over the 3-year period because losses
incurred outside of the 2-year period are used to reduce tax payments
during the period. The types of distortions shown in this example arise at
the beginning and end of any finite period of analysis.
1
In order to focus on the effects of loss carryforwards, we assume that there are no
differences between book and taxable income other than these carryforwards, and we
apply a statutory tax rate of 35 percent, ignoring any tax credits. Also in this example, all
losses incurred during this period are used during the period and no losses are carried
into the period from other years.
Appendix I: Selected Issues Relating to the
Calculation of Effective Corporate Income Tax
Rates
The Inclusion of
Corporations with
Losses in Effective
Tax Rate Estimates

Appendix I: Selected Issues Relating to the
Calculation of Effective Corporate Income Tax
Rates
Page 21 GAO-16-363 Corporate Income Tax
Table 1: Example of How Losses Can Distort Effective Tax Rate Estimates
Computation of weighted average effective tax rates
Year 1
Year 2
Year 3
All years
First 2 years
Last 2 years
Corporation A
Current-year net income/loss
$200
200
100
500
400
300
Loss used as a carryforward
-
-
-
-
-
-
Taxable income
200
200
100
500
400
300
Tax at 35 percent rate
70
70
35
175
140
105
A's ETR (tax/ current-year net
income)
35.0 %
35.0 %
35.0 %
35.0 %
35.0 %
35.0 %
Corporation B
Current-year net income/loss
$(100)
(100)
400
200
(200)
300
Loss used as a carryforward
-
-
(200)
-
-
-
Taxable income
-
-
200
200
-
300
Tax at 35 percent rate
-
-
70
70
-
70
B's ETR (tax/ current-year net
income)
not meaningful
not meaningful
17.5 %
35%
not meaningful
23.3 %
Corporation A and B
Aggregate
Current-year net income/loss
$100
100
500
700
200
600
Tax paid
70
70
105
245
140
175
ETR (tax/ current-year net
income)
70.0 %
70.0
21.0
35.0
70.0
29.2
Source: Hypothetical example developed by GAO. I GAO-16-363
Notes: This example and the related discussion originally appeared in an article in Tax Notes. See
James A. Wozny, “GAO Official Defends Agency Report Numbers,” Tax Notes, Nov. 25, 2013. In the
columns where the averages are computed, the losses are counted only once (either as a reduction
in the current-year income/loss line or as a carryforward, not both). For example, Corporation B’s loss
carryforward in year 3 is not included in the last column because only $100 of the losses were
incurred in the last 2 years and that portion has already reduced the current-year net income amount
in that last column.
In this report, the ETRs that we label “actual taxes paid” for profitable
corporations reflect the taxes that those corporations actually reported on
their tax returns in a particular year as a percentage of their net book
income for that year. Alternatively, there are two ways to estimate ETRs
that exclude the effect that prior-year losses have on tax payments. One
approach would be to multiply the amount of prior-year losses that
corporations deducted on their tax returns by the statutory tax rate and
then add that tax amount to the numerator of the ETR. The resulting
estimate would show what the ETR on current-year income would be if no
net operating loss deductions (NOLD) had been available to offset any of
that income. A second alternative for removing the effect of prior-year

Appendix I: Selected Issues Relating to the
Calculation of Effective Corporate Income Tax
Rates
Page 22 GAO-16-363 Corporate Income Tax
losses would be to reduce pretax net book income in the denominator by
the amount of NOLDs used in that year.
2
The estimate that results from
this approach shows the ETRs on the portion of current-year income that
was not offset by prior-year losses. As seen in table 2, compared with our
original actual taxes paid ETRs for profitable corporations, the estimates
that are adjusted for NOLDs are slightly higher. None of these ETRs for
corporations that are profitable in a given year is meant to represent the
tax burden averaged across all corporations (both profitable and
unprofitable ones).
Table 2: Alternative Calculations of Corporate Effective Tax Rates for Profitable Large Corporations (Schedule M-3 Filers),
Incorporating Net Operating Loss Deductions (NOLD), Tax Years 2008 to 2012
Original GAO Estimate of
Effective Tax Rates
Alternative 1: NOLD multiplied by 35
percent added to numerator
Alternative 2:
NOLD subtracted
from denominator
Actual U.S. federal tax paid over book
income
14%
16.5
15.1
Actual worldwide tax paid over book
income
22.2
24.6
23.8
Source: GAO analysis of IRS data for Schedule M-3 filers. I GAO-16-363
Note: The worldwide actual tax paid ETRs for profitable corporations are averages of tax-year 2010 to
2012 values because the foreign tax credit value is not available for tax years 2008 and 2009. The
worldwide effective tax rates are based on the worldwide income and taxes—including federal,
foreign, and U.S. state and local income taxes—of entities included in the federal tax return.
In commenting on our May 2013 report on ETRs, at least one person
stated that ETRs for the full population of corporations are more
appropriate for policymakers.
3
In our view, the choice of which ETR
measure to examine depends on the specific question being considered.
2
The Schedule M-3 data that we had only separate out the NOLD amount between
profitable and loss corporations for tax years 2010 through 2012. For tax years 2008 and
2009, we took the average percentage that profitable NOLD amounts made up of the total
amount reported for all corporations from tax years 2010 to 2012, and multiplied that
average percentage by the total NOLD amount for tax years 2008 and 2009, which we
then used to adjust either the numerator or denominator of our ETR estimates above. The
profitable NOLD amount accounted for 88, 78, and 83 percent of the total NOLD amount
from tax years 2010 to 2012, respectively, and averaged 83 percent over those 3 years.
3
GAO, Corporate Income Tax: Effective Tax Rates Can Differ Significantly from the
Statutory Rate, GAO-13-520 (Washington, D.C.: May 30, 2013); and Andrew B. Lyon,
“Another Look at Corporate Effective Tax Rates, 2004-2010,” Tax Notes (Oct. 21, 2013).

Appendix I: Selected Issues Relating to the
Calculation of Effective Corporate Income Tax
Rates
Page 23 GAO-16-363 Corporate Income Tax
In many cases it is more instructive to examine the distribution of ETRs
across different subpopulations of corporations.
4
With detailed taxpayer-
level data one might track individual corporations from year to year to
address timing issues relating to losses. We did not have access under
the law to such data for this report.
The scope of the data available to us from Schedule M-3 and Form 1120
limited our ability to estimate worldwide ETRs for the large corporations
(Schedule M-3 filers). As noted above, our estimated worldwide ETRs
represent the burden of taxes paid and income received by entities that
are included in federal tax returns. These measures do not include
income earned by foreign subsidiaries or the taxes that those foreign
subsidiaries pay, except in the cases where that income is repatriated to
U.S. corporations in the form of dividends or falls into certain categories
of income that are taxed immediately under federal tax rules. In the
remainder of this section, we compare the data on worldwide taxes
available to us for this report with the data we used for our previous
report.
First, we need to describe some of the relevant U.S. tax rules applying to
foreign-source income. The United States taxes domestic corporations on
their worldwide income, regardless of where it is earned. A U.S.
corporation may directly or indirectly own shares of stock of other
corporations both foreign and domestic; if the U.S. corporation owns all or
a significant number of shares of stock, it may be considered a parent
and the other corporation a subsidiary. In general, a U.S. taxpayer who
owns stock in a corporation is not taxed on income earned by the
corporation when it is earned, but taxed when it is distributed to the
taxpayer, such as in the form of dividends. When the taxpayer is a U.S.
corporation and it owns shares of a foreign corporation in a jurisdiction
with a lower corporate tax rate than that of the United States, this can
4
In an earlier study, we found considerable variation in the U.S. ETR on the domestic
income of large corporations for tax year 2004. At one extreme 32.9 percent of the
taxpayers had ETRs of 10 percent or less, and at the other extreme, 25.6 percent of
taxpayers had ETRs higher than 50 percent. See GAO, U.S. Multinational Corporations:
Effective Tax Rates Are Correlated With Where Income Is Reported, GAO-08-950
(Washington, D.C.: Aug. 12, 2008).
Calculating
Worldwide Effective
Tax Rates

Appendix I: Selected Issues Relating to the
Calculation of Effective Corporate Income Tax
Rates
Page 24 GAO-16-363 Corporate Income Tax
result in what is known as deferral.
5
However, the Internal Revenue Code
(IRC) has antideferral provisions which limit deferral in certain
circumstances. For example, if a foreign entity is a Controlled Foreign
Corporation, as defined in statute, then certain U.S. shareholders, such
as parent corporations, are taxed on their share of certain income earned
by the Controlled Foreign Corporation when it is earned.
6
The income of a
Controlled Foreign Corporation to be included in U.S. shareholders’
income includes the income defined in subpart F (often called Subpart F
income) and earnings of the Controlled Foreign Corporation invested in
U.S. property. Major types of Subpart F income include income from
passive investments, income from transactions with entities related to the
Controlled Foreign Corporation, and insurance income as well as certain
other easily manipulated income, which are ineligible for deferral. When
income is deemed to be received by the U.S. corporation in this way, it
may have already been taxed in the foreign country where it was earned.
The IRC allows U.S. parent corporations to claim a foreign tax credit for
taxes paid to other countries so that foreign source income, such as
repatriated dividends and Subpart F income, is not taxed twice. This
results in U.S. corporations paying federal income tax on foreign-source
income only to the extent that the federal income tax on that income
exceeds the foreign tax credit. Section 78 of the IRC requires U.S.
corporations electing to claim the foreign tax credit to “gross-up” (i.e.,
increase) their dividend income by the amount of creditable foreign
income taxes associated with the dividends they received. Similar
requirements apply to Subpart F income.
7
5
In general, individuals as shareholders get the benefits of deferral when owning shares of
both domestic and foreign corporations. U.S. corporations as shareholders can deduct the
full amount of qualified dividends received from domestic shareholders. So while deferral
exists, it provides limited to no tax benefit in that circumstance.
6
An entity is a Controlled Foreign Corporation if “U.S. shareholders” own more than 50
percent of the total combined voting power of its stock, or more than 50 percent of the
stock’s total value. To be considered a “U.S. shareholder” for the purposes of this
definition, a U.S. person must own at least 10 percent of the total combined voting power
of the corporation’s stock. In calculating ownership, direct, indirect, and constructive
ownership are considered. U.S. persons are deemed to own stock held by their wholly
owned subsidiaries or by certain other related persons. 26 U.S.C. §§ 951, 957.
7
26 U.S.C. § 78. A U.S. corporation that owns at least 10 percent of the voting stock of a
foreign corporation is allowed to take an indirect credit for foreign income taxes associated
with certain dividends it receives from that foreign corporation or is deemed to have
received under Subpart F. 26 U.S.C. §§ 902, 960.

Appendix I: Selected Issues Relating to the
Calculation of Effective Corporate Income Tax
Rates
Page 25 GAO-16-363 Corporate Income Tax
For our prior report we did not have data relating to the amount of foreign
tax credits claimed by our population of profitable large corporations.
8
As
a substitute for the amount of foreign taxes paid, we used the current
foreign tax expenses and foreign withholding tax expenses that the
taxpayers reported in their financial statements. In the case of repatriated
dividends, our measure included foreign taxes paid on the dividends
themselves, but not any foreign tax paid on the subsidiaries’ income out
of which the dividends were paid. In the latest data we obtained from the
Internal Revenue Service (IRS), we do have amounts for the foreign tax
credits claimed in 2012 by the profitable corporations. The new data also
enabled us to make reliable estimates of the foreign tax credits claimed in
2010 and 2011; however, we could not make similar estimates for earlier
years.
9
Although this new measure includes the most comprehensive measure of
foreign taxes available in our database, it does not achieve a perfect
alignment between the taxes included in the numerator and the income
8
GAO-13-520.
9
We estimated the foreign tax credit amount for tax years 2010 and 2011 for profitable
corporations by using IRS data on Tax Before Credits, General Business Credit, and Tax
Less Credits. We know that Tax Less Credits equals Tax Before Credits minus General
Business Credit, Foreign Tax Credit, and Other Tax Credits. In addition, we know the
amount of Other Tax Credits for the full population of Schedule M-3 filers. This amount is
relatively small each year and it represents the maximum potential value of Other Tax
Credits for our population of profitable filers. The minimum potential value is zero. We
used all of this information to determine the upper- and lower-bound potential values of
the amount of Foreign Tax Credit claimed by profitable filers. The gap between these two
bounds is very small and we used the midpoint between the bounds for our estimate. We
could not make similar estimates for tax years 2008 and 2009 because the General
Business Credit data were not available. As a substitute for the Foreign Tax Credit for
those 2 years, we used the sum of the current foreign tax expenses and foreign
withholding tax expenses from financial statements and the section 78 gross-up. For the 3
years for which we had the foreign tax credit data, these two alternative measures had
relatively similar values. The worldwide ETRs based on foreign tax credit data were 21.1
percent, 21.8 percent, and 23 percent in 2010 through 2012 for profitable corporations,
respectively. The comparable ETRs based on the alternative measure of foreign taxes
were 21.1 percent, 21.6 percent, and 23.6 percent, respectively. The foreign tax credit
amount for all corporations included in the Schedule M-3 data was available for tax years
2006 to 2012 and we used these data for this population (in our May 2013 report, for the
sake of consistency, we used only data that were available for both of our populations).

Appendix I: Selected Issues Relating to the
Calculation of Effective Corporate Income Tax
Rates
Page 26 GAO-16-363 Corporate Income Tax
included in the denominator.
10
Nevertheless, after discussions with
analysts from IRS and Department of the Treasury, we concluded that
this new measure represents the closest alignment between income and
the taxes paid thereon that is possible with the aggregated Schedule M-3
data available to us. More importantly, as we mentioned in the body of
our report, regardless of the adjustments we make above, our worldwide
ETR estimates do not represent a comprehensive worldwide ETR. They
do not account for income not repatriated by Controlled Foreign
Corporations and the foreign taxes paid on that income. Data do not exist
to measure both the complete worldwide income of U.S. corporate groups
and the actual taxes that they pay. A truly comprehensive rate could be
either higher or lower than the ones we report. The rate of foreign tax paid
on income that Controlled Foreign Corporations choose to repatriate may
be higher than the rate paid on foreign income that is not repatriated.
Since the U.S. tax system provides a foreign tax credit to U.S.
corporations on foreign taxes paid when income is repatriated, it may
create an incentive for Controlled Foreign Corporations to repatriate
income earned in high tax countries, so that U.S. parent corporations can
claim the full foreign tax credit amount. In contrast, as the foreign tax rate
decreases, the U.S. tax due when the income is repatriated increases,
creating a disincentive to repatriate income earned in low tax countries.
10
The misalignment arises because (1) subpart F income is not included in the net book
income of these Schedule M-3 filers, but some residual federal tax paid on that income is
included in our numerator; and (2) net book income includes some foreign-source
dividends that were subject to federal tax in a previous year, and that tax is not included in
our numerator. These two discrepancies work in opposite directions.

Appendix II: Summary of Selected Past
Estimates of Average Effective Tax Rates
Based on Financial Statement Data
Page 27 GAO-16-363 Corporate Income Tax
We used the criteria in our May 2013 report for selecting studies that
included estimates of corporate effective tax rates (ETR).
1
Specifically, a
study had to have (1) used financial statement data to estimate average
ETRs for U.S. corporations, (2) employed pretax worldwide book income
as the denominator of its ETR calculations, and (3) covered at least one
tax year since 2001. In the previous report, these criteria identified eight
studies.
• PricewaterhouseCoopers LLP, Global Effective Tax Rates. April 14,
2011.
• Markle, Kevin S. and Douglas A. Shackelford (1). “Cross-Country
Comparisons of Corporate Income Taxes.” National Tax Journal, vol.
65, no. 3. 2012: 493-528.
• Costa, Melissa and Jennifer Gravelle, “Taxing Multinational
Corporations: Average Tax Rates.” Symposium on International
Taxation and Competitiveness, 65 Tax L. Rev. 391. 2012.
• Lee, Namryoung and Charles Swenson. “Is It a Level Playing Field?
An Analysis of Effective Tax Rates.” Tax Notes International. May 25,
2009: 685-693.
• Markle, Kevin S. and Douglas Shackelford (2). Do Multinationals or
Domestic Firms Face Higher Effective Tax Rates? National Bureau of
Economic Research, Working Paper 15091. June 2009.
http://www.nber.org/papers/w15091.
• Blouin, Jennifer L. and Irem Tuna. Tax Contingencies: Cushioning the
Blow to Earnings? Working Paper. April 2007.
• Hanlon, Michelle and Edward L. Maydew. “Book-Tax Conformity:
Implications for Multinational Firms.” National Tax Journal, vol. 62, no.
1. March 2009: 127-153.
• Dyreng, Scott D., Michelle Hanlon, and Edward L. Maydew. “Long-
Run Corporate Tax Avoidance,” The Accounting Review, vol. 83, no.
1. 2008: 61-82.
For our report, we searched for studies released after March 2013. Our
search yielded the following seven:
• Dyreng, Scott D., Michelle Hanlon, Edward L. Maydew, and Jacob R.
Thornock. Changes in Corporate Effective Tax Rates Over the Past
Twenty-Five Years. Social Science Research Network. October 2014:
1-58. Accessed October 8, 2015. http://ssrn.com/abstract=2521497.
1
GAO, Corporate Income Tax: Effective Tax Rates Can Differ Significantly from the
Statutory Rate, GAO-13-520 (Washington, D.C.: May 30, 2013).
Appendix II: Summary of Selected Past
Estimates of Average Effective Tax Rates
Based on Financial Statement Data

Appendix II: Summary of Selected Past
Estimates of Average Effective Tax Rates
Based on Financial Statement Data
Page 28 GAO-16-363 Corporate Income Tax
• Blouin, Jennifer. “Defining and Measuring Tax Planning
Aggressiveness.” National Tax Journal, vol. 67, no. 4. 2014:875-900.
• Hope, Ole-Kristan, Mark (Shuai) Ma, and Wayne B. Thomas. “Tax
Avoidance and Geographic Earnings Disclosure.” Journal of
Accounting and Economics, vol. 56. 2013:170-189.
• Jiménez-Angueira, Carlos and Larry Ochoa, “The Determinants and
Market Implications of Long-run Effective Tax Rates.” The Journal of
Theoretical Accounting Research, vol. 9.2. Spring 2014: 58-106.
• Markle, Kevin S. and Douglas A. Shackelford. The Impact of
Headquarter and Subsidiary Locations on Multinationals’ Effective Tax
Rates. National Bureau of Economic Research Working Paper 19621.
November 2013. Accessed October 1, 2015.
http://www.nber.org/papers/w19621.
• Carlos Jiménez-Angueira. “The Effect of Tax Regime Changes on the
Market Valuation of Tax Avoidance?” Journal of Finance and
Accountancy, vol. 15. April 2014: 1-20.
• Crabtree, Aaron D. and Thomas R. Kubick, “Corporate Tax Avoidance
and the Timeliness of Annual Earnings Announcements,” Review of
Quantitative Finance and Accounting, vol. 42. January 2014: 51-67.
As indicated in figure 5, these studies used a variety of measures of
worldwide taxes for their numerator in order to calculate their respective
corporate effective tax rates. Four of the seven studies we identified
excluded corporations with negative book income from their ETR
calculations.
2
It is difficult to make close comparisons between our results
and estimates from those of prior studies based on financial statement
data below because most of the latter estimates are averaged over
multiple years for which we have no data.
2
The four articles are those from Hope, Ma, and Thomas, Crabtree and Kubick, Blouin,
and Dyreng, Hanlon, Maydew, and Thornock. The Blouin article removes firms with
cumulative losses for the period in which effective tax rates are calculated. The Dyreng,
Hanlon, Maydew, and Thornock article removes firms with negative pretax income.

Appendix II: Summary of Selected Past
Estimates of Average Effective Tax Rates
Based on Financial Statement Data
Page 29 GAO-16-363 Corporate Income Tax
Figure 5: Average Effective Tax Rates for Selected Studies on U.S. Companies, Using Worldwide Pretax Net Book Income
Note: The Jiménez-Angueira study excludes 2001 to 2002 from its effective tax rate computations.
The Hope, Ma & Thomas study reports effective tax rates for pre- and post-issuance of Statement of
Financial Accounting Standards No.131. It also breaks out effective tax rates for firms that disclose
their geographic earnings and those that do not. We report the effective tax rate from this study for

Appendix II: Summary of Selected Past
Estimates of Average Effective Tax Rates
Based on Financial Statement Data
Page 30 GAO-16-363 Corporate Income Tax
firms that no longer disclose geographic earnings in the post-period because the sample of these
firms is larger and the effective tax rate calculations are more recent.

Appendix III: Number and Percentage of U.S.
Corporations with No Federal Income Tax
Liability from Tax Years 2006 to 2012
Page 31 GAO-16-363 Corporate Income Tax
The following two tables present data on the number of corporations with
and without federal income tax liability for tax years 2006 to 2012. Data
are presented for all active corporations as well as all and profitable large
corporations that filed a Schedule M-3.
Table 3: Number and Percentage of All Corporations With No Tax Liability After Credits, Tax Years 2006 through 2012
Tax year
All active corporations (in millions)
2006
2007
2008
2009
2010
2011
2012
Number of Corporations
1.96
1.87
1.78
1.72
1.67
1.65
1.62
Number of Corporations with No Total Income Tax After Credits
1.31
1.25
1.25
1.24
1.20
1.17
1.13
Percentage of Corporations with No Total Income Tax After Credits
67.0%
67.1
69.9
72.0
72.0
71.1
70.1
All active corporations excluding Schedule M-3 filers (in millions)
Number of Corporations
1.91
1.82
1.74
1.68
1.63
1.61
1.58
Number of Corporations with No Total Income Tax After Credits
1.30
1.23
1.23
1.22
1.18
1.15
1.12
Percentage of Corporations with No Total Income Tax After Credits
67.7%
67.7
70.4
72.6
72.7
71.8
70.9
Source: GAO analysis of IRS data. l GAO-16-363
Notes: These data include forms1120 (U.S. Corporation Income Tax Return), 1120-L (U.S. Life
Insurance Company Income Tax Return), 1120-PC (U.S. Property and Casualty Insurance Company
Income Tax Return), and 1120-F (U.S. Income Tax Return of a Foreign Corporation). They do not
include certain “pass-through” entities, which file on forms 1120-REIT (U.S. Income Tax Return for
Real Estate Investment Trusts), 1120-RIC (U.S. Income Tax Return for Regulated Investment
Companies), and 1120S (U.S. Income Tax Return for an S Corporation). See
https://www.irs.gov/uac/SOI-Tax-Stats-Corporation-Complete-Report.
Appendix III: Number and Percentage of
U.S. Corporations with No Federal Income
Tax Liability from Tax Years 2006 to 2012

Appendix III: Number and Percentage of U.S.
Corporations with No Federal Income Tax
Liability from Tax Years 2006 to 2012
Page 32 GAO-16-363 Corporate Income Tax
Table 4: Number and Percentage of All and Profitable Large Corporations (Schedule M-3 filers) with No Federal Tax Liability
After Credits, Tax Years 2006 through 2012
Tax year
All large corporations
2006
2007
2008
2009
2010
2011
2012
Number of Corporations
40,713
42,395
41,537
39,846
40,740
41,636
42,301
Number of Corporations with No Total Income Tax After
Credits
13,836
15,945
19,123
19,687
18,537
19,237
17,882
Percentage of Corporations with No Total Income Tax
After Credits
34.0%
37.6
46.0
49.4
45.5
46.2
42.3
Profitable large corporations
Number of Corporations
n/a
n/a
23,756
22,504
25,896
26,876
27,546
Number of Corporations with No Total Income Tax After
Credits
n/a
n/a
4,260
4,639
5,674
6,479
5,359
Percentage of Corporations with No Total Income Tax
After Credits
n/a
n/a
17.9%
20.6
21.9
24.1
19.5
Source: GAO analysis of IRS data for Schedule M-3 filers. l GAO-16-363
Notes: The Schedule M-3 data consists of Form 1120 (U.S. Corporation Income Tax Return) non-
insurance returns with assets of $10 million or more. Schedule M-3 data do not break out profitable
Schedule M-3 filers before tax year 2008.

Appendix IV: Average Federal and Worldwide
Effective Tax Rates for Varying Populations of
Large Corporations (Schedule M-3 Filers)
Page 33 GAO-16-363 Corporate Income Tax
The following two tables present effective tax rate estimates for all and
profitable large corporations that filed a Schedule M-3. We present
effective tax rates for all large corporations for tax years 2006 through
2012 and for profitable large corporations for tax years 2008 to 2012.
Table 5: Average Effective Tax Rates for Profitable Large Corporations (Schedule
M-3 Filers), Tax Years 2008 through 2012
Tax year
2008
2009
2010
2011
2012
2008 to
2012
(Average)
Federal Effective Tax Rates
Total book tax
20.7%
17.5
17.0
19.8
18.5
18.6
Current book tax
17.6
13.8
13.1
15.2
17.3
15.3
Actual tax paid
15.3
13.0
12.6
13.1
16.1
14.0
Actual tax paid adjusted for net
operating loss deduction
17.3
15.5
15.0
15.4
19.5
16.5
Worldwide Effective Tax Rates of Entities Included in the
Federal Income Tax Return
Total book tax
26.2%
22.0
21.5
25.2
22.0
23.3
Current book tax
22.8
18.0
17.4
20.2
21.1
19.8
Actual tax paid
24.0
21.2
21.1
21.8
23.0
22.2
Actual tax paid adjusted for net
operating loss deduction
26.0
23.6
23.4
24.1
26.3
24.6
Source: GAO analysis of IRS data for Schedule M-3 filers. l GAO-16-363
Notes: The worldwide effective tax rates are based on the worldwide income and taxes—including
federal, foreign, and U.S. state and local income taxes—of entities included in the federal tax return.
The measure of pretax net book income used in computing these rates is equal to worldwide net book
income plus the total tax expense. The foreign tax credit value is not available for that subpopulation
of profitable corporations in tax year 2008 and 2009 and instead we use the sum of the current
foreign tax expense and foreign withholding tax expense plus the section 78 gross-up.
Appendix IV: Average Federal and Worldwide
Effective Tax Rates for Varying Populations of
Large Corporations (Schedule M-3 Filers)

Appendix IV: Average Federal and Worldwide
Effective Tax Rates for Varying Populations of
Large Corporations (Schedule M-3 Filers)
Page 34 GAO-16-363 Corporate Income Tax
Table 6: Average Effective Tax Rates for All Large Corporations (Schedule M-3
Filers), Tax Years 2006 through 2012
Tax year
2006
2007
2008 2009 2010 2011
2012
2006 to
2012
(Average)
2008 to
2012
(Average)
Federal Effective Tax Rates
Total book tax
25.5%
29.9
n/a
24.2
19.9
28.5
22.3
27.5
27.6
Current book
tax
25.0
30.6
n/a
22.1
16.4
22.4
21.8
25.7
24.7
Actual tax
paid
22.4
29.3
n/a
28.4
16.6
19.9
21.2
25.7
25.9
Worldwide Effective Tax Rates of Entities Included in the Federal Income Tax
Return
Total book tax
31.0%
36.9
n/a
34.1
26.2
36.8
27.1
35.2
36.2
Current book
tax
30.7
37.8
n/a
31.9
22.3
30.3
27.1
33.5
33.4
Actual tax
paid
30.3
39.9
n/a
44.9
27.7
32.6
30.3
38.1
40.1
Source: GAO analysis of IRS data for Schedule M-3 filers. l GAO-16-363
Notes: The worldwide effective tax rates are based on the worldwide income and taxes—including
federal, foreign, and U.S. state and local income taxes—of entities included in the federal tax return.
The measure of pretax net book income used in computing these rates is equal to worldwide net book
income plus the total tax expense. Effective tax rates for all corporations were not computed for tax
year 2008 because pretax net book income is negative.

Appendix V: GAO Contact and Staff
Acknowledgments
Page 35 GAO-16-363 Corporate Income Tax
In addition to the contact named above, James Wozny, Assistant
Director, Lissette Baylor, Karen O’Conor, Robert Gebhart, Donna Miller,
Ed Nannenhorn, Alan Rozzi, A.J. Stephens, Jennifer Stratton, and Jason
Vassilicos made significant contributions to this report.
Appendix V: GAO Contact and Staff
Acknowledgments
Contact
Staff
Acknowledgments
(100252)

The Government Accountability Office, the audit, evaluation, and
investigative arm of Congress, exists to support Congress in meeting its
constitutional responsibilities and to help improve the performance and
accountability of the federal government for the American people. GAO
examines the use of public funds; evaluates federal programs and
policies; and provides analyses, recommendations, and other assistance
to help Congress make informed oversight, policy, and funding decisions.
GAO’s commitment to good government is reflected in its core values of
accountability, integrity, and reliability.
The fastest and easiest way to obtain copies of GAO documents at no
cost is through GAO’s website (http://www.gao.gov). Each weekday
afternoon, GAO posts on its website newly released reports, testimony,
and correspondence. To have GAO e-mail you a list of newly posted
products, go to http://www.gao.gov and select “E-mail Updates.”
The price of each GAO publication reflects GAO’s actual cost of
production and distribution and depends on the number of pages in the
publication and whether the publication is printed in color or black and
white. Pricing and ordering information is posted on GAO’s website,
http://www.gao.gov/ordering.htm.
Place orders by calling (202) 512-6000, toll free (866) 801-7077, or
TDD (202) 512-2537.
Orders may be paid for using American Express, Discover Card,
MasterCard, Visa, check, or money order. Call for additional information.
Connect with GAO on Facebook, Flickr, Twitter, and YouTube.
Subscribe to our RSS Feeds or E-mail Updates.
Listen to our Podcasts and read The Watchblog.
Visit GAO on the web at www.gao.gov.
Contact:
Website: http://www.gao.gov/fraudnet/fraudnet.htm
E-mail: fr[email protected]
Automated answering system: (800) 424-5454 or (202) 512-7470
Katherine Siggerud, Managing Director, [email protected], (202) 512-
4400, U.S. Government Accountability Office, 441 G Street NW, Room
7125, Washington, DC 20548
Chuck Young, Managing Director, youngc1@gao.gov, (202) 512-4800
U.S. Government Accountability Office, 441 G Street NW, Room 7149
Washington, DC 20548
GAO’s Mission
Obtaining Copies of
GAO Reports and
Testimony
Order by Phone
Connect with GAO
To Report Fraud,
Waste, and Abuse in
Federal Programs
Congressional
Relations
Public Affairs
Please Print on Recycled Paper.
