Table of Contents
Chapter Page
1 Su
rvey Introduction ...................................................................................................... 1
Overview ....................................................................................................................... 1
Uses of Survey Results .................................................................................................. 3
2 Sample Design and Selection ........................................................................................ 4
Sample Design ............................................................................................................... 4
Sampling Frame and Stratification Variables ................................................................ 4
3 Survey Instrument ........................................................................................................ 6
Survey Content ............................................................................................................. 6
4 Data Collection .............................................................................................................. 9
Web-Based Data Collection Procedures ....................................................................... 9
Data Collection Period .................................................................................................. 9
Survey Disposition Codes ............................................................................................ 11
Response Rates ........................................................................................................... 14
Help Center ................................................................................................................. 17
5 Data Cleaning and Weighting ..................................................................................... 25
Data Cleaning and Recoding ....................................................................................... 25
Weighting .................................................................................................................... 25
6 Data Analysis ............................................................................................................... 27
Frequency Distributions .............................................................................................. 27
Distributions of Positive, Negative, and Neutral Responses ...................................... 27
Do Not Know and No Basis to Judge Responses ......................................................... 28
Agency Pandemic Response ....................................................................................... 28
Missing Data................................................................................................................ 28
Data Suppression ........................................................................................................ 28
Indices ......................................................................................................................... 29
7 Public Release Data Files ............................................................................................. 34
Data Masking Methodology for Disclosure Avoidance ............................................... 34
Data Masking Procedure ............................................................................................. 34
8 Presentation of Results ............................................................................................... 36
Governmentwide Reports .......................................................................................... 37
All Levels, All Indices, All Items Reports ...................................................................... 38
Annual Employee Survey Reports ............................................................................... 38
Management Reports ................................................................................................. 39
Subagency Reports ..................................................................................................... 40

Contents (continued)
Chapter Page
Demographic Comparison Reports ............................................................................. 41
Occupational Series Reports ....................................................................................... 42
Delivery of Agency Results, Reports, & Ad Hoc Analyses – WesDaX .......................... 42
Summary of Quality Control Process .......................................................................... 46
Appendix
A It
em Change Summary ................................................................................................ 47
B 20
22 Federal Employee Viewpoint Survey Instrument .............................................. 55
My Work Experience ................................................................................................... 57
My Work Unit .............................................................................................................. 59
My Organization ......................................................................................................... 62
My Supervisor ............................................................................................................. 64
Leadership ................................................................................................................... 66
My Satisfaction ........................................................................................................... 67
Diversity, Equity, Inclusion, and Accessibility ............................................................. 68
Employee Experience .................................................................................................. 70
Pandemic, Transition to the Worksite, Workplace Flexibilities .................................. 70
Paid Parental Leave ..................................................................................................... 74
Employment Demographics ........................................................................................ 75
Personal Demographics .............................................................................................. 77
C Test Items .................................................................................................................... 80
Test Items – Introduction............................................................................................ 80
D Email Communications ............................................................................................... 82
Sample Invitation Email .............................................................................................. 82
First Reminder Email ................................................................................................... 83
Example of Other Reminder Emails ............................................................................ 84
E AAPOR Response Rate ................................................................................................ 86
AAPOR Response Rate 3 Formula ............................................................................... 86
F Weighting of the Survey Data ..................................................................................... 87
Base Weights............................................................................................................... 87
Survey Nonresponse Adjustment ............................................................................... 88
Raking .......................................................................................................................... 89
Full sample versus Replicate Weights ......................................................................... 91
Example ....................................................................................................................... 91
G Illustration of Weight Adjustment Operations ........................................................... 96

Chapter 1: Survey Introduction
Overview
This report provides a description of the survey instrument, sample design, administration, analysis, and
reporting procedures for the 2022 U.S. Office of Personnel Management (OPM) Federal Employee
Viewpoint Survey (FEVS). The U.S. OPM has conducted the OPM FEVS since 2002.
1
The survey was
conducted biennially between 2002 and 2010, and annually thereafter. Westat, a research company
based in Rockville, MD, has been the primary contractor for the survey since 2004. They provide
technical expertise and support for the OPM FEVS.
The OPM FEVS is a climate survey designed to capture Federal employees’ perceptions of organizational
policies, practices, and procedures, and subsequent patterns of interactions and behaviors that support
organizational performance. As a construct, climate is a surface manifestation of organizational culture.
2
Climate assessments like the OPM FEVS are, consequently, important to organizational improvement
largely because of the key role culture plays in directing organizational performance.
The OPM FEVS is designed to provide agencies with employee feedback on dimensions critical to
organizational performance: conditions for engagement, perceptions of leadership organizational
effectiveness, outcomes related to climate (e.g., job satisfaction), and more.
1
Prior to 2010, the survey was called the Federal Human Capital Survey (FHCS).
2
Patterson, M. G., West, M. A., Shackleton, V. J., Dawson, J. F., Lawthom, R., Maitlis, S., et al. (2005). Validating the
organizational climate measure: Links to managerial practices, productivity and innovation. Journal of Organizational
Behavior, 26, 379–408.
Parker, C. P., Baltes, B. B., Young, S. A., Huff, J. W., Altmann, R. A., Lacost, H. A., & Roberts, J. E. (2003). Relationships between
psychological climate perceptions and work outcomes: A meta-analytic review. Journal of Organizational Behavior, 24, 389–416.
Schulte, M., Ostroff, C., & Kinicki, A. J. (2006). Organizational climate systems and psychological climate perceptions: A cross
level study of climate-satisfaction relationships. Journal of Occupational and Organizational Psychology, 79, 645–671.
Schneider, B. (2000). The psychological life of organizations. In N. M. Ashkanasy, C. P. M. Wilderom, & M. F. Peterson (Eds.),
Handbook of organizational culture and climate: xvii-xxii. Thousand Oaks, CA: Sage.
Schneider, B., Brief, A. P., & Guzzo, R. A. (1996). Creating a climate and culture for sustainable organizational change.
Organizational Dynamics, 24, 7–19.
2022 OPM Federal Employee Viewpoint Survey: Technical Report 1

The 122-item survey covers the following dimensions, topic areas, programs, and demographics:
• My Work Experience,
• My Work Unit,
• My Organization,
• My Supervisor,
• Leadership,
• My Satisfaction,
• Diversity, Equity, Inclusion, and Accessibility,
• Employee Experience
• Pandemic, Transition to the Worksite, Workplace Flexibilities,
• Paid Parental Leave,
• Employment Demographics, and
• Personal Demographics.
Goals for the OPM FEVS and program include:
• A responsive survey with a leading-edge design and contemporary content capable of informing
leadership priorities.
• Data of the highest possible quality (e.g., reliable, valid) to support effective organizational
development decisions.
• An agile survey and reporting process to support timely and substantive change actions within
agencies and across government.
In keeping with responsiveness goals, items have been added as needed (e.g., demographic questions to
assess sexual orientation in 2012, partial government shutdown items in 2019, COVID-19 pandemic in
2020) to allow assessment of the impact of relevant and timely topics that may impact the Federal
workforce. In 2021, a section related to the COVID-19 pandemic and return to the worksite was added.
For the 2022 survey, this section was maintained, however with fewer questions than were asked on the
2021 survey. (see Appendix A for details).
Aligning with goals to achieve high-quality data to drive decisions, the sample design and statistical
weighting for the OPM FEVS ensures that the survey results are statistically representative. Not only at
the overall Federal workforce (i.e., governmentwide) level, but also at the agency level.
2022 OPM Federal Employee Viewpoint Survey: Technical Report 2

Uses of Survey Results
Federal leaders use OPM FEVS results to identify organizational development and improvement
strategies, evaluate development actions, and highlight important agency successes. OPM FEVS findings
allow agencies and subagencies to assess trends, where applicable, by comparing results from previous
years. Agencies can compare their results with the governmentwide trends, to identify current strengths
and challenges, and to focus on short-term and long-term action targets that will help agencies reach
their strategic human resource management goals. The recommended approach for assessing and
driving change in agencies is to utilize OPM FEVS results in conjunction with other resources, such as
results from other internal agency surveys, administrative data, focus groups, exit interviews, and other
methods to collect contextual, agency-specific information.
2022 OPM Federal Employee Viewpoint Survey: Technical Report 3

Chapter 2: Sample Design and Selection
Sample Design
The OPM FEVS sample design reflects OPM’s commitment to providing Federal agency leaders with
representative information about their employees’ perceptions of workplace management practices,
policies, and procedures. The survey population for the 2022 OPM FEVS included permanently
employed, non-political, non-seasonal, full- or part-time and phase retirement Federal employees who
were employed as of November 2021. The survey population for the 2022 OPM FEVS is primarily made
up of permanent, full- and part-time employees, as well as employees in phased retirement. In 2022,
expanded eligibility was maintained to include non-permanent and additional work schedules, but only
if the participating agencies opted to include those populations; some elected to include all of them,
some elected none, and others allowed some and not others. Political appointees, contractors, and non-
Federal employees remained ineligible to participate. The 2022 OPM FEVS was a governmentwide
census. For more details on how this sample was drawn, please see Chapter 5 below.
The total sample size for the 2022 O
PM FEVS was 1,582,112 employees compared to 938,638 in 2021
and 1,555,717 in 2020. The 2022 sample size was more than sufficient to ensure a 99 percent chance
that the true population value would be between plus or minus 1 percent of any estimated percentage
for the total Federal workforce. Agencies that participated in previous surveys, but did not participate in
the 2022 OPM FEVS, include the Department of Veterans Affairs (VA), National Aeronautics and Space
Administration (NASA), the U.S. Security and Exchange Commission (SEC), and U.S. African Development
Foundation (USADF).
Sampling Frame and Stratification Variables
The sampling frame is a comprehensive list of all persons in the Federal employee population eligible for
selection in the survey. For the 2022 OPM FEVS, the sampling frame consisted of 1,689,258 Federal
employees in pay status as of November 2021 in the agencies participating in the survey. Apart from a
2022 OPM Federal Employee Viewpoint Survey: Technical Report 4

few exceptions,
3
this list originated from the personnel database managed by OPM as part of the
Statistical Data Mart of the Enterprise Human Resources Integration (EHRI-SDM).
4
OPM contacted
participating agencies for employee email addresses and supplemental organizational information. This
information provides the hierarchical work unit(s) designation for each employee and provides more
detailed information than available from the EHRI-SDM. The total survey population size was 1,689,258
employees, but after cleaning procedures, including removing people who were no longer an employee
of an agency, the final survey population size was 1,582,112 Federal employees.
3
At the time of sample selection, a separate data submission was arranged because EHRI-SDM did not maintain information
on the following employee types eligible to participate in the survey: U.S. Army Corps of Engineers foreign national
employees, Department of the Air Force non-appropriated fund employees, U.S. Department of Agriculture Farm Service
Agency County employees and Public Health Service employees, Department of the Army foreign national employees and
non-appropriated fund employees, Foreign national employees for the Defense Finance and Accounting Service and non-
appropriated fund employees for the Defense Logistics Agency, Environmental Protection Agency Public Health Service
employees, Department of Health and Human Services Commission Corps employees, Department of Homeland Security –
Immigration and Customs Enforcement Public Health Service employees, U.S. Marine Corps non-appropriated fund
employees, Postal Regulatory Commission, and Department of State Foreign Service employees.
4
http://www.fedscope.opm.gov/datadefn/aehri_sdm.asp.
2022 OPM Federal Employee Viewpoint Survey: Technical Report 5

Chapter 3: Survey Instrument
Survey Content
The OPM FEVS instrument is designed to assess the climate of Federal agencies. Climate is a multi-
dimensional construct.
5
It is exhibited through workplace tangibles such as behaviors and practices,
which employees can perceive and describe in response to survey items developed to describe aspects
of climate.
6
Like other organizational climate instruments, the OPM FEVS captures employee
perspectives regarding workplace conditions. Research suggests that climate perceptions are associated
with effectiveness-related outcomes, such as turnover intentions, job satisfaction, and organizational
performance.
7
Accordingly, additional constructs, such as Global Satisfaction, are assessed in the survey
to provide dependent variables or outcome measures.
The 2022 survey instrument was revised from the version administered in 2021. A section related to the
COVID-19 pandemic was maintained, however with fewer questions than asked on the 2021 OPM FEVS.
OPM FEVS items required in regulation and those in regularly reported indices (Employee Engagement,
Global Satisfaction, and Performance Confidence) were retained for the 2022 survey, as were
demographic sections. Several new topic areas and items tested in prior survey administrations were
added to the 2022 survey. A complete list of item changes, including COVID-19 items, to the 2022 OPM
FEVS is available in Appendix A.
5
Organizational climate is a theoretical construct with specific outcomes (dependent variables) featured in climate models,
especially employee satisfaction and productivity. It is a multi-dimensional construct comprised of discreet dimensions,
capturing how employees jointly experience the policies, practices, and procedures of their organizations. Employee
perceptions of climate, influence organizational effectiveness by shaping, for example, employee engagement, satisfaction,
motivation, commitment, and turnover.
6
James, L. R., & Jones, A. P. (1974). Organizational climate: A review of theory and research. Psychological Bulletin, 81, 1096–
1112.
Schneider, B. (2000). The psychological life of organizations. In N. M. Ashkanasy, C. P. M. Wilderom, & M. F. Peterson (Eds.),
Handbook of organizational culture and climate: xvii-xxii. Thousand Oaks, CA: Sage.
Schneider, B., Brief, A. P., & Guzzo, R. A. (1996). Creating a climate and culture for sustainable organizational change.
Organi
zational Dynamics, 24, 7–19.
7
Patterson, M. G., West, M. A., Shackleton, V. J., Dawson, J. F., Lawthom, R., Maitlis, S., Robinson, D. L, & Wallace, A. M.
(2005). Validating the organizational climate measure: Links to managerial
practices, productivity and innovation. Journal of
Organizational Behavior, 26(4), 379–408.
Parker, C. P.,
Baltes, B. B., Young, S. A., Huff, J. W., Altmann, R. A., Lacost, H. A., & Roberts, J. E. (2003). Relationships between
psychol
ogical climate perceptions and work outcomes: A meta-analytic review. Jour
nal of Organizational Behavior, 24, 389–416.
2022 OPM Federal Employee Viewpoint Survey: Technical Report 6

The 2022 OPM FEVS was conducted via the Web and was 508 compliant.
8
The 122-item survey included
20 demographic questions and 104 items that were grouped into twelve topic headings intended to
organize the instruments and facilitate respondent comprehension. Below is a summary of the
questions within topics. See Appendix B for a copy of the 2022 OPM FEVS survey.
2022 OPM FEVS topic areas:
• My Work Experience: Items 1–13 addressed employees’ personal work experiences and
opinions.
• My Work Unit: Items 14–34 addressed employees’ opinions regarding cooperation,
recruitment, quality, and performance management in their work unit.
• My Organization: Items 35–44 covered agency policies and practices related to job
performance, performance appraisals, workplace diversity and fairness, as well as perceptions
of employees’ personal empowerment, safety, and preparedness. This section also addressed
employees’ views of their agency.
• My Supervisor: Items 45–54 addressed employees’ perceptions of their supervisor. For instance,
this section asked whether supervisors support work-life balance, provide opportunities to
demonstrate leadership skills, and promote a workplace culture that supports staff
development.
• Leadership: Items 55–64 asked about the effectiveness of the agency’s senior leaders and
managers, overall, and in motivating employees, maintaining high ethical standards,
communicating organizational policies, and generating respect.
• My Satisfaction: Items 65–70 addressed employee satisfaction with various aspects of their
jobs, including pay, job training, opportunities for advancement, recognition for work well done,
and the policies and practices of senior leaders.
• Diversity, Equity, Inclusion, and Accessibility: Items 71–84 addressed employees perceptions of
policies and practices related to diversity, equity, and inclusion in their agency and also meeting
accessibility needs.
• Employee Experience: Items 85–89 askes about employees’ experience of they experience their
work and what motivates them.
• Pandemic, Transition to the Worksite, Workplace Flexibilities: Items 90–99 addressed the
continuing impact of the COVID-19 pandemic and decisions related to returning to the worksite.
• Paid Parental Leave: Items 100–104 asked about the experiences of using the new paid parental
leave benefit for employees who indicated they had used it.
• Employment Demographics: covered employee information, such as location of employment
(headquarters vs. field), supervisory status, pay category/grade, military service status, Federal
8
508 compliant refers to Section 508, an amendment of the U.S. Workforce Rehabilitation Act, mandating that all documents
used by the Federal government are accessible to people with disabilities.
2022 OPM Federal Employee Viewpoint Survey: Technical Report 7

employment tenure, agency tenure, and separation intentions from government such as
retirement.
• Personal Demographics: covered personal information, such as ethnicity, race, age group,
education, disability status, gender, sexual orientation, and transgender identity.
In addition to the 122 survey items administered to all employees on the OPM FEVS, agencies were
provided an opportunity to add up to eight extra items tailored specifically to issues of interest to the
agency. A total of 58 agencies opted to add agency-specific items, for a total of 445 questions.
After answering all the survey items described above, 2022 OPM FEVS respondents were also presented
with the option of seeing new survey content that OPM was currently testing for potential inclusion in
future FEVS administrations. If the respondent indicated that they would be willing to view and
participate in the test items, they were then presented with 17 test items asking about work autonomy,
agency processes, and customer service. See Appendix C for a full list of the test items.
2022 OPM Federal Employee Viewpoint Survey: Technical Report 8

Chapter 4: Data Collection
In this chapter, we describe the data collection procedures OPM used to administer the Web-based
surveys, including details on the disposition codes used during data collection and for the calculation of
response rates. This chapter concludes with a description of the procedures used during the data
collection period to address questions received from Federal employees.
Web-Based Data Collection Procedures
The 2022 OPM FEVS was a Web-based, self-administered survey. OPM sent emails to employees with an
invitation to participate in the survey. The invitation email included instructions for accessing the survey
(see Appendix D for the invitation). Up to four reminder emails were also sent to non-respondents,
including a final reminder sent the final week of an agency’s data collection period, indicating the survey
would close on the Friday of that week (see Appendix D for examples of the reminder emails). Once an
employee completed the survey, reminder emails were no longer sent to that individual. OPM also
provided agencies with sample communication materials to promote the survey and encourage
participation.
Estimates indicated the time for survey completion was no more than 30 minutes for the core items.
The actual total survey completion times varied from agency to agency depending upon the number and
complexity of any included agency-specific items. Employees were informed that official work time
could be used to complete the survey.
Data Collection Period
The data collection period for the 2022 OPM FEVS was May 31, 2022
9
to July 22, 2022. To spread the
workload more evenly over that period, OPM released the surveys to agencies in two waves, beginning
either Tuesday May 31
st
or Monday, June 6
th
(see Table 1). The data collection period for each agency
spanned six workweeks. Table 1 shows the week of launch and close dates by agency.
9
Monday May 30
th
, 2022 was a Federal holiday and surveys could not be sent out.
2022 OPM Federal Employee Viewpoint Survey: Technical Report 9

Table 1. 2022 OPM FEVS survey week of launch and close dates, by agency
Agency
Week of
Launch Date
Week of
Close Date
Court Services & Offender Supervision Agency
May 30
July 15
Department of Agriculture
May 30
July 15
Department of Commerce
June 6
July 22
Department of Defense
Department of the Air Force
May 30
July 15
Department of the Army
June 6
July 22
U.S. Army Corps of Engineers
June 6
July 22
Department of the Navy
May 30
July 15
U.S. Marine Corps
May 30
July 15
DOD 4th Estate
May 30
July 15
Department of Education
June 6
July 22
Department of Energy
May 30
July 15
Department of Health and Human Services
June 6
July 22
Department of Homeland Security
June 6
July 22
Department of Housing and Urban Development
June 6
July 22
Department of Justice
May 30
July 15
Department of Labor
May 30
July 15
Department of State
May 30
July 15
Department of the Interior
June 6
July 22
Department of the Treasury
May 30
July 15
Department of Transportation
May 30
July 15
Environmental Protection Agency
May 30
July 15
Equal Employment Opportunity Commission
May 30
July 15
Federal Communications Commission
June 6
July 22
Federal Energy Regulatory Commission
May 30
July 15
Federal Trade Commission
May 30
July 15
General Services Administration
May 30
July 15
National Archives and Records Administration
June 6
July 22
National Credit Union Administration
May 30
July 15
National Labor Relations Board
May 30
July 15
National Science Foundation
June 6
July 22
Nuclear Regulatory Commission
May 30
July 15
Office of Management and Budget
June 6
July 22
Office of Personnel Management
June 6
July 22
Pension Benefit Guaranty Corporation
May 30
July 15
Railroad Retirement Board
May 30
July 15
Small Business Administration
May 30
July 15
Social Security Administration
June 6
July 22
U.S. Agency for Global Media
June 6
July 22
U.S. Agency for International Development
May 30
July 15
Small/Independent Agencies
June 6
July 22
2022 OPM Federal Employee Viewpoint Survey: Technical Report 10

Survey Disposition Codes
Determining survey disposition codes is a two-step process with an interim code and a final code
assigned. Each case in the sample frame receives interim disposition codes to indicate the result of
specific survey contact attempts (e.g., pending, out of office, no email address) during the survey period.
At the end of the survey period, each case receives one final disposition code.
Interim Disposition Codes
Throughout data collection, each case received an interim disposition code when the case was not yet
assessed as closed. Table 2 shows the interim disposition codes.
Table 2. 2022 OPM FEVS interim disposition codes
Interim Code
Description of Interim Disposition Code
00
Pending, non-response
CO
Complete
IE
Ineligible (e.g., deceased, retired, no longer with agency)
Undeliverable
11
1
st
Undeliverable
12
2
nd
Undeliverable
13
3
rd
Undeliverable
14
4
th
Undeliverable
15
5
th
Undeliverable
16
6
th
Undeliverable
17
7
th
Undeliverable
18
8
th
or more Undeliverable
20
No longer at email address, no forwarding information
NE
No email address
Out of office
41
1
st
Out of office
42
2
nd
Out of office
43
3
rd
Out of office
44
4
th
Out of office
45
5
th
Out of office
46
6
th
Out of office
47
7
th
Out of office
48
8
th
or more Out of office
Other
80
Opted Out
90
Request Reset URL
RF
Refusal
UA
Unavailable during the field period
NS
Not Sampled
2022 OPM Federal Employee Viewpoint Survey: Technical Report 11

Starting in 2018, respondents who emailed to refuse participation were immediately coded as a refusal
and unsubscribed from future communications. For 2022, an opt-out link was included with the
reminders sent from OPM to participants who had not yet completed their survey. These participants
had a separate interim disposition code while the survey was in the field. However, once the survey
closed, they were included with the disposition code for refusals.
During data collection, if the respondent’s out-of-office email indicated that they were out of the office
during the entire data collection period, the case received an interim disposition code of unavailable (UA).
Converting Interim Codes to Final Disposition Codes
Each case used the following rules when converting interim disposition codes to a final disposition code.
Survey Completes and Incompletes. All respondents who submitted surveys received an interim
complete. However, to receive a final disposition code as a complete (CO), a respondent had to provide
answers to at least 23 of the core non-demographic items. That is, they needed to complete over 25
percent of the core non-demographic survey items. If the respondent answered fewer than the required
25 percent of the non-demographic items, the case was an incomplete (IN).
Once the cases received codes as completes or incompletes, the final disposition process applied the
following rules in hierarchical order:
• Refusals. Cases coded as a refusal (code RF) remained unless the employee completed the
survey. If a case coded as a refusal, completed the survey, the case received a complete (CO).
• Ineligibles. Cases coded as ineligible (code IE) were based on the following criteria; the person
was discovered after sampling to be:
– retired;
– no longer with the agency;
– unavailable during the data collection period (UA) (i.e., out on maternity leave, out of the
country, on leave for any other reason during the entire data collection period);
– determined to be active duty, activated military, a political appointee, or a contractor; or
– deceased.
Undeliverable Emails. If a respondent had an undeliverable email bounce back, we counted the number
of undeliverable messages received, and this number provided the interim undeliverable code of 11
through 18 (i.e., 1 through 8 or more
undeliverable messages). The following rule applied to determine
2022 OPM Federal Employee Viewpoint Survey: Technical Report 12

the respondent’s undeliverable (code UD) status: if the total number of contacts with the respondent’s
agency equaled at least ½ the number of undeliverable bounce backs, then the case received a UD. If
less than ½ the number of total contacts were undeliverable bounce backs, the case received a NR. In
2022, every person had 5 potential contacts (invitations and reminders), any case with at least 3 (5
contacts divided by 2 = 2.5 rounded up) interim undeliverable emails (interim codes 13 through 15)
would be coded as UD; otherwise, they would be designated as no response (code NR).
Final Disposition Codes
Table 3 lists the final disposition codes with the number of cases per code for the 2022 OPM FEVS. The
codes abide by the American Association of Public Opinion Research’s (AAPOR) 2016 guidelines for
internet surveys of specifically named persons.
10
The calculation of survey response rates and survey
analysis weights used final disposition codes. The final analysis dataset only includes cases with a final
disposition code of complete (CO); no other disposition codes are retained in the dataset.
Table 3. 2022 OPM FEVS final disposition codes and case count per disposition code
Final Disposition
Codes
Description Number of Cases
CO
Complete – respondent answered at least 23 of the 90 non-
demographic items
557,778
IN
Incomplete – respondent answered at least 1 but less than 23 of
the 90 non-demographic items
19,353
RF Refusal (including Opt-Out) 757
NR No response 1,004,224
NS Not Sampled 7
IE Ineligible (e.g., deceased or no longer with agency) 15,687
NE No email address 20,355
UA Unavailable during the fielding period 235
UD Undeliverable email 70,862
Total 1,689,258
10
The American Association for Public Opinion Research. (2016). Standard Definitions: Final Dispositions of Case Codes and
Outcome Rates for Surveys. (9
th
ed.) AAPOR. Last retrieved December 12, 2019:
https://www.aapor.org/AAPOR_Main/media/publications/Standard-Definitions20169theditionfinal.pdf.
2022 OPM Federal Employee Viewpoint Survey: Technical Report 13

Response Rates
Westat calculated response rates in two ways: (1) using the formula reported in previous
administrations of the OPM FEVS, and (2) using AAPOR’s Response Rate 3 formula, an industry-standard
method that allows a better comparison to other surveys as shown in Appendix E. The two formulas
lead to different results due to differences in the allocations of final disposition codes among the four
main groupings of survey cases:
• Eligible respondents (ER = surveyed and responded),
• Eligible non-respondents (ENR = known eligible cases that did not return completed surveys),
• Unknown eligibility (UNK), and
• Ineligible cases (IE).
Table 4 shows the distributions of final disposition codes among these four groupings. The
governmentwide and agency response rates, which were calculated using the OPM FEVS formula, are in
Table 5.
Table 4. Case assignment allocation to response rate groups
Response Rate (RR) Group
OPM FEVS Allocation
OPM FEVS Counts
Eligible Respondents (ER) CO 557,778
Eligible Non-respondents (ENR) NR,
RF, IN 1,024,334
Unknown Eligibility (UNK) ---
Ineligible (IE
) IE, UD, NE, UA, N
S 107,146
Total
1,689,258
Using the counts in
Table 4, the response rates in final reporting follows:
OPM FEVS formula:
Number of eligible employees returning completed surveys / Number of eligible employees:
RR = ER / (ER + ENR) * 100
RR = 557,778/ (557,778 + 1,024,334) * 100
RR = (557,778/1,582,112) * 100
RR = 35.3 percent (up from 33.8 percent in 2021)
2022 OPM Federal Employee Viewpoint Survey: Technical Report 14
Table 5. 2022 OPM FEVS agency response rate by employee population size categories
Agency
Number of
Completed Surveys
Response Rate
Governmentwide 557,778 35.3%
Very Large Agencies (> 75,000 employees)
Department of Agriculture 43,332 50.1%
Department of Defense, Overall 163,247 24.2%
United States Department of the Air Force 31,191 17.9%
United States Department of the Army* 60,278 28.2%
United States Department of the Navy** 39,890 20.6%
OSD, Joint Staff, Defense Agencies, and Field Activities 31,888 34.9%
Department of Health and Human Services 50,317 64.1%
Department of Homeland Security 73,070 35.9%
Department of Justice 25,866 22.7%
Department of the Treasury 35,764 42.4%
Large Agencies (10,000 – 74,999 employees)
Department of Commerce 21,009 47.9%
Department of Energy 8,587 69.4%
Department of Labor 7,550 56.4%
Department of State 7,962 29.9%
Department of the Interior 27,014 46.8%
Department of Transportation 19,989 37.7%
Environmental Protection Agency 7,757 55.2%
General Services Administration 7,498 67.7%
Social Security Administration 26,528 46.4%
Medium Agencies (1,000 – 9,999 employees)
Court Services and Offender Supervision Agency 349 34.5%
Department of Education 2,698 68.5%
Department of Housing and Urban Development 4,866 63.9%
Equal Employment Opportunity Commission 1,102 54.9%
Federal Communications Commission 526 38.1%
Federal Energy Regulatory Commission 1,079 78.0%
Federal Trade Commission 782 75.3%
National Archives and Records Administration 1,407 57.3%
National Credit Union Administration 904 83.1%
National Labor Relations Board 704 61.0%
National Science Foundation 1,049 74.0%
Nuclear Regulatory Commission 1,889 70.6%
Office of Personnel Management 1,516 63.5%
Small Business Administration 3,524 53.6%
U.S. Agency for Global Media 693 53.8%
U.S. Agency for International Development 1,769 42.5%
Small Agencies (100 – 999 employees)
Commodity Futures Trading Commission 393 61.6%
Consumer Product Safety Commission 395 82.0%
Corporation for National and Community Service 427 77.9%
Defense Nuclear Facilities Safety Board 75
78.1%
Export-Import Bank of the United States 232 63.0%
Farm Credit Administration 223 78.8%
2022 OPM Federal Employee Viewpoint Survey: Technical Report 15

Table 5. 2022 OPM FEVS agency response rate by employee population size categories
(continued)
Agency
Number of
Completed Surveys Response Rate
Small Agencies (100 – 999 employees) continued
Federal Election Commission
191
73.7%
Federal Housing Finance Agency
548
83.3%
Federal Labor Relations Authority
53
51.0%
Federal Maritime Commission
62
62.6%
Federal Mediation and Conciliation Service
124
60.8%
Federal Retirement Thrift Investment Board
161
64.4%
International Boundary and Water Commission
91
41.9%
Merit Systems Protection Board
149
81.0%
National Endowment for the Arts
65
61.3%
National Endowment for the Humanities
98
61.6%
National Gallery of Art
416
60.8%
National Indian Gaming Commission
56
59.6%
National Transportation Safety Board
269
72.5%
Office of Management and Budget
433
76.2%
Office of the U.S. Trade Representative
142
70.6%
Pension Benefit Guaranty Corporation
606
70.3%
Railroad Retirement Board
373
48.7%
Selective Service System
63
58.3%
Surface Transportation Board
74
67.9%
U.S. International Development Finance Corporation
296
81.8%
U.S. International Trade Commission
340
89.0%
U.S. Office of Special Counsel
82
63.6%
U.S. Peace Corps
531
74.1%
Very Small Agencies (< 100 employees)
AbilityOne Commission
20
60.6%
Advisory Council on Historic Preservation
17
51.5%
American Battle Monuments Commission
34
49.3%
Commission on Civil Rights
16
50.0%
Farm Credit Insurance Corporation
<10
--
Federal Mine Safety and Health Review Commission
27
58.7%
Institute of Museum and Library Services
40
70.2%
Inter-American Foundation
39
95.1%
John F. Kennedy Center for the Performing Arts
18
36.7%
Marine Mammal Commission
11
84.6%
National Capital Planning Commission
22
71.0%
National Council on Disability
<10
--
National Mediation Board
<10
--
Occupational Safety and Health Review Commission
31
73.8%
Office of Navajo and Hopi Indian Relocation
<10
--
Postal Regulatory Commission
47
87.0%
U.S. Access Board
<10
--
U.S. Chemical Safety and Hazard Investigation Board
22
84.6%
2022 OPM Federal Employee Viewpoint Survey: Technical Report 16

Table 5. 2022 OPM FEVS agency response rate by employee population size categories
(continued)
Agency
Number of
Completed Surveys Response Rate
Very Small Agencies (< 100 employees) (continued)
U.S. Office of Government Ethics
48
71.6%
U.S. Trade and Development Agency
33
66.0%
*United States Department of the Army numbers include United States Army Corps of Engineers.
**United States Department of the Navy numbers include United States Marine Corps.
Help Center
As part of Westat’s contractual duties, a Help Center was set up during the data collection of the OPM
FEVS to assist Federal employees with questions about the survey. Providing a Help Center ensures
prompt, accurate, professional, and consistent handling of all inquiries. A Help Center also supports
higher response rates during data collection by allowing respondents to obtain answers to questions,
voice concerns, ensure the legitimacy of the survey, and remedy any technical issues with the survey.
The Help Center served as a central point for coordinating and managing reported problems and issues.
Employees could email their questions and concerns to Help Center staff. Twenty-nine email accounts
were set up, one for each of the 27 large departments/agencies, one for the small/independent
agencies, and one for the large independent agencies. Westat’s Help Center staff included four trained
team staff members, one Help Center supervisor, and one assistant Help Center supervisor, with all
operations overseen by the data collection task manager. Members of the OPM FEVS staff handled
email inquiries from Westat Help Center supervisors.
The Help Center opened with the launch of the first survey invitation on May 31, 2022 and closed on the
last day of the fielding period, July 22 , 2022. Hours of operation were 8:30 am to 5:00 pm Eastern Time,
Monday through Friday. The Help Center was based out of the Westat campus in Rockville, Maryland.
Staff Training
The Help Center supervisor conducted a 2-hour staff training session prior to the launch of the survey.
The training session included an introduction to the project, a review of the 2022 OPM FEVS Contractor
Answer Book prepared by OPM, a technical session on how to use the Web-based Help Center
Application (see next section for details on this application), and procedures for handling emails from
employees. After the technical session, all trainees used test accounts and cases that were set up in a
2022 OPM Federal Employee Viewpoint Survey: Technical Report 17

training version Web-based application to apply what they had learned in a set of example resolution
exercises. The training session closed with questions from Help Center staff.
The formal 2-hour training was followed-up with one-on-one training sessions between the Help Center
supervisors and the Help Center staff. One-on-one sessions further assisted the Help Center staff
understand eligibility requirements and how to code dispositions properly. During the survey
administration period, the Help Center supervisors frequently reviewed the survey support inboxes,
Help Center staff workload, and replies to respondents to ensure responses were not only timely, but
also appropriate.
Web-Based Help Center Application
The Web-based Help Center Application, or Survey Management System (SMS), is an application that
enables Help Center staff and members of the OPM FEVS staff to respond to emails, facilitate quick
handling of respondent inquiries, and optimize technical assistance response times. The SMS managed
email inquiries from survey participants and provided other support functions such as tracking
disposition codes for the surveys, updating contact information, capturing real-time survey submissions,
and generating response rate reports. The SMS was linked to the OPM survey platform, enabling Help
Center staff to unsubscribe employees who explicitly refused to take the survey or who were designated
as ineligible, so that they did not continue to receive reminder notifications. The SMS also automatically
received response information in real-time from the survey platform to keep response rate reporting as
accurate and up-to-date as possible. Cases for which the SMS could not provide real-time updates, were
updated twice daily.
Response Rate Reporting Website
Beginning in 2014, OPM FEVS Points of Contact for agencies have access to a Response Rate Reporting
Website to view their agency’s survey completion rate information, updated hourly, during the data
collection period.
11
The 2022 website provided the following information: launch date of the survey,
number of days in field and remaining sample size, number of completed surveys (based on an interim
disposition code), and the response rate to date. It provided the final response rates for the previous
survey administrations as well as the response rate to date in the same period of survey data collection
11
The completion rate differs from the response rate as it does not take into consideration ineligible respondents and surveys
submitted that do not meet completion criteria. It is the number of submitted surveys divided by the sample size.
2022 OPM Federal Employee Viewpoint Survey: Technical Report 18

for the previous year. Agency leaders could also drill down in their organization to view subagency
response rates to identify where response rates were high as well as any subagencies that might be
driving lower agency response rates.
Additionally, the Response Rate Reporting website provided a dashboard feature. It allowed agencies to
graphically see response rates over time and in comparison to governmentwide—the top 3 and bottom
3 subagencies, the subagencies leading and trailing the previous agency response rate to date, number
of daily and weekly completes, and response rates with the option to show comparative data for the
previous 2 years where applicable (see Figure 1). This information was intended to allow agency
managers and executives to monitor and promote participation in the OPM FEVS.
2022 OPM Federal Employee Viewpoint Survey: Technical Report 19

Figure 1. Sample Views in OPM FEVS Response Rate Website
Help Center Operational Procedures
This section details the Help Center operational procedures, as well as the volume and types of inquiries
received.
Emails
Figure 2 illustrates the operational procedures for handling emails at the Help Center. When an email
was received within the SMS, the Help Center staff had the option to reply with an appropriate response
2022 OPM Federal Employee Viewpoint Survey: Technical Report 20

from the OPM FEVS Contractor Answer Book or flag OPM for assistance. The Help Center processed over
629,763 emails within the Help Center SMS across the 29 email accounts (see Table 6).
Of the 629,763 emails received by the Help Center,
• 379,576 were undeliverable notifications of which 125,340 were from unique respondents.
• 232,991 were automated out-of-office replies, of which 195,175 were from unique respondents.
Westat staff worked through and programmatically processed these messages to gather
information to help assign final disposition codes (e.g., ineligibles, unavailable during the field
period).
• 17,196 were inquiries or comments from individuals.
Help Center staff reviewed all inquiries and comments in the inbox and determined that 14,952 of the
17,196 emails required a response. The other 2,244 emails consisted of comments from users who did
not require a response, such as letting the Help Center know that the respondent intended to complete
the survey or thanking Help Center staff for their assistance. Of the 14,952 emails that required a
response, 923 (6.17 percent of the total) were flagged for OPM for additional assistance.
2022 OPM Federal Employee Viewpoint Survey: Technical Report 21

Figure 2. 2022 OPM FEVS Help Center email procedures
Emails received at 1 of 29 OPM FEVS email accounts.
Emails auto-forward to 1 of 29 Westat email accounts.
Westat Help Center staff checks the OPM FEVS Contractor Answer Book.
Did you locate an appropriate response to inquiry?
YES
Copy/modify approved response from
OPM FEVS Contractor Answer Book.
Westat Help Center staff provides
appropriate response to respondent.
NO
What type of question is it?
Other Technical/Content
Westat flags inquiry
for OPM to review
and provide a
response.
Request Reset URL
Westat creates a
report for listing
Reset User IDs for
OPM to reset weekly.
OPM provides response to respondent.
OPM sends Westat periodic updates to OPM
FEVS Contractor Answer Book.
Westat updates OPM FEVS Contractor Answer
Book and conducts refresher training among
Help Center staff.
2022 OPM Federal Employee Viewpoint Survey: Technical Report 22

Table 6. Number of emails handled by Help Center and OPM, by agency
Agency
Folder
Total
*
Inbox Out of Office Undeliverable Sent
Department of Agriculture 3,011 12,517 28,030 2,792 43,558
Department of Commerce 540 6,753 14,280 402 21,573
Department of Defense
United States Department of the Air Force 872 2,548 19,069 739 22,489
United States Department of the Army 1,052 30,628 92,063 913 123,743
United States Army Corps of Engineers 586 4,686 786 510 6,058
United States Department of the Navy 590 36,675 79,442 464 116,707
United States Marine Corps 105 4,675 7,915 34 12,695
OSD, Agencies and Activities 814 17,689 21,764 728 40,267
Department of Education 98 1,180 3 82 1,281
Department of Energy 400 2,502 1,774 337 4,676
Department of Health and Human Services 2,460 15,882 14,210 2,182 32,552
Department of Homeland Security 1,241 23,043 29,268 1,082 53,552
Department of Housing and Urban Development 444 2,374 1,562 395 4,380
Department of Justice 536 13,350 13,821 469 27,707
Department of Labor 195 2,915 3,043 159 6,153
Department of State 239 9,931 5,450 208 15,620
Department of the Interior 1,378 7,067 16,046 1,261 24,491
Department of the Treasury 724 8,779 13,271 636 22,774
Department of Transportation 369 6,977 1,669 326 9,015
Environmental Protection Agency 233 3,727 3,534 197 7,494
General Services Administration
242 3,093 2,838 197 6,173
National Science Foundation 10 361 227 6 598
Office of Management and Budget 26 160 167 20 353
Office of Personnel Management 39 668 404 35 1,111
Small Business Administration 280 1,019 1,005 241 2,304
Social Security Administration 240 5,835 4,262 208 10,337
U.S. Agency for International Development 101 2,602 20 2,703
Large independent agencies 209 3,506 1,773 168 5,488
Small independent agencies 162 1,849 1,900 141 3,911
Total 17,196 232,991 379,576 14,952 629,763
*Note: Overall total does not include sent items.
2022 OPM Federal Employee Viewpoint Survey: Technical Report 23

Types of Inquiries Received
The types of inquiries received are listed below and demonstrate the frequently asked questions that
the Help Center responded to through email. The Help Center staff answered all inquiries using the
appropriate response from the OPM FEVS Contractor Answer Book, which consisted of 68 questions,
which mostly fell into the following categories:
• Individuals trying to determine if they were eligible for the survey;
• Individuals verifying the survey was legitimate;
• Individuals who had recently moved positions within the government;
• Individuals who had lost their survey URL;
• Individuals reporting they were no longer Federal employees;
• Individuals who had received a reminder from within their agency (not from OPM), who were
not in the sample and therefore did not get a survey invitation, and were wondering how to take
the survey;
• Individuals with questions about confidentiality, particularly for members of small subgroups;
• Individuals asking clarifying questions about survey content; and
• Individuals having difficulty accessing the survey.
Toll-Free Calls
The Help Center did not use a toll-free hotline in 2022, although the number used in previous years
remained active. Mentions of the toll-free number were removed from communications with
respondents. Calls would be sent directly to voicemail and messages returned within 1 business day. No
calls were received during the data collection period, which were logged into the SMS.
2022 OPM Federal Employee Viewpoint Survey: Technical Report 24

Chapter 5: Data Cleaning and Weighting
This chapter outlines the data cleaning and recoding performed on the analysis dataset as well as
weighting of survey cases to represent the Federal employee population.
Data Cleaning and Recoding
After data collection, the data cleaning and editing process involved assigning final disposition codes and
recoding some of the variables for analysis purposes. Some demographic variables were recoded to
report on collapsed categories, for example, the race and ethnicity variable was recoded as minority and
non-minority.
Weighting
The process of weighting refers to the development of an analysis weight assigned to each respondent
to the 2022 OPM FEVS. The weights are necessary to achieve the survey objective of making unbiased
inferences regarding the perceptions of the entire Federal employee population. Without the weights,
the OPM FEVS could result in biased population estimates. While the 2022 OPM FEVS was a census, and
all eligible employees had an equal probability of being selected to participate, nonresponse remains a
source of potential bias in the 2022 OPM FEVS estimates. In an ideal scenario, everyone selected to
participate will complete the survey. However, in practice, not everyone participates for a variety of
reasons, ranging from technical issues to personal motivation. Since the OPM FEVS is voluntary, and
there are cases that cannot be located (recipient is out of the office, undeliverable invites, etc.), biases
can occur when some subgroups participate more or less than other subgroups. The use of weighted
data attempts to account for these nonresponse biases when calculating the survey scores. Using
weighted data results in statements that can be made about the Federal employee population as a
whole, rather than limited to simply only those who responded to the survey.
For the 2022 OPM FEVS, the weighting process used the final disposition codes and information from
the sampling frame. The disposition codes determined whether each employee returned a completed
questionnaire, or if information obtained indicated the employee was ineligible to participate in the
2022 OPM Federal Employee Viewpoint Survey: Technical Report 25

OPM FEVS. Variables used from the sampling frame include the stratum identifier and a set of
demographic variables known for both respondents and non-respondents.
12
Statisticians used a th
ree-step, industry-standard process to develop the full-sample weights. First, the
process calculated base weights for each sampled employee equaling the reciprocal of each individual’s
selection probability. Second, statisticians adjusted the base weights for nonresponse within agency
subgroups. Those adjustments inflate the weights of survey respondents to represent all employees in
the subgroup, including non-respondents and ineligible employees. Third, statisticians used a procedure
known as raking to ensure weighted distributions matched known population distributions by gender,
sub-agency, and minority status within agencies. This technique can increase the precision of survey
estimates. Unless otherwise noted, all 2022 OPM FEVS estimates use the full-sample weights. The full-
sample weights were used to compute measures of precision by using Taylor linearization in all analyses.
For statistical tests that may be conducted on Analysis on Demand (see Chapter 8), the measures of
precision were computed by using replicate weights, which were developed using the Jackknife or JKn
method. See Appendix E for more information on the 2022 OPM FEVS weighting processes and
Appendix F for an illustration of the weight adjustment.
12
The sampling-frame variables were from administrative data in the EHRI-SDM database.
2022 OPM Federal Employee Viewpoint Survey: Technical Report 26

Chapter 6: Data Analysis
This chapter outlines the statistical methodology used to analyze the 2022 OPM FEVS survey responses
received from all 557,778 respondents.
Frequency Distributions
As in prior administrations, the primary data analysis in 2022 included calculating governmentwide,
agency, and subagency frequency distributions for each survey question. In addition, analysts calculated
frequency distributions for demographic groups and work-related characteristics. All percentages and
statistical analyses used weighted data unless noted otherwise.
Distributions of Positive, Negative, and Neutral Responses
Many of the OPM FEVS items were on 5-point Likert-type response scales. Three such scales used:
(a) Strongly Agree, Agree, Neither Agree nor Disagree, Disagree, Strongly Disagree; (b) Very Satisfied,
Satisfied, Neither Satisfied nor Dissatisfied, Dissatisfied, Very Dissatisfied; and (c) Very Good, Good, Fair,
Poor, Very Poor.
Analysts collapsed the positive and negative response options to facilitate managers’ use of the data.
Analysts produced governmentwide, agency, subagency, and other subgroup estimates of the collapsed
positive and negative responses. The proportion of positive, neutral, and negative responses are as
follows:
• Percent Positive: The combined percentages of respondents who answered Strongly Agree or
Agree; Very Satisfied or Satisfied; or Very Good or Good, depending on the item’s response
categories.
• Percent Neutral: The percentage of respondents choosing the middle response option in the 5-
point scale (Neither Agree nor Disagree, Neither Satisfied nor Dissatisfied, Fair).
• Percent Negative: The combined percentages of respondents answering Strongly Disagree or
Disagree; Very Dissatisfied or Dissatisfied; or Very Poor or Poor, depending on the item’s
response categories.
2022 OPM Federal Employee Viewpoint Survey: Technical Report 27

Do Not Know and No Basis to Judge Responses
For items 8, 12, 15-22, 26-37, 39-42, 44-46, 54-64, 71-84, and 96-99 of the survey, respondents had the
additional option of answering Do Not Know or No Basis to Judge. The responses Do Not Know or No
Basis to Judge were not included in the calculation of response percentages for those items.
Agency Pandemic Response
A small section on the COVID-19 pandemic and return to the worksite was included in 2022 to allow
evaluation of the continued impact of the pandemic on employee experiences and perceptions. Most
items used the Likert-type score response options typically applied to core OPM FEVS survey items. The
survey item regarding current telework schedule was moved to this section as well.
Missing Data
Responses to all OPM FEVS items are voluntary. Since a survey is considered complete if only 25 percent
or more of the non-demographic items have a response, there may be a number of cases with missing
data. Any missing data, or unanswered items by respondents, were not included in the calculation of
response percentages for those items.
Data Suppression
To maintain respondent confidentiality, all demographic results used suppression rules in 2022. If there
were fewer than four responses for a single demographic response option, all results for that question
were suppressed (see Table 7a). If there were fewer than four responses in multiple response options
for a given demographic item, only those results were suppressed, and the remaining data were
displayed (see Table 7b). Note, while the number of respondents (N) is shown in the Tables 7a and 7b
for illustrative purposes, they were not shown in the reports to protect confidentiality.
2022 OPM Federal Employee Viewpoint Survey: Technical Report 28

Table 7a. Sample full data suppression
What is your supervisory status?
N
%
Non-Supervisor
50
--
Team Leader
25
--
Supervisor
15
--
Manager
8
--
Senior Leader
2
--
Total
100
--
Table 7b. Sample partial data suppression
What is your supervisory status?
N
%
Non-Supervisor
60
60%
Team Leader
25
25%
Supervisor
10
10%
Manager
3
--
Senior Leader
2
--
Total
100
--
Indices
The 2022 OPM FEVS reported four indices. These composite measures join specific observations
(i.e., individual survey items) into more general dimensions or constructs, and include: Employee
Engagement Index, the Global Satisfaction Index, the Performance Confidence Index, and the new
Diversity, Equity, Inclusion, and Accessibility (DEIA) Index. The next sections review each index in turn.
Employee Engagement Index
The Employee Engagement Index is a measure of the conditions conducive to engagement. The index
consists of 15 items grouped into three subindices: Leaders Lead, Supervisors, and Intrinsic Work
Experience (see Table 8).
Analysts calculated subindex scores by averaging the unrounded percent positive of each of the items in
the subindex. Averaging the three unrounded subindex scores created the overall Employee
Engagement score. Index and subindex scores were rounded for reporting purposes.
2022 OPM Federal Employee Viewpoint Survey: Technical Report 29

Table 8. Employee Engagement Index (15 items)
Employee Engagement Index (3 Subindices)
Leaders Lead (5 items)
55
In my organization, senior leaders generate high levels of motivation and commitment in the
workforce.
56
My organization’s senior leaders maintain high standards of honesty and integrity.
57
Managers communicate the goals of the organization.
59
Overall, how good a job do you feel is being done by the manager directly above your immediate
supervisor?
60
I have a high level of respect for my organization’s senior leaders.
Supervisors (5 items)
46
Supervisors in my work unit support employee development.
48
My supervisor listens to what I have to say.
49
My supervisor treats me with respect.
50
I have trust and confidence in my supervisor.
52
Overall, how good a job do you feel is being done by your immediate supervisor?
Intrinsic Work Experience (5 items)
2
I feel encouraged to come up with new and better ways of doing things.
3
My work gives me a feeling of personal accomplishment.
4
I know what is expected of me on the job.
6
My talents are used well in the workplace.
7
I know how my work relates to the agency’s goals.
Global Satisfaction Index
Global Satisfaction Index is a combination of four items assessing employees’ satisfaction with their job,
their pay, and their organization, plus their willingness to recommend their organization as a good place
to work (see Table 9).
Analysts calculated the overall Global Satisfaction Index scores by averaging the unrounded percent
positive of each of the four items. Index scores were rounded for reporting purposes.
Table 9. Global Satisfaction Index (4 items)
Global Satisfaction (4 items)
43
I recommend my organization as a good place to work.
68
Considering everything, how satisfied are you with your job?
69
Considering everything, how satisfied are you with your pay?
70
Considering everything, how satisfied are you with your organization?
Performance Confidence Index
The Performance Confidence Index is a combination of five items assessing employees’ perception of
their work unit’s ability to achieve goals and produce work at a high level (see Table 10). In the 2020
2022 OPM Federal Employee Viewpoint Survey: Technical Report 30

Governmentwide Management Report it is discussed as workplace effectiveness. The construct of
Performance Confidence is defined as “The extent to which employees believe their organization has an
outstanding competitive future, based on innovative, high quality products and services that are highly
regarded by the marketplace.”
13
The OPM Survey Analysis team leveraged Wiley’s Performance
Confidence Index as a starting point to develop a Performance Confidence Index for the OPM FEVS to
capture the key perceptions Federal employees have regarding the performance of their agencies. A
survey of Chief Human Capital Officers (CHCO) in 2017 and 2018 confirmed Performance Confidence as
a critical dimension to include on future OPM FEVS administrations.
The original items used by Wiley were reviewed and modified to ensure meaningfulness for Federal
employees. First was an extensive review of the literature, followed by a series of internal expert
reviews that resulted in proposed revisions. To vet and refine the proposed content, a feedback survey
and a series of virtual meetings were held with the Interagency OPM FEVS Improvements Workgroup,
whose members span 15 Federal agencies. This input was crucial to ensure the relevance, applicability,
and usability of the new index to the broad base of OPM FEVS constituents. Lastly, a series of cognitive
interviews were conducted with OPM employees on items comprising the new index to identify and
address any issues in item wording/clarity and response option selection.
The Performance Confidence items were tested as a part of the 2018 pilot survey data collection and
finalized items were included on the 2019 and 2020 OPM FEVS (modified for COVID-19 pandemic). For
the 2022 OPM FEVS it was included in the core section of the survey.
Table 10. Performance Confidence Index (4 items)
14
Performance Confidence (4 items)
19
Employees in my work unit meet the needs of our customers.
20
Employees in my work unit contribute positively to my agency’s performance.
21
Employees in my work unit produce high-quality work.
22
Employees in my work unit adapt to changing priorities.
13
Wiley, J. W., & Lake, F. (2014). Inspire, Respect, Reward: Re-framing leadership assessment and development. Strategic HR
Review, 13(6), 221–226.
Wiley, J. W. & Davis, S. L. (SIOP April 2017). Leaders Employees Absolutely Love: Assessing and Developing the Next
Generation of Successful Leaders.
Wiley, J. W. (2014). Using employee opinions about organizational performance to enhance employee engagement surveys:
Model building and validation. People and Strategy, 36(4), 38.
14
In 2019 and 2020 the Performance Confidence Index contained 5 items. After further statistical analysis, the item that read,
“Employees in my work unit achieve our goals,” was found to be redundant with other survey items. As a result, it was
removed from the survey.
2022 OPM Federal Employee Viewpoint Survey: Technical Report 31

Diversity, Equity, Inclusion, and Accessibility (DEIA) Index
OPM developed the new Diversity, Equity, Inclusion, and Accessibility (DEIA) Index for the 2022 OPM
FEVS to align with both current government priorities and current research. This measure was
specifically designed in response to Executive Order 14035
15
which feature four distinct factors:
diversity, equity, inclusion, and accessibility. These four factors are included as subindices in the survey.
The items included in the DEIA Index are the result of an extensive literature review of recent DEIA
research. Collaboration with the OPM Diversity and Inclusion (OPM D&I) Program, survey experts at the
Census Bureau, the Federal Committee on Statistical Methodology Sexual Orientation and Gender
Identity (SOGI) group, and subject matter experts across government as represented by members of the
Federal Diversity and Inclusion (D&I) community and the Chief Human Capital Officer (CHCO) DEIA
working group further vetted and provided input on DEIA survey items. These items were further tested
on the 2021 OPM FEVS.
The data from the 2021 OPM FEVS DEIA test was analyzed through standard psychometric statistical
analysis that included individual item analysis for variability and missing data, internal reliability tests,
confirmatory and exploratory factor analyses, and correlation analysis for existing OPM FEVS indices.
Item selection was based on best model fit as well as actionability. It was of paramount importance that
agencies be able to take action on items included in the DEIA index.
The DEIA Index is comprised of 13 items grouped into four subindices (see Table 11). Definitions of the
four subindices are:
• Diversity: The practice of including the many communities, identities, races, ethnicities,
backgrounds, abilities, cultures, and beliefs of the American people, including underserved
communities;
• Equity: The consistent and systematic fair, just, and impartial treatment of all individuals,
including individuals who belong to underserved communities that have been denied such
treatment;
• Inclusion: The recognition, appreciation, and use of the talents and skills of employees of all
backgrounds;
15
The text for EO 14035 can be found here: https://www.federalregister.gov/documents/2021/06/30/2021-14127/diversity-
equity-inclusion-and-accessibilit
y-in-the-federal-workforce
2022 OPM Federal Employee Viewpoint Survey: Technical Report 32

• Accessibility: The design, construction, development, and maintenance of facilities, information
and communication technology, programs, and services so that all people, including people with
disabilities, can fully and independently use them.
Analysts calculated subindex scores by averaging the unrounded percent positive of each of the items in
the subindex. Averaging the four unrounded subindex scores created the overall DEIA Index score. Index
and subindex scores were rounded for reporting purposes.
Table 11. Diversity, Equity, Inclusion, Accessibility (DEIA) Index (13 items)
DEIA Index (4 Subindices)
Diversity (2 items)
71
My organization’s management practices promote diversity (e.g., outreach, recruitment, promotion
opportunities).
72
My supervisor demonstrates a commitment to workforce diversity (e.g., recruitment, promotion
opportunities, development).
Equity (3 items)
73
I have similar access to advancement opportunities (e.g., promotion, career development, training) as
others in my work unit.
74
My supervisor provides opportunities fairly to all employees in my work unit (e.g., promotions, work
assignments).
75
In my work unit, excellent work is similarly recognized for all employees (e.g., awards,
acknowledgements).
Inclusion (5 items)
77
Employees in my work unit make me feel I belong.
78
Employees in my work unit care about me as a person.
79
I am comfortable expressing opinions that are different from other employees in my work unit.
80
In my work unit, people’s differences are respected.
81
I can be successful in my organization being myself.
Accessibility (3 items)
82
I can easily make a request of my organization to meet my accessibility needs.
83
My organization responds to my accessibility needs in a timely manner.
84
My organization meets my accessibility needs.
2022 OPM Federal Employee Viewpoint Survey: Technical Report 33
Chapter 7: Public Release Data Files
Data Masking Methodology for Disclosure Avoidance
Starting in 2016, the OPM FEVS Public Release Data Files (PRDF) uses a new method to identify at-risk
individuals, and an optimized masking process to reduce the risk of re-identification and disclosure of
confidential survey responses while maximizing the amount of demographic data that can be kept
intact. There are two key elements in the OPM FEVS data that can be used to identify individuals: where
the employee works, and their demographic data. The combination of these two elements is what the
Public Release Data File seeks to protect, and it does so in several steps.
1. Collapses agencies and work units that do not meet a minimum number of respondents, into
“all other” categories. For 2022, we limited the work unit identifier to just the agency level, and
only for agencies with at least 750 respondents.
2. Collapses categories to reduce the distinctiveness in the demographic data. For instance,
collapsing the multiple age categories into a dichotomous Over/Under 40 variable helps protect
the very small groups at the younger and older ends of the age groups.
3. Collapses at-risk groups into groups that are not at-risk by masking one or more of their
demographic responses. For 2022, a group is considered at-risk if there are fewer than 5
respondents with the exact combination of demographics and work unit.
The combination of work unit and demographics creates what is called a “cell,” and it allows us to
identify at-risk groups. The diagram below provides a depiction of a cell and its parts:
Cell
OMBABXB
Breakdown
OM
B
A
B
X
B
Key
Agency Code
Minority Status
Sex
Disability Status
Supervisory Status
Veteran Status
A cell is compiled for every respondent. Frequencies are then run to identify which cells are at-risk and
which ones are not. At-risk cells have subsequent cycles of masking applied until they either collapse
into a cell that is not at risk, or all of the demographic information is masked, as demonstrated next.
Data Masking Procedure
Once the at-risk cells and not-at-risk cells are identified and separated, the masking procedure can
begin. On the at-risk list, the original cell is copied with a modification—for a cell made up of five
2022 OPM Federal Employee Viewpoint Survey: Technical Report 34

demographics, that means there are five copies, each modified to “mask” one of the demographic
values, meaning it is changed to missing.
Original Demographic 1 Demographic 2 Demographic 3 Demographic 4 Demographic 5
OMBABXB OMXABXB OMBXBXB OMBAXXB OMBABXB OMBABXX
Each of these five modified cells is checked against the not-at-risk list of cells for a match. If a modified
cell appears on the not-at-risk list, then the original cell that was at-risk will be replaced with that
modified cell. By doing this, the respondents in the at-risk cell get added to the respondents in the not-
at-risk cell, and they will not be considered at-risk going forward. In the case of multiple modified at-risk
cells matching to multiple cells from the not-at-risk list, the not-at-risk cell with the smallest number of
respondents is chosen as the replacement. The more people in a cell the more difficult it is to re-identify
someone, so adding them to the smaller cell is the logical choice. In the case of a tie, the left-most
modified cell is chosen.
For example, if modified cell 1 (OMXABXB) and modified cell 5 (OMBABXX) both have a match to not-at-
risk cells, but modified cell 1 matches to a not-at-risk cell of seven people and modified cell 5 matches to
a not-at-risk cell of eleven people, then modified cell 1 will be chosen to replace the original cell. In this
example, the original cell, OMBABXB would be replaced with OMXABXB.
If there are no matches between any of the modified cells and the not-at-risk cells, then a default
masking step is made—the left-most remaining demographic value will be masked.
Once all of the original at-risk cells are replaced with a newly masked cell, all cells are recounted, and at-
risk and not-at-risk cells are divided again. The process repeats like this, with the sequentially modified
cells and the default masking steps replacing demographics values until either a not-at-risk match is
found, or all of the demographics are masked and there’s no more risk.
Original Iteration 1 Iteration 2 Iteration 3 Iteration 4 Iteration 5
OMBABXB OMXABXB OMXXBXB OMXXXXB OMXXXXB OMXXXXX
Once there are no more at-risk cells, the final cell is broken back out into the individual demographic
components that make it up, and all “X” values are removed. This is the data that appears in the final
dataset. From here, anyone who attempts to identify an individual record using work unit and
demographic information will be met with at least five identical individuals who meet that description.
2022 OPM Federal Employee Viewpoint Survey: Technical Report 35

Chapter 8: Presentation of Results
This chapter details the eight types of reports that were produced from the 2022 OPM FEVS, as well as
the tools for report dissemination and performing online analyses on demand. OPM distributed survey
findings in the following reports:
• Governmentwide reports
• Response Rate reports
• All Levels, All Indices, All Items reports
• Annual Employee Survey (AES) reports
• Agency Management reports
• Subagency reports
• Demographic Comparison reports
• Occupational Series reports
Table 12 shows a listing of the reports with the approximate number of each type produced.
16
All
generated reports are 508 compliant. The Governmentwide reports are on the 2022 FEVS public website
(www.opm.gov/FEVS
), and individual agency r
eports were distributed via the FEVS Online Analysis and
Reporting Tool (WesDaX hosted by Westat). These reports are outlined in more detail in the sections
below.
Table 12. 2022 OPM FEVS Reports
Report Type
Number of Reports
2019
2020
2021
2022
1. Governmentwide Reports
1
1
1
2
Governmentwide Management Report
1
1
1
1
Governmentwide All Levels-All Index-All
Items Reports
-- -- -- 1
2. Response Rate Reports
--
--
--
780
Agency level Response Rate Reports
--
--
--
86
1
st
level Response Rate Reports
--
--
--
694
3. All Levels, All Indices, All Items Reports
775
765
813
775
Agency level All Levels Reports
84
83
76
81
1
st
level All Levels Reports
691
682
737
694
16
For the 2021 OPM FEVS, there was streamlined reporting. No Management reports or subagency reports were generated.
2022 OPM Federal Employee Viewpoint Survey: Technical Report 36

Table 12. 2022 OPM FEVS Reports (continued)
Report Type
Number of Reports
2019 2020 2021 2022
4. Annual Employee Survey (AES) Reports 775 765 816 778
Agency level AES Reports 86 85 81 86
1
st
level AES Reports 689 680 735 692
5. Management Reports 84 83 -- 81
Agency Management Reports 42 41 -- 40
Small Agency Management Reports 42 42 -- 41
6. Subagency Reports 29,516 30,077 -- 30,242
1st level comparison 59 60 -- 60
1st level breakout 555 553 -- 575
2nd level comparison 406 400 -- 410
2nd level breakout 2,284 2,249 -- 2,189
3rd level comparison 1,309 1,304 -- 1,246
3rd level breakout 5,621 5,520 -- 5,294
4th level comparison 1,951 1,944 -- 2,028
4th level breakout 6,476 7,066 -- 6,709
5th level comparison 1,426 1,389 -- 1,654
5th level breakout 3,874 3,854 -- 4,345
6th level comparison 919 986 -- 1,059
6th level breakout 2,091 2,205 -- 2,277
7th level comparison 416 476 -- 429
7th level breakout 1,060 1,069 -- 1,024
8th level comparison 245 274 -- 196
8th level breakout 484 523 -- 484
9th level comparison 107 83 -- 89
9th level breakout 231 122 -- 174
7. Demographic Comparison Reports 876 1,118
896 948
8. Occupational Series Reports 775 765 -- 657
Agency level Occupational Series Reports 84 83 -- 61
1
st
level Occupational Series Reports 691 682 -- 596
WesDaX Unlimited Unlimited Unlimited Unlimited
Total 32,027 32,809 2,526 34,263
“--” indicates those reports were either not produced or were preconfigured reports for the year.
Governmentwide Reports
The 2022 Government Management Report includes an overview of the respondents compared to the
total Federal workforce, response rates over time, highlights from the 2022 OPM FEVS, trending of the
AES item results from 2018 to 2022, top-performing agencies on the various indices, and results from
new topic areas added to the survey in 2022. The report has five appendices. Appendices in the
Governmentwide Management Report also contain a link to download them in Microsoft® Excel.
2022 OPM Federal Employee Viewpoint Survey: Technical Report 37

Other governmentwide data reports generated include:
• Governmentwide All Levels-All Index-All Items: Governmentwide and grouped Agency results by
the five size categories (very small, small, medium, large, very large) for all OPM FEVS items and
indices.
• Report by Agency: Displays question-by-question counts and percentages for each response
option for the 2022 OPM FEVS, by participating agency and governmentwide. Counts of
responses are unweighted, but the percentage estimates for each question are weighted.
• Report by Demographics: Displays question-by-question counts and percentages for each
response option for the 2022OPM FEVS, by demographic groups and governmentwide. Counts
of responses are unweighted, but the percentage estimates for each response category are
weighted.
• Report on Demographic Questions by Agency (Unweighted): Displays counts and percentages by
participating agencies’ demographic and workforce profile (e.g., work location, supervisory
status, sex, age, pay category, intention to retire) for 2022. Both respondent counts and
percentage estimates are unweighted.
• Response Rate by Agency: Displays for each participating agency their size category, number of
employees surveyed, number of respondents, and response rate.
All Levels, All Indices, All Items Reports
The All Levels, All Indices, All Items Reports provide a comprehensive summary of all OPM FEVS non-
demographic items and index scores for agencies and their subcomponents with at least 10
respondents. It includes index and subindex scores for the Employee Engagement Index, Global
Satisfaction Index, and Performance Confidence Index. It also includes the percent positive, neutral, and
negative results for each non-demographic item across the subagencies. Results were weighted and can
be benchmarked against the Governmentwide and agency size numbers. These reports were produced
in Microsoft® Excel and were generated for agencies and subcomponents with at least 10 respondents.
Annual Employee Survey Reports
The Annual Employee Survey (AES) Report provides weighted agency data for all non-demographic items
on the FEVS, with the 16 items mandated by 5 CFR Part 250 Subpart C denoted with an asterisk. These
reports include the following:
• number and proportion of responses in each response category,
• the proportion of positive and negative responses to each survey item (where relevant),
2022 OPM Federal Employee Viewpoint Survey: Technical Report 38

• the proportion of positive, neutral, and negative responses to each survey item (where relevant)
for 2019 to 2022 historical data for trending,
• proportions of responses for the current telework schedule,
• agency-specific items,
• the unweighted percentages to the demographic questions.
The AES report was produced in Microsoft® Excel and generated for each of the participating agencies
with at least 4 respondents, and for each of the 694 1
st
level subagencies with at least 10 respondents.
Additionally, for the 58 agencies that added agency-specific items to the OPM FEVS, the results for these
items were also included in the AES. The 2022 AES reports were made to meet Section 508 standards for
accessibility.
Management Reports
For the 2022 OPM FEVS, OPM’s data presentation for the Management Reports included:
• 40 Agency Management Reports for the Departments, large, and medium agencies
• 41 Small Agency Management Reports for the small and independent agencies
The Agency Management Report (AMR) and Small Agency Management (SAM) Reports provide similar
content, the AMRs for large and medium agencies and the SAMs for the small agencies. These reports
were only provided to agencies with at least 10 responses. The following sections provide more
information about these reports.
Agency Management Report (AMR)
The AMRs were designed to help agency directors and managers identify what they can do to improve
management in their agencies. The agency management reports included the following information:
• A guide to understanding and using the results from the OPM FEVS;
• A section entitled “Respondent Overview.” This section provides survey administration
information (data collection period, sample size, agency and subagency response rates, agency
results margin of error), and highlights of the 2022 OPM FEVS agency respondent
characteristics;
• A series of sections that display scores and trends for the agency, subagencies, and
governmentwide for: Employee Engagement Index, Global Satisfaction, Performance
Confidence, DEIA;
2022 OPM Federal Employee Viewpoint Survey: Technical Report 39

• A series of Decision Aid tables that present all items that increased, decreased, or did not
change since 2021 as well as items considered a strength, challenge or caution item, when items
became a new strength or were a past strength, and a feature highlighting if the question was in
the top 10 positive or negative items;
• Four appendices showing results for all items benchmarked against the governmentwide
percent positive, index scores and rankings of agencies, demographic results, and a list of all
participating agencies by employee population size.
Small Agency Management Report (SAM)
The SAMs are almost identical to the AMRs but designed specifically for small agencies, and provide
comparisons to other small agencies, rather than the governmentwide averages. The Small Agency
Management reports include:
• A guide to understanding and using the results from the OPM FEVS;
• A section for agencies that administered respondent characteristic and demographic questions
entitled “Respondent Overview”. This section provides survey administration information (data
collection period, sample size, agency and subagency response rates, agency results margin of
error), and highlights of the 2022 OPM FEVS agency respondent characteristics;
• A series of sections that display scores and trends for the agency, subagencies, and
governmentwide for: Employee Engagement Index, Global Satisfaction, Performance
Confidence, DEIA;
• A series of Decision Aid tables that present all items that increased, decreased, or did not
change since 2021 as well as items considered a strength, challenge or caution item, when items
became a new strength or were a past strength, and a feature highlighting if the question was in
the top 10 positive or negative items;
• Four appendices showing results for all items benchmarked against the governmentwide
percent positive, index scores and rankings of agencies, demographic results, and a list of all
participating agencies by employee population size.
Subagency Reports
Each agency and their components or subagencies (down to the 9th level where applicable) received
separate reports showing the percent positive, neutral, and negative results for each item across the
subagencies. These results include weighted percentage data for all survey items and the unweighted
demographic responses. The subagency reports for each level (1st – 9th) include both a comparison and
a breakout report.
• The Comparison Reports provide the governmentwide, agency, and the specific level results
(e.g., the 2nd level comparison had the governmentwide, agency, 1st level, and all 2nd level
2022 OPM Federal Employee Viewpoint Survey: Technical Report 40

subagencies’ results). In the reports for the 4th level subagency and lower, the higher-level
results (e.g., governmentwide, agency) were dropped for simplicity.
• The Breakout Reports provide the governmentwide, agency, and one specific level result (e.g.,
the 2nd level Breakout report had the governmentwide, agency, 1st level, and one 2nd level
subagency results rather than comparing all 2nd level subagencies as in the comparison
reports). In the reports for the 4th level subagency and lower, the higher- level results (e.g.,
governmentwide, agency) were dropped for simplicity. These reports also include two sections
which highlighted the level’s top 10 positive and negative items, as well as items in which they
are leading or trailing the level directly above their level (e.g., 4th level would be compared to
the 3rd level subagency).
These reports also include an Microsoft® Excel® file, which provide the results in electronic form to allow
agency leaders to sort the data as needed. No reports were produced when a subagency had fewer than
10 respondents.
Demographic Comparison Reports
The demographic comparison reports provide item level results by demographic characteristics for each
of the agencies that answered the demographic section of the survey and had enough responses after
suppression to generate a report. The results included weighted percentage data for all survey items by
the 19 demographic variables:
• Work Location,
• Supervisory Status
• Gender
• Ethnicity
• Race
• Education Level
• Pay Category
• Federal Tenure
• Agency Tenure
• Retirement Plans
• Turnover Intentions
• Sexual Orientation
• Gender Identity
• Military Service Status
• Military Spouse
• Military Spouse Non-Competitive Hiring
Authority
• Disability Status
• Age Group
• Generations
For the demographic reports, several additional suppression rules applied for confidentiality reasons.
• All results for a demographic response category were suppressed if there were fewer than 10
respondents within an agency on a demographic response category. For example, if there were
2022 OPM Federal Employee Viewpoint Survey: Technical Report 41

fewer than 10 respondents that marked Asian in the race item, no results for the OPM FEVS
items were displayed for that response category in the report for that agency.
• If there were fewer than 10 respondents within an agency on a demographic response category
for any given OPM FEVS item, the results for that item for that response category were
suppressed. For example, if Q1 had fewer than 10 responses for the Black or African American
race category, results would be suppressed.
• If there were fewer than 4 respondents to a single demographic response category (e.g., only 2
respondents marked “Native Hawaiian or Other Pacific Islander within an agency but all other
race categories had 10 or mores responses), the report was not generated (an exception was
made for the Generations demographic variable report).
• A report was not generated if there was only one demographic category (e.g., Female) with data
that would not be suppressed for all the survey items based on the suppression rules.
• Applicable to the sexual orientation and transgender report only, there also needed to be at
least 30 respondents answering the demographic question within the agency in order for the
report to be produced. All other suppression rules still applied.
These reports also include a Microsoft® Excel® file, which provides the results in electronic form to allow
agency leaders to sort the data as needed.
Occupational Series Reports
Each agency and 1
st
level subagencies received separate reports showing the percent positive, neutral,
and negative results for each item and each occupational series. These results include weighted
percentage data for the core survey items. The reports provide the governmentwide and agency results
as well as the results for all occupational series with at least 10 respondents.
These reports also include an Microsoft® Excel® file, which provide the results in electronic form to allow
agency leaders to sort the data as needed .
Delivery of Agency Results, Reports, & Ad Hoc Analyses –
WesDaX
The FEVS Online Analysis and Reporting tool is run by Westat’s Data Xplorer (WesDaX) and is an online
query and analysis system. It allows OPM and Federal agency users to view and download their reports
by following the links as illustrated in Figure 3. The online reporting system is available for users to
access their data at any time.
2022 OPM Federal Employee Viewpoint Survey: Technical Report 42
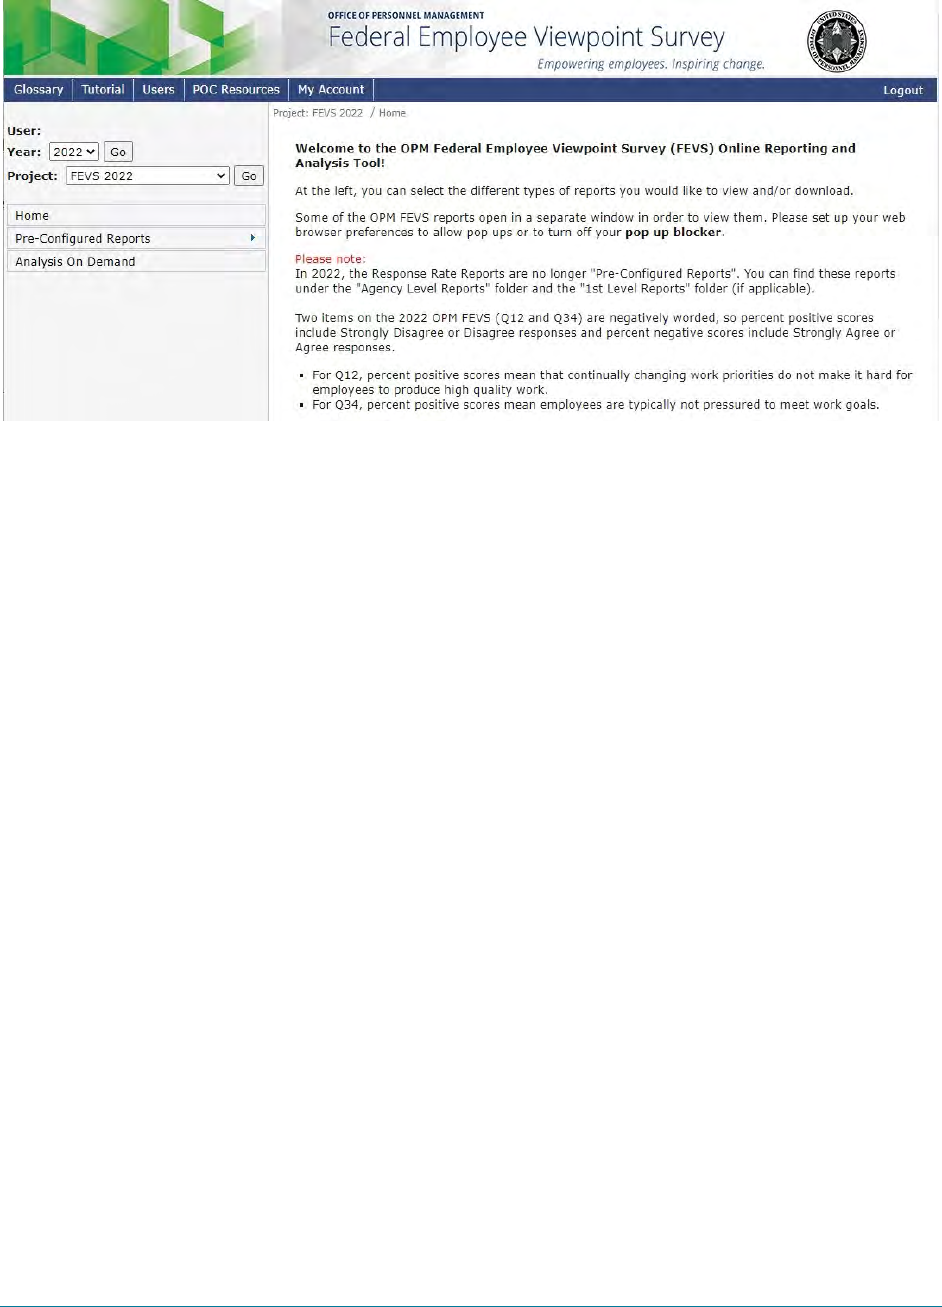
Figure 3. FEVS Online Analysis and Reporting Tool—main menu
The following
2022 OPM FEVS reports are able to be viewed/downloaded using the FEVS Online Analysis
and Reporting tool:
Governmentwide Reports:
Users are able to view/download the following PDF report:
• Governmentwide Management Report
Agency-Level Reports:
Users are able to view/download their agency-level reports. These include the following:
• Response Rate Reports,
• All Levels, All Indices, All Items Reports,
• Annual Employee Survey Reports,
• Agency Management Reports,
• Occupational Series Reports, and
• Demographic Comparison Reports.
2022 OPM Federal Employee Viewpoint Survey: Technical Report 43

1
st
Level Reports:
Users are able to drill down and view/download for any 1
st
level subagency reports provided. These
include the following:
• 1
st
Level Response Rate Reports
• 1
st
Level All Levels All Indices All Items Reports,
• 1
st
Level Annual Employee Survey (AES) Report,
• 1
st
Level Subagency Comparison Reports,
• 1
st
Level Subagency Breakout Report, and
• 1
st
Level Occupational Series Reports.
Cart
Similar to online shopping carts, this feature allows users to add multiple reports from the different
report options to a cart to download at one time. The feature zips all selected reports into one file for
downloading to a location of the user’s choice. In addition to being able to view and download the
above reports through WesDaX, users have access to Analysis on Demand feature.
Analysis on Demand
This feature allows users to drill down into the data to explore relationships of interest. Users can subset
the data by year, select variables from a list, and produce simple frequency distributions, two-way tables
(cross-tabulation), three-way tables, and trend analysis (only for large agencies). A select-all feature
allows users to be able to select or deselect all variables from a list.
After selecting the year(s), users can choose the type of table for a simple frequency, or two-way or
three-way table or trends over time. They can also select their variables of interest, as well as types of
statistics desired (e.g., weighted number of responses, cell, row, or column percentages, standard
errors, confidence intervals, etc.). It should be noted that statistical analysis such as standard errors,
confidence intervals, chi-square tests and significance testing for trends are only available for large
agencies. Optional features are to filter the data by a subagency, demographic, or responses to an item,
and/or benchmark to compare results to the entire dataset or specific agencies. A set of video tutorials
facilitate use of Analysis on Demand: https://www.dataxplorer.com/Pu
blic/TutorialFEVS.aspx
.
2022 OPM Federal Employee Viewpoint Survey: Technical Report 44

Users can tailor the type of analysis to their interests and download the analysis output. Queries are
automatically saved, and users are able to view/download the results upon logging in. This feature
allows users to be able to run multiple queries simultaneously and not have any time-out issues. The
twenty most recent queries are automatically saved for users.
Users can share queries with all users from their agency. They can share queries with users from their
own subagency or users from other subagencies within the same agency. For example, a user from the
Office of the Director of OPM can share queries within their own component and with users from the
Office of the Inspector General of OPM. This sharing feature helps minimize the need to recreate
queries that are commonly used.
Since 2014, users can create charts from results in Analysis on Demand. Users were able to select
various chart types (bar, pie, donut, line, and area), chart size, color palette, and data cells. Users could
specify to include or exclude the data values within the chart. For 2022, new folders include the Paid
Parental Leave items. Figure 4 provides the main menu for Analysis on Demand displaying the new
folders for 2022.
Figure 4. FEVS Online Analysis and Reporting Tool — Analysis on Demand Main Menu
2022 OPM Federal Employee Viewpoint Survey: Technical Report 45

Account Access
All agency level and 1
st
level points of contacts (POC) and users were carried over from 2021 and
provided access to 2022 data. POCs also have the capability to grant access to the online reporting tool
to others in their agency. This access could be given for all agency results or to only certain 1
st
level
subagencies. For 1
st
level access, the individual would only be able to view or review data for their 1
st
level subagency, the agency overall, and governmentwide results.
Summary of Quality Control Process
To ensure the highest accuracy and validity of the data, each number within each report goes through
two levels of quality control (QC) by Westat. The first level of QC for the reports is the electronic quality
control with the use of SAS® software. Two programmers create the numbers independently based on a
set of pre-defined specifications and then electronically compared the numbers to ensure they matched.
The second level of QC is performed by staff members who compare the input (SAS-produced results) to
the output (the actual report with the data incorporated into it). While each type of report has a
different QC process due to the different types of data, the general process is the same. Staff members
are put into teams of two to ensure the highest level of accuracy when comparing data. One staff
member reads off each number from the input data, and the other staff member reads off the number
from the output data. If they match, a check mark is placed by the number. If they do not match, they
inform the QC manager, who relays the error to the project manager and programmers to get it fixed. If
the error is due to a problem with the code, the output data reports are re-run and the staff members
go back and QC the new reports. The QC manager keeps all finished reports in a locked filing cabinet to
ensure security in case there is a need to review them.
2022 OPM Federal Employee Viewpoint Survey: Technical Report 46

Appendix A: Item Change Summary
OPM FEVS items were modified in 2022 for a variety of reasons, often to improve the interpretation,
understanding, or actionability of the items. These changes are in this appendix. Also included in this
appendix are changes to item numbering from the 2021 to 2022 OPM FEVS for items in the core survey.
Table A1. 2022 OPM FEVS Item Text Changes
2022 Item #
New Item Text (2022)
Change
2021 Item #
Previous Item Text (2021)
9
I have enough information to do my
job well.
Returned
from 2019
N/A
Not an item in the 2021 OPM FEVS.
10
I receive the training I need to do my
job well.
Revised
from 2019
N/A
Not an item in the 2021 OPM FEVS.
N/A
Not an item in the 2022 OPM FEVS
Not
included
10
In my work unit, steps are taken to deal
with a poor performer who cannot or
will not improve.
11
I am held accountable for the quality
of work I produce.
New item
N/A
Not an item in the 2021 OPM FEVS.
12
Continually changing work priorities
make it hard for me to produce high
quality work.
New item
N/A
Not an item in the 2021 OPM FEVS.
13
I have a clear idea of how well I am
doing my job.
New item
N/A
Not an item in the 2021 OPM FEVS.
17
Employees in my work unit share job
knowledge.
Revised
from 2019
N/A
Not an item in the 2021 OPM FEVS.
23
New hires in my work unit (i.e. hired
in the past year) have the right skills
to do their jobs.
Revised
from 2019
N/A
Not an item in the 2021 OPM FEVS.
24
I can influence decisions in my work
unit.
New item
N/A
Not an item in the 2021 OPM FEVS.
25
I know what my work unit’s goals are.
New item
N/A
Not an item in the 2021 OPM FEVS.
26
My work unit commits resources to
develop new ideas (e.g., budget, staff,
time, expert support).
New item
N/A
Not an item in the 2021 OPM FEVS.
27
My work unit successfully manages
disruptions to our work.
New item
N/A
Not an item in the 2021 OPM FEVS.
2022 OPM Federal Employee Viewpoint Survey: Technical Report 47

2022 Item #
New Item Text (2022)
Change
2021 Item #
Previous Item Text (2021)
28
Employees in my work unit
consistently look for new ways to
improve how they do their work.
New item
N/A
Not an item in the 2021 OPM FEVS.
29
Employees in my work unit
incorporate new ideas into their work.
New item
N/A
Not an item in the 2021 OPM FEVS.
30
Employees in my work unit approach
change as an opportunity.
New item
N/A
Not an item in the 2021 OPM FEVS.
31
Employees in my work unit consider
customer needs a top priority.
New item
N/A
Not an item in the 2021 OPM FEVS.
32
Employees in my work unit
consistently look for ways to improve
customer services.
New item
N/A
Not an item in the 2021 OPM FEVS.
33
Employees in my work unit support
my need to balance my work and
personal responsibilities.
New item
N/A
Not an item in the 2021 OPM FEVS.
34
Employees in my work unit are
typically under too much pressure to
meet work goals.
New item
N/A
Not an item in the 2021 OPM FEVS.
37
My organization is successful at
accomplishing its mission.
Text
change
16
My agency is successful at accomplishing
its mission.
38
I have a good understanding of my
organization’s priorities.
New item
N/A
Not an item in the 2021 OPM FEVS.
39
My organization effectively adapts to
changing government priorities.
New item
N/A
Not an item in the 2021 OPM FEVS.
40
My organization has prepared me for
potential physical security threats.
Revised
from 2019
N/A
Not an item in the 2021 OPM FEVS.
41
My organization has prepared me for
potential cybersecurity threats.
New item
N/A
Not an item in the 2021 OPM FEVS.
42
In my organization, arbitrary action,
personal favoritism and/or political
coercion are not tolerated.
Revised
from 2019
N/A
Not an item in the 2021 OPM FEVS.
51
My supervisor holds me accountable
for achieving results.
Revised
from 2019
N/A
Not an item in the 2021 OPM FEVS.
53
My supervisor provides me with
constructive suggestions to improve
my job performance.
Returned
from 2019
N/A
Not an item in the 2021 OPM FEVS.
54
My supervisor provides me with
performance feedback throughout
the year.
Revised
from 2019
N/A
Not an item in the 2021 OPM FEVS.
2022 OPM Federal Employee Viewpoint Survey: Technical Report 48

2022 Item #
New Item Text (2022)
Change
2021 Item #
Previous Item Text (2021)
62
Management encourages innovation.
Revised
from 2019
N/A
Not an item in the 2021 OPM FEVS.
63
Management makes effective changes
to address challenges facing our
organization.
New item
N/A
Not an item in the 2021 OPM FEVS.
64
Management involves employees in
decisions that affect their work.
New item
N/A
Not an item in the 2021 OPM FEVS.
71
My organization’s management
practices promote diversity (e.g.,
outreach, recruitment, promotion
opportunities).
New item
N/A
Not an item in the 2021 OPM FEVS.
72
My supervisor demonstrates a
commitment to workforce diversity
(e.g., recruitment, promotion
opportunities, development).
New item
N/A
Not an item in the 2021 OPM FEVS.
73
I have similar access to advancement
opportunities (e.g., promotion, career
development, training) as others in
my work unit.
New item
N/A
Not an item in the 2021 OPM FEVS.
74
My supervisor provides opportunities
fairly to all employees in my work unit
(e.g., promotions, work assignments).
New item
N/A
Not an item in the 2021 OPM FEVS.
75
In my work unit, excellent work is
similarly recognized for all employees
(e.g., awards, acknowledgements).
New item
N/A
Not an item in the 2021 OPM FEVS.
76
Employees in my work unit treat me
as a valued member of the team.
New item
N/A
Not an item in the 2021 OPM FEVS.
77
Employees in my work unit make me
feel I belong.
New item
N/A
Not an item in the 2021 OPM FEVS.
78
Employees in my work unit care about
me as a person.
New item
N/A
Not an item in the 2021 OPM FEVS.
79
I am comfortable expressing opinions
that are different from other
employees in my work unit.
New item
N/A
Not an item in the 2021 OPM FEVS.
80
In my work unit, people’s differences
are respected.
New item
N/A
Not an item in the 2021 OPM FEVS.
81
I can be successful in my organization
being myself.
New item
N/A
Not an item in the 2021 OPM FEVS.
2022 OPM Federal Employee Viewpoint Survey: Technical Report 49

2022 Item # New Item Text (2022) Change 2021 Item # Previous Item Text (2021)
82 I can easily make a request of my
organization to meet my accessibility
needs.
New item N/A Not an item in the 2021 OPM FEVS.
83 My organization responds to my
accessibility needs in a timely manner.
New item N/A Not an item in the 2021 OPM FEVS.
84 My organization meets my
accessibility needs.
New item N/A Not an item in the 2021 OPM FEVS.
85 My job inspires me. New item N/A Not an item in the 2021 OPM FEVS.
86 The work I do gives me a sense of
accomplishment.
New item N/A Not an item in the 2021 OPM FEVS.
87 I feel a strong personal attachment to
my organization.
New item N/A Not an item in the 2021 OPM FEVS.
88 I identify with the mission of my
organization.
New item N/A Not an item in the 2021 OPM FEVS.
89 It is important to me that my work
contribute to the common good.
New item N/A Not an item in the 2021 OPM FEVS.
90
What percentage of your work time
are you currently required to be
physically present at your agency
worksite (including headquarters,
bureau, field offices, etc.)?
100%
of my work time
At
least 75% but less than 100%
At
least 50% but less than 75%
At
least 25% but less than 50%
Le
ss than 25%
I am
not currently required to be
physically present at my agency
worksite.
Text
change
45
Since the last OPM FEVS (September and
October 2020), on average what
percentage of your work time have you
been physically present at your agency
worksite (including headquarters,
bureau, field offices, etc.)?
100%
of my work time
At
least 75% but less than 100%
At
least 50% but less than 75%
At
least 25% but less than 50%
Le
ss than 25%
I h
ave not been physically present
at my agency worksite during the
pandemic
91 Please select the response that BEST
describes your current remote work
or teleworking schedule.
Text
change
46 Please select the response that BEST
describes your current teleworking
schedule.
91a What is your current remote work
status?
Not
included
N/A Not an item in the 2021 OPM FEVS.
92 Did you have an approved remote
work agreement before the 2020
COVID-19 pandemic?
Not
included
N/A Not an item in the 2021 OPM FEVS.
2022 OPM Federal Employee Viewpoint Survey: Technical Report 50

2022 Item # New Item Text (2022) Change 2021 Item # Previous Item Text (2021)
93 Based on your work unit’s current
telework or remote work options, are
you considering leaving your
organization, and if so, why?
Text
change
N/A Are you considering leaving your
organization within the next year, and if
so, why?
94 My agency’s re-entry arrangements
are fair in accounting for employees’
diverse needs and situations.
Not
included
N/A Not an item in the 2021 OPM FEVS.
95
Please select the response that BEST
describes how employees in your
work unit currently report to work:
New item N/A Not an item in the 2021 OPM FEVS.
N/A Not an item in the 2022 OPM FEVS Text
change
47 How has your organization supported you
during the COVID-19 pandemic? For each
support listed, choose the best response
from one of the 3 columns: (1) those
supports you needed and have been
available to you, (2) those needed but not
available to you, and (3) those supports
you have not currently needed.
N/A Not an item in the 2022 OPM FEVS Not
included
48 My organization’s senior leaders
demonstrate commitment to employee
health and safety.
N/A Not an item in the 2022 OPM FEVS
Not
included
51
My supervisor shows concern for my
health and safety.
N/A Not an item in the 2022 OPM FEVS
Not
included
18-19 Employees in my work unit…
…successfully collaborate.
…achieve our goals.
N/A Not an item in the 2022 OPM FEVS Not
included
55 My agency’s leadership updates
employees about return to the worksite
planning.
N/A Not an item in the 2022 OPM FEVS Not
included
56 In plans to return more employees to
the worksite, my organization has made
employee safety a top priority.
N/A
Which of the following best
represents how you think of yourself?
St
raight, that is not gay or lesbian
Gay o
r Lesbian
Bise
xual
I u
se a different term
Text
change
N/A
Which one of the following do you
consider yourself to be?
St
raight, that is not gay or lesbian
Gay o
r Lesbian
Bise
xual
So
mething else
2022 OPM Federal Employee Viewpoint Survey: Technical Report 51
Table A2. 2021 vs
2022 OPM FEVS
Item Numbering (Non-COVID)
Any item with “—” in either column was not included in the OPM FEVS survey for that year.
OPM FEVS Item (Non-COVID)
2021 OPM
FEVS #
2022 OPM
FEVS #
I am given a real opportunity to improve my skills in my organization.
1
1
I feel encouraged to come up with new and better ways of doing things.
2
2
My work gives me a feeling of personal accomplishment.
3
3
I know what is expected of me on the job.
4
4
My workload is reasonable.
5
5
My talents are used well in the workplace.
6
6
I know how my work relates to the agency’s goals.
7
7
I can disclose a suspected violation of any law, rule or regulation without fear
of reprisal.
8 8
I have enough information to do my job well.
—
9
The people I work with cooperate to get the job done.
9
14
I receive the training I need to do my job well.
—
10
In my work unit, steps are taken to deal with a poor performer who cannot or
will not improve.
10 —
I am held accountable for the quality of work I produce.
—
11
Continually changing work priorities make it hard for me to produce high
quality work.
— 12
I have a clear idea of how well I am doing my job.
—
13
In my work unit poor performers usually:
11
15
In my work unit, differences in performance are recognized in a meaningful
way.
12 16
Employees in my work unit share job knowledge.
—
17
My work unit has the job-relevant knowledge and skills necessary to
accomplish organizational goals.
13 18
Employees in my work unit meet the needs of our customers.
14
19
Employees in my work unit contribute positively to my agency’s performance.
15
20
Employees in my work unit produce high quality work.
16
21
Employees in my work unit adapt to changing priorities.
17
22
Employees in my work unit successfully collaborate.
18
—
Employees in my work unit achieve our goals.
19
—
Employees are recognized for providing high quality products and services.
20
35
New hires in my work unit (i.e. hired in the past year) have the right skills to do
their jobs.
— 23
I can influence decisions in my work unit.
—
24
I know what my work unit’s goals are.
—
25
My work unit commits resources to develop new ideas (e.g., budget, staff, time,
expert support).
— 26
My work unit successfully manages disruptions to our work.
—
27
Employees are protected from health and safety hazards on the job.
21
36
2022 OPM Federal Employee Viewpoint Survey: Technical Report 52

OPM FEVS Item (Non-COVID)
2021 OPM
FEVS #
2022 OPM
FEVS #
Employees in my work unit consistently look for new ways to improve how
they do their work.
— 28
Employees in my work unit incorporate new ideas into their work. — 29
Employees in my work unit approach change as an opportunity. — 30
Employees in my work unit consider customer needs a top priority. — 31
Employees in my work unit consistently look for ways to improve customer
service.
—
32
Employees in my work unit support my need to balance my work and personal
responsibilities.
—
33
Employees in my work unit are typically under too much pressure to meet
work goals.
— 34
My organization is successful at accomplishing its mission. 22 37
I have a good understanding of my organization’s priorities. — 38
My organization effectively adapts to changing government priorities. — 39
My organization has prepared me for potential physical security threats. — 40
My organization has prepared me for potential cybersecurity threats. — 41
In my organization, arbitrary action, personal favoritism and/or political
coercion are not tolerated.
— 42
I recommend my organization as a good place to work. 23 43
I believe the results of this survey will be used to make my agency a better
place to work.
24 44
My supervisor supports my need to balance work and other life issues. 25 47
My supervisor is committed to a workforce representative of all segments of
society.
26 45
Supervisors in my work unit support employee development. 27 46
My supervisor listens to what I have to say. 28 47
My supervisor treats me with respect. 29 49
I have trust and confidence in my supervisor. 30 50
My supervisor holds me accountable for achieving results. — 51
Overall, how good a job do you feel is being done by your immediate
supervisor.
31 52
My supervisor provides me with constructive suggestions to improve my job
performance.
— 53
My supervisor provides me with performance feedback throughout the year. — 54
In my organization, senior leaders generate high levels of motivation and
commitment in the workforce.
32 55
My organization’s senior leaders maintain high standards of honesty and
integrity.
33 56
Managers communicate the goals of the organization. 34 57
Managers promote communication among different work units (for example,
about projects, goals, needed resources).
35 58
2022 OPM Federal Employee Viewpoint Survey: Technical Report 53

OPM FEVS Item (Non-COVID)
2021 OPM
FEVS #
2022 OPM
FEVS #
Overall, how good a job do you feel is being done by the manager directly
above your immediate supervisor?
36 59
I have a high level of respect for my organization’s senior leaders. 37 60
Senior leaders demonstrate support for work-life programs. 38 61
Management encourages innovation. — 62
Management makes effective changes to address challenges facing our
organization.
—
63
Management involves employees in decisions that affect their work. — 64
How satisfied are you with your involvement in decisions that affect your
work?
39 65
How satisfied are you with the information you receive from management on
what’s going on in your organization?
40 66
How satisfied are you with the recognition you receive for doing a good job? 41 67
Considering everything, how satisfied are you with your job? 42 68
Considering everything, how satisfied are you with your pay? 43 69
Considering everything, how satisfied are you with your organization? 44 70
My organization’s management practices promote diversity (e.g., outreach,
recruitment, promotion opportunities).
—
71
My supervisor demonstrates a commitment to workforce diversity (e.g.,
recruitment, promotion opportunities, development).
—
72
I have similar access to advancement opportunities (e.g., promotion, career
development, training) as others in my work unit.
—
73
My supervisor provides opportunities fairly to all employees in my work unit
(e.g., promotions, work assignments).
—
74
In my work unit, excellent work is similarly recognized for all employees (e.g.,
awards, acknowledgements).
—
75
Employees in my work unit treat me as a valued member of the team. — 76
Employees in my work unit make me feel I belong. — 77
Employees in my work unit care about me as a person. — 78
I am comfortable expressing opinions that are different from other employees
in my work unit.
—
79
In my work unit, people’s differences are respected. — 80
I can be successful in my organization being myself. — 81
I can easily make a request of my organization to meet my accessibility needs. — 82
My organization responds to my accessibility needs in a timely manner. — 83
My organization meets my accessibility needs. — 84
My job inspires me. — 85
The work I do gives me a sense of accomplishment. — 86
I feel a strong personal attachment to my organization. — 87
I identify with the mission of my organization. — 88
It is important to me that my work contribute to the common good. — 89
2022 OPM Federal Employee Viewpoint Survey: Technical Report 54

Appendix B: 2022 Federal Employee
Viewpoint Survey Instrument
Dear Colleague:
The 2022 Office of Personnel Management Federal Employee Viewpoint Survey (OPM FEVS) is
administered to employees across the Federal Government. This valuable survey tool collects feedback
on your experiences with your job, supervisors, leadership, workplaces and more. Ultimately, the
feedback we collect is used to support improvements in your agency and to evaluate governmentwide
policies and programs. Share your work experiences since the last OPM FEVS administration
(November- December 2021) and be a part of changes for improvement.
What’s New This Year?
OPM’s goal for the survey is to be as responsive as possible to changing conditions that could impact
employees and agencies. Since the development of the OPM FEVS in the early 2000s, workplaces have
changed, and new government priorities emerged. The survey has been updated to reflect those new
conditions. For example, response to the pandemic has clearly shown the importance of employee
resilience, innovation, and employee involved decision-making voice to agency success. New content
relevant to these and other key management topics have been added to the 2022 survey.
Addressing government priorities, content aligned with the Executive Order on Diversity, Equity,
Inclusion, and Accessibility was tested on the 2021 survey. The test was successful and much of the DEIA
content appears on the current OPM FEVS and will feature in results reporting.
As we evolve our responses to the pandemic, many employees continue to work from the central
worksite while others are returning after engaging in maximum telework. In recognition, several
questions on the 2022 survey address ongoing responses to the pandemic and return to the worksite.
Continuous improvement and responsiveness are goals of the OPM FEVS and the 2022 survey will again
feature test items to assess, for example, customer experience and autonomy. As in prior years, your
responses to the test questions will help in ongoing efforts to improve the value of the survey to your
and to your leadership toward improving Federal workplaces.
Government and Your Agency Need Your Feedback
While participation in the OPM FEVS is voluntary, the importance of your feedback has increased with
the addition of new content addressing key government challenges and opportunities. To support your
participation, we safeguard your individual responses; they are confidential and can never be used to
identify you. Agency leaderships are only provided with summary reports that combine employees’
responses.
We also make participation easy, and you can complete the survey during your normal work hours. It
only takes about 20-30 minutes to complete – a short time to contribute toward improving your
workplace! Taking the survey can be considered part of your normal duties.
2022 OPM Federal Employee Viewpoint Survey: Technical Report 55

Note: To assist you with interpreting key terms in the survey, definitions of relevant terms are included
on each page of the survey. You can also view a list of all definitions of terms used in the survey by
clicking on the “definitions” link at the bottom of each page.
Your feedback is important! Thank you for sharing.
OPM’s FEVS Team
2022 OPM Federal Employee Viewpoint Survey: Technical Report 56

The survey should take approximately 20-30 minutes. Participation is voluntary, and your responses
are confidential. Please take note of the response scale when responding to each item, as it changes
throughout the survey. When navigating through the survey, please use the buttons and links on the
bottom of the survey pages and not your browser Back and Forward buttons.
Note: To assist you with interpreting key terms in the survey, a “definitions” link is listed at the
bottom of each page of the survey.
My Work Experience
Item Text
Strongly
Agree
Agree
Neither Agree
nor Disagree
Disagree
Strongly
Disagree
1. I am given a real opportunity to improve
my skills in my organization.
2. I feel encouraged to come up with new
and better ways of doing things.
3. My work gives me a feeling of personal
accomplishment.
4. I know what is expected of me on the job.
5. My workload is reasonable.
6. My talents are used well in the workplace.
7. I know how my work relates to the
agency’s goals.
8. I can disclose a suspe
cted violation of any law, rule or regulation without fear of reprisal.
Str
ongly Agree
Agr
ee
Ne
ither Agree nor Disagree
Dis
agree
St
rongly Disagree
Do
Not Know
9. I have enough information to do my job well.
Str
ongly Agree
Agr
ee
Ne
ither Agree nor Disagree
Dis
agree
St
rongly Disagree
2022 OPM Federal Employee Viewpoint Survey: Technical Report 57

10. I receive the training I need to do my job well.
Strongl
y Agree
Agree
Neithe
r Agree nor Disagree
Disagree
Strong
ly Disagree
11. I am held accountable for the quality of work I produce.
Strong
ly Agree
Agree
Neith
er Agree nor Disagree
Disagre
e
Stron
gly Disagree
12. Continually changing work priorities make it hard for me to produce high quality work.
Stro
ngly Agree
Agre
e
Neith
er Agree nor Disagree
Disag
ree
Stro
ngly Disagree
No B
asis to Judge
13. I have a clear idea of how well I am doing my job.
Str
ongly Agree
Agr
ee
Ne
ither Agree nor Disagree
Dis
agree
St
rongly Disagree
2022 OPM Federal Employee Viewpoint Survey: Technical Report 58

My Work Unit
Work unit is defined as “your immediate work unit headed by your immediate supervisor.”
14. The people I work with cooperate to get the job done.
Str
ongly Agree
Agr
ee
Ne
ither Agree nor Disagree
Dis
agree
St
rongly Disagree
15. In my work unit poor performers usually (select all that apply):
Re
main in the work unit and improve their performance over time
Re
main in the work unit and continue to underperform
Lea
ve the work unit – removed or transferred
Lea
ve the work unit – quit
Th
ere are no poor performers in my work unit
Do
Not Know
16. In my work unit, differences in performance are recognized in a meaningful way.
Str
ongly Agree
Agr
ee
Ne
ither Agree nor Disagree
Dis
agree
St
rongly Disagree
Do
Not Know
17. Employees in my work unit share job knowledge.
Str
ongly Agree
Agr
ee
Ne
ither Agree nor Disagree
Dis
agree
St
rongly Disagree
Do
Not Know
2022 OPM Federal Employee Viewpoint Survey: Technical Report 59

18. My work unit has the job-relevant knowledge and skills necessary to accomplish organizational
goals.
Str
ongly Agree
Agr
ee
Ne
ither Agree nor Disagree
Dis
agree
St
rongly Disagree
Do
Not Know
Employees in my work unit…
Item Text
Always
Most of
the time
Sometimes
Rarely
Never
No Basis
to Judge
19. …meet the needs of our
customers.
20. …contribute positively to my
agency’s performance.
21. …produce high-quality work.
22. …adapt to changing priorities.
23. New hires in my work unit (i.e. hired in the past year) have the right skills to do their jobs.
Str
ongly Agree
Agr
ee
Ne
ither Agree nor Disagree
Dis
agree
St
rongly Disagree
Ther
e have been no recent hires in my work unit
24. I can influence decisions in my work unit.
Str
ongly Agree
Agr
ee
Ne
ither Agree nor Disagree
Dis
agree
St
rongly Disagree
25. I know what my work unit’s goals are.
Str
ongly Agree
Agr
ee
Ne
ither Agree nor Disagree
Dis
agree
Str
ongly Disagree
2022 OPM Federal Employee Viewpoint Survey: Technical Report 60
26. My work unit commits resources to develop new ideas (e.g., budget, staff, time, expert support).
Str
ongly Agree
Agr
ee
Ne
ither Agree nor Disagree
Dis
agree
St
rongly Disagree
Do
Not Know
27. My work unit successfully manages disruptions to our work.
Str
ongly Agree
Agr
ee
Ne
ither Agree nor Disagree
Dis
agree
St
rongly Disagree
Do
Not Know
Employees in my work unit…
Item Text
Strongly
Agree
Agree
Neither Agree
nor Disagree
Disagree
Strongly
Disagree
Do Not
Know
28. …consistently look for new ways
to improve how they do their
work.
29. …incorporate new ideas into
their work.
30. …approach change as an
opportunity.
31. …consider customer needs a top
priority.
32. …consistently look for ways to
improve customer service.
33. …support my need to balance my
work and personal
responsibilities.
34. …are typically under too much
pressure to meet work goals.
2022 OPM Federal Employee Viewpoint Survey: Technical Report 61

My Organization
Organization is defined as “your agency, office, or division. Please respond to these questions based
on the level in your organization that is appropriate for the content of the question. Depending on
how your organization is structured, this could either be one or more levels above your own.”
35. Employees are recognized for providing high quality products and services.
Stro
ngly Agree
Agre
e
Neit
her Agree nor Disagree
Disag
ree
Stro
ngly Disagree
Do N
ot Know
36. Employees are protected from health and safety hazards on the job.
Stro
ngly Agree
Agre
e
Neit
her Agree nor Disagree
Disag
ree
Stro
ngly Disagree
Do N
ot Know
37. My organization is successful at accomplishing its mission.
Str
ongly Agree
Agr
ee
Ne
ither Agree nor Disagree
Dis
agree
St
rongly Disagree
Do
Not Know
38. I have a good understanding of my organization’s priorities.
Str
ongly Agree
Agr
ee
Ne
ither Agree nor Disagree
Dis
agree
St
rongly Disagree
2022 OPM Federal Employee Viewpoint Survey: Technical Report 62

39. My organization effectively adapts to changing government priorities.
Str
ongly Agree
Agr
ee
Nei
ther Agree nor Disagree
Dis
agree
St
rongly Disagree
Do
Not Know
40. My organization has prepared me for potential physical security threats.
Str
ongly Agree
Agr
ee
Ne
ither Agree nor Disagree
Dis
agree
St
rongly Disagree
Do
Not Know
41. My organization has prepared me for potential cybersecurity threats.
Str
ongly Agree
Agr
ee
Ne
ither Agree nor Disagree
Dis
agree
St
rongly Disagree
Do
Not Know
42. In my organization, arbitrary action, personal favoritism and/or political coercion are not tolerated.
Str
ongly Agree
Agr
ee
Ne
ither Agree nor Disagree
Dis
agree
St
rongly Disagree
Do
Not Know
43. I recommend my organization as a good place to work.
Str
ongly Agree
Agr
ee
Ne
ither Agree nor Disagree
Dis
agree
St
rongly Disagree
2022 OPM Federal Employee Viewpoint Survey: Technical Report 63

44. I believe the results of this survey will be used to make my agency a better place to work.
Str
ongly Agree
Agr
ee
Ne
ither Agree nor Disagree
Dis
agree
St
rongly Disagree
Do
Not Know
My Supervisor
Supervisor is defined as “first-line supervisors typically responsible for employees’ performance
appraisals and leave approval.”
45. My supervisor is committed to a workforce representative of all segments of society.
Str
ongly Agree
Agr
ee
Ne
ither Agree nor Disagree
Dis
agree
St
rongly Disagree
Do
Not Know
46. Supervisors in my work unit support employee development.
Str
ongly Agree
Agr
ee
Ne
ither Agree nor Disagree
Dis
agree
St
rongly Disagree
Do
Not Know
2022 OPM Federal Employee Viewpoint Survey: Technical Report 64

Item Text
Strongly
Agree
Agree
Neither Agree
nor Disagree
Disagree
Strongly
Disagree
Do Not
Know
47. My supervisor supports my need
to balance work and other life
issues.
48. My supervisor listens to what I
have to say.
49. My supervisor treats me with
respect.
50. I have trust and confidence in my
supervisor.
51. My supervisor holds me
accountable for achieving results.
52. Overall, how good
a job do you feel is being done by your immediate supervisor?
Ve
ry Good
Go
od
Fair
Poo
r
Ve
ry Poor
53. My supervisor provides me with constructive suggestions to improve my job performance.
Str
ongly Agree
Agr
ee
Ne
ither Agree Nor Disagree
Dis
agree
St
rongly Disagree
54. My supervisor provides me with performance feedback throughout the year.
Str
ongly Agree
Agr
ee
Ne
ither Agree Nor Disagree
Dis
agree
St
rongly Disagree
Do
Not Know
2022 OPM Federal Employee Viewpoint Survey: Technical Report 65

Leadership
Senior leader is defined as “the heads of departments/agencies and their immediate leadership team
responsible for directing the policies and priorities of the department/agency. May hold either a
political or career appointment and typically a member of the Senior Executive Service or equivalent.”
Manager is defined as “those in management positions who typically supervise one or more
supervisors.”
Organization is defined as “your agency, office, or division. Please respond to these questions based
on the level in your organization that is appropriate for the content of the question. Depending on
how your organization is structured, this could either be one or more levels above your own.”
Item Text
Strongly
Agree
Agree
Neither Agree
nor Disagree
Disagree
Strongly
Disagree
Do Not
Know
55. In my organization, senior
leaders generate high levels of
motivation and commitment in
the workforce.
56. My organization’s senior leaders
maintain high standards of
honesty and integrity.
57. Managers communicate the
goals of the organization.
58. Managers promote communication
among different work units (for
example, about projects, goals,
needed resources).
59. Overall, how good a job
do you feel is being done by the manager directly above your immediate
supervisor?
Ver
y Good
Goo
d
Fair
Poor
Ver
y Poor
Do N
ot Know
2022 OPM Federal Employee Viewpoint Survey: Technical Report 66

Item Text
Strongly
Agree
Agree
Neither Agree
nor Disagree
Disagree
Strongly
Disagree
Do Not
Know
60. I have a high level of respect for
my organization’s senior leaders.
61. Senior leaders demonstrate
support for Work-Life programs.
62. Management encourages
innovation.
63. Management makes effective
changes to address challenges
facing our organization.
64. Management involves employees
in decisions that affect their work.
My Satisfaction
Organization is defined as “your agency, office, or division. Please respond to these questions based
on the level in your organization that is appropriate for the content of the question. Depending on
how your organization is structured, this could either be one or more levels above your own.”
Item Text
Very
Satisfied
Satisfied
Neither
Satisfied nor
Dissatisfied
Dissatisfied
Very
Dissatisfied
65. How satisfied are you with
your involvement in decisions
that affect your work?
66. How satisfied are you with the
information you receive from
management on what’s going
on in your organization?
67. How satisfied are you with the
recognition you receive for
doing a good job?
68. Considering everything, how
satisfied are you with your
job?
69. Considering everything, how
satisfied are you with your
pay?
70. Considering everything, how
satisfied are you with your
organization?
2022 OPM Federal Employee Viewpoint Survey: Technical Report 67

Diversity, Equity, Inclusion, and Accessibility
Diversity: The practice of including the many communities, identities, races, ethnicities,
backgrounds, abilities, cultures, and beliefs of the American people, including underserved
communities. (Source: Executive Order (EO) 14035)
Equity: The consistent and systematic fair, just, and impartial treatment of all individuals,
including individuals who belong to underserved communities that have been denied such
treatment. (Source: EO 14035)
Inclusion: The recognition, appreciation, and use of the talents and skills of employees of all
backgrounds. (Source: EO 14035)
Accessibility: The design, construction, development, and maintenance of facilities, information
and communication technology, programs, and services so that all people, including people with
disabilities, can fully and independently use them. (Source: EO 14035)
71. My organization’s management practices promote diversity (e.g., outreach, recruitment, promotion
opportunities).
St
rongly Agree
Agr
ee
Ne
ither Agree Nor Disagree
Dis
agree
Str
ongly Disagree
Do
Not Know
72. My supervisor demonstrates a commitment to workforce diversity (e.g., recruitment, promotion
opportunities, development).
Str
ongly Agree
Agr
ee
Ne
ither Agree Nor Disagree
Dis
agree
St
rongly Disagree
Do
Not Know
2022 OPM Federal Employee Viewpoint Survey: Technical Report 68

Item Text
Strongly
Agree
Agree
Neither Agree
nor Disagree
Disagree
Strongly
Disagree
Do Not
Know
73. I have similar access to
advancement opportunities (e.g.,
promotion, career development,
training) as others in my work
unit.
74. My supervisor provides
opportunities fairly to all
employees in my work unit (e.g.,
promotions, work assignments).
75. In my work unit, excellent work is
similarly recognized for all
employees (e.g., awards,
acknowledgements).
Employees in my work unit…
Item Text
Strongly
Agree
Agree
Neither Agree
nor Disagree
Disagree
Strongly
Disagree
No Basis
to Judge
76. …treat me as a valued member of
the team.
77. …make me feel I belong.
78. …care about me as a person.
Item Text
Strongly
Agree
Agree
Neither Agree
nor Disagree
Disagree
Strongly
Disagree
No Basis
to Judge
79. I am comfortable expressing
opinions that are different from
other employees in my work unit.
80. In my work unit, people’s
differences are respected.
81. I can be successful in my
organization being myself.
2022 OPM Federal Employee Viewpoint Survey: Technical Report 69

Item Text
Strongly
Agree
Agree
Neither
Agree nor
Disagree
Disagree
Strongly
Disagree
I do not have
any accessi
bility needs
- No Basis
to Judge
82. I can easily make a request
of my organization to
meet my accessibility
needs.
83. My organization responds
to my accessibility needs
in a timely manner.
84. My organization meets my
accessibility needs.
Employee Experience
Item Text
Strongly
Agree
Agree
Neither Agree
nor Disagree
Disagree
Strongly
Disagree
85. My job inspires me.
86. The work I do gives me a sense of
accomplishment.
87. I feel a strong personal
attachment to my organization.
88. I identify with the mission of my
organization.
89. It is important to me that my
work contribute to the common
good.
Pandemic, Transition to the Worksite, Workplace
Flexibilities
90. What percentage of your work time are you currently required to be physically present at your
agency worksite (including headquarters, bureau, field offices, etc.)?
100% o
f my work time
At l
east 75% but less than 100%
At l
east 50% but less than 75%
At l
east 25% but less than 50%
Les
s than 25%
I am n
ot currently required to be physically present at my agency worksite
2022 OPM Federal Employee Viewpoint Survey: Technical Report 70

The next set of items ask about your telework or remote work arrangements. Please read the
following definitions that clarify the difference between telework and remote work.
Telework: a work flexibility arrangement under which an employee performs the duties and
responsibilities of such employee’s position, and other authorized activities, from an approved
worksite other than the location from which the employee would otherwise work. In practice,
telework is a work arrangement that allows employees to have regularly scheduled days on which
they telework and regularly scheduled days when they work in their agency worksite.
Remote work: an arrangement in which an employee, under a written remote work agreement, is
scheduled to perform their work at an alternative worksite and is not expected to perform work at an
agency worksite on a regular and recurring basis. A remote worker’s official worksite may be within or
outside the local commuting area of an agency worksite.
91. Please select the response that BEST describes your current remote work or teleworking schedule.
I hav
e an approved remote work agreement (I am not expected to perform work at an agency
worksite) [if selected will see item 91A]
I telewo
rk 3 or more days per week
I telewo
rk 1 or 2 days per week
I tel
ework, but only about 1 or 2 days per month
I tel
ework very infrequently, on an unscheduled or short-term basis
I do no
t telework because I have to be physically present on the job (e.g., law enforcement
officers, TSA agent, border patrol agent, security personnel)
I do n
ot telework because of technical issues (e.g., connectivity, inadequate equipment) that
prevent me from teleworking
I do n
ot telework because I did not receive approval to do so, even though I have the kind of job
where I can telework
I do n
ot telework because I choose not to telework
The item below will only be visible if ‘I have an approved remote work agreement’ was selected for item
91 above.
91a. What is your current remote work status?
I hav
e an approved remote work agreement and live outside the local commuting area (more
than 50 miles away)
I hav
e an approved remote work agreement and live within the local commuting area (less than
50 miles away)
92. Did you have an approved remote work agreement before the 2020 COVID-19 pandemic?
Yes
No
2022 OPM Federal Employee Viewpoint Survey: Technical Report 71

93. Based on your work unit’s current telework or remote work options, are you considering leaving
your organization, and if so, why?
No
Yes,
to retire
Yes,
to take another job within my Agency
Yes,
to take another job within the Federal Government
Yes,
to take another job outside the Federal Government
Yes,
other
“Re-entry” is a term used to describe the transition from the work environment that has existed
during the pandemic to the agency’s new work environment.
94. My agency’s re-entry arrangements are fair in accounting for employees’ diverse needs and
situations.
Str
ongly Agree
Agr
ee
Ne
ither Agree nor Disagree
Dis
agree
St
rongly Disagree
No
t Applicable
95. Please select the response that BEST describes how employees in your work unit currently report to
work:
All e
mployees in my work unit are physically present on the worksite
So
me employees are physically present on the worksite and others telework or work remotely
No
employees in my work unit are physically present on the worksite, we all work remotely
Oth
er
2022 OPM Federal Employee Viewpoint Survey: Technical Report 72

Senior leader is defined as “the heads of departments/agencies and their immediate leadership team
responsible for directing the policies and priorities of the department/agency. May hold either a
political or career appointment and typically a member of the Senior Executive Service or equivalent.”
Supervisor is defined as “first-line supervisors typically responsible for employees’ performance
appraisals and leave approval.”
My organization’s senior leaders…
Item Text
Strongly
Agree Agree
Neither Agree
nor Disagree Disagree
Strongly
Disagree
No Basis
to Judge
96. …support policies and
procedures to protect
employee health and safety.
97. …provide effective
communications about what
to expect with the return to
the physical worksite.
My supervisor…
Item Text
Strongly
Agree
Agree
Neither Agree
nor Disagree
Disagree
Strongly
Disagree
No Basis
to Judge
98. …supports my efforts to stay
healthy and safe while
working.
99. …creates an environment
where I can voice my
concerns about staying
healthy and safe.
2022 OPM Federal Employee Viewpoint Survey: Technical Report 73

Paid Parental Leave
The next few items ask about the Paid Parental Leave benefit available to Federal employees, and
your responses will be extremely useful in assessing the use of this benefit. The benefit provides up to
12 weeks of Paid Parental Leave to covered Federal employees in connection with the birth or
placement (for adoption or foster care) of a child occurring on or after October 1, 2020. Employees
may only use Paid Parental Leave upon invoking FMLA (see CPM2020-10
).
Note: Depending on your r
esponse to the first item below, you may be asked additional follow up
questions.
Have you used the Paid Parental Leave benefit at any point from October 1, 2020 to today?
Yes
No
, did not have a qualifying event
No
, I was not aware of the leave although I had a qualifying event
No
, I chose not to use the leave although I had a qualifying event
No
, I had a qualifying event (e.g., birth of a child), but was not eligible to use the leave
No
, I had a qualifying event, but I used all my FMLA leave previously
The item below will only be visible if ‘yes’ was selected for the item ‘Have you used the Paid Parental
Leave benefit at any point from October 1, 2020 to today?’.
For what purpose did you use Paid Parental Leave? Choose all that apply.
Birth
of a child
Plac
ement of a child for adoption
Plac
ement of a child for foster care
The item below will only be visible if ‘yes’ was selected for the item ‘Have you used the Paid Parental
Leave benefit at any point from October 1, 2020 to today?’.
How many weeks of Paid Parental Leave did you use during the 12-month period following a qualifying
event (use can be either continuous or intermittent)?
Note: If you are still using your leave when taking this survey, respond with how many weeks of Paid
Parental Leave you expect to take in total.
Fu
ll 12 weeks [if selected, will skip the next item]
At l
east 8 weeks but less than 12 weeks
At l
east 6 weeks but less than 8 weeks
At l
east 3 weeks but less than 6 weeks
Les
s than 3 weeks
2022 OPM Federal Employee Viewpoint Survey: Technical Report 74

What are the primary reasons you used (or expect to use) less than 12 weeks of Paid Parental Leave?
Choose all that apply.
Di
d not need to use the full 12 weeks of leave
Pre
vious use of FMLA leave reduced the amount of Paid Parental Leave available to me
Me
eting FMLA eligibility requirements limited the amount of FMLA leave available to use within
my FMLA 12-month period
Did
not feel I could be away from job responsibilities for a full 12 weeks
Co
ncerned about the impact using the leave would have on my career advancement
Did
not feel that my coworkers supported my use of all 12 weeks of the leave
Di
d not feel that my supervisor supported my use of all 12 weeks of the leave
Oth
er reason
Employment Demographics
The Federal Government is committed to promoting a workplace characterized by diversity and
inclusion. Given that policy, we are soliciting responses to the following items. Your response is
voluntary, confidential, and will be used to enhance the federal government’s understanding of the
diversity of its workforce.
Where do you work?
He
adquarters
Fie
ld
Fu
ll-time telework (e.g., home office, telecenter)
What is your supervisory status?
Se
nior Leader: You are the head of a department/agency or a member of the immediate
leadership team responsible for directing the policies and priorities of the department/agency.
May hold either a political or career appointment, and typically is a member of the Senior
Executive Service or equivalent.
Man
ager: You are in a management position and supervise one or more supervisors.
Su
pervisor: You are a first-line supervisor who is responsible for employees’ performance
appraisals and leave approval.
Te
am Leader: You are not an official supervisor; you provide employees with day-to-day guidance
in work projects, but do not have supervisory responsibilities or conduct performance appraisals.
No
n-Supervisor: You do not supervise other employees.
2022 OPM Federal Employee Viewpoint Survey: Technical Report 75

What is your pay category/grade?
Fed
eral Wage System (for example, WB, WD, WG, WL, WM, WS, WY)
GS
1-6
GS
7-12
GS
13-15
Sen
ior Executive Service
Se
nior Level (SL) or Scientific or Professional (ST)
Oth
er
What is your US military service status?
No
Prior Military Service
Cu
rrently in National Guard or Reserves
Reti
red
Se
parated or Discharged
Are you:
Th
e spouse of a current active duty service member of the U.S. Armed Forces
The s
pouse of a service member who retired or separated from active duty in the U.S. Armed
Forces with a disability rating of 100 percent
Th
e widow(er) of a service member killed while on active duty in the U.S. Armed Forces
No
ne of the categories listed [If selected, will skip the next item]
Have you been hired under the Military Spouse Non-Competitive Hiring Authority?
Yes
No
H
ow long have you been with the Federal Government (excluding military service)?
Le
ss than 1 year
1 t
o 3 years
4 t
o 5 years
6 t
o 10 years
11 t
o 14 years
15 t
o 20 years
Mo
re than 20 years
2022 OPM Federal Employee Viewpoint Survey: Technical Report 76

How long have you been with your current agency (for example, Department of Justice, Environmental
Protection Agency)?
Le
ss than 1 year
1 to
3 years
4 t
o 5 years
6 t
o 10 years
11 t
o 14 years
15 t
o 20 years
Mo
re than 20 years
Are you considering leaving your organization within the next year, and if so, why?
No
Yes,
to retire
Yes,
to take another job within the Federal Government
Yes,
to take another job outside the Federal Government
Yes,
other
I am planning to retire:
Le
ss than 1 year
1 ye
ar
2 y
ears
3 y
ears
4 y
ears
5 y
ears
Mo
re than 5 years
Personal Demographics
The Federal Government is committed to promoting a diverse and inclusive workplace. Response to
items in this section is entirely voluntary, confidential, and will be used only to enhance the federal
government’s understanding of the diversity of its workforce.
Are you of Hispanic, Latino, or Spanish origin?
Yes
No
2022 OPM Federal Employee Viewpoint Survey: Technical Report 77
Please select the racial category or categories with which you most closely identify. (Mark all that apply)
Ame
rican Indian or Alaska Native
Asian
Black
or African American
Nativ
e Hawaiian or Other Pacific Islander
Whi
te
What is your age group?
25 a
nd under
26-29 yea
rs old
30-39 yea
rs old
40-49 yea
rs old
50-59 yea
rs old
60 yea
rs or older
What is the highest degree or level of education you have completed?
Le
ss than High School
Hig
h School Diploma/GED or equivalent
Trad
e or Technical Certificate
So
me College (no degree)
As
sociate’s Degree (e.g., AA, AS)
Bach
elor’s Degree (e.g., BA, BS)
Ma
ster’s Degree (e.g., MA, MS, MBA)
Do
ctoral/Professional Degree (e.g., Ph.D., MD, JD)
Are you an individual with a disability?
Yes
No
A
re you:
Male
Fe
male
Are you transgender?
Yes
No
2022 OPM Federal Employee Viewpoint Survey: Technical Report 78

Which one of the following do you consider yourself to be?
St
raight, that is not gay or lesbian
Gay o
r Lesbian
Bise
xual
I u
se a different term
2022 OPM Federal Employee Viewpoint Survey: Technical Report 79

Appendix C: Test Items
Test Items – Introduction
Continuous improvement and responsiveness are goals of the OPM FEVS, and this next section of the
survey includes new questions covering several topic areas of governmentwide interest. By
participating in these test items, you will help us improve the survey in the future.
Please answer the item below and let us know if you agree to volunteer a few more minutes of your
time to respond to some additional survey items. If you select “yes,” you will have the opportunity to
view and participate in the test items. If you select “no,” you will be taken to the end of the survey
where you can submit your responses.
Are you willing to participate in the Test Items section?
Yes [
if selected, will proceed to see test items]
No
[if selected, will branch to end page and skip all test items]
Item Text
Strongly
Agree
Agree
Neither Agree
nor Disagree
Disagree
Strongly
Disagree
I can make decisions about my work
without getting permission first.
I have the autonomy to decide how I
do my job.
I have some control over what I am
supposed to get done at work.
I can decide how to schedule my
work.
I can choose where I work.
2022 OPM Federal Employee Viewpoint Survey: Technical Report 80

Item Text
Strongly
Agree
Agree
Neither Agree
nor Disagree
Disagree
Strongly
Disagree
Do Not
Know
In my organization, even minor
decisions must be referred to
someone higher up for final approval.
The way policies and rules are
applied in my work unit make it hard
to meet work goals (i.e. red tape).
Information is openly shared in my
organization.
Burdensome policies and rules
interfere with my work unit’s
performance (i.e., red tape).
The approval process in my
organization allows timely delivery of
my work.
The way policies and rules are
applied facilitate my work unit’s
performance.
The way things are done in my work
unit does not change very much.
Management in my organization
keeps to established ways of doing
things.
Changes in the way things are done
in my organization happen very
slowly.
Management in my organization is
resistant to change.
Employees in my work unit prioritize
customer needs when solving
problems.
Employees in my work unit have
what we need to consistently
incorporate feedback from our
customers.
2022 OPM Federal Employee Viewpoint Survey: Technical Report 81

Appendix D: Email Communications
Sample Invitation Email
Subject: 2022 OPM Federal Employee Viewpoint Survey
Today the 2022 Office of Personnel Management Federal Employee Viewpoint Survey (OPM FEVS) kicks
off, providing you with a safe and confidential way to voice your opinions and experiences to leadership.
This year the OPM FEVS features content familiar from the past, as well as new content focusing on
topics of interest across government, such as Diversity, Equity, Inclusion and Accessibility, and questions
asking about innovation, customer responsiveness, resilience and work quality in your workplace.
Please take the time to provide leadership with insights into how you have experienced what is going on
in your organization, especially critical as many employees are returning to the physical workplace from
maximum telework. This information is helpful for agency leadership to get a better understanding of
where they can make improvements.
Participation is voluntary and you may use official time. The survey takes approximately 20 minutes to
complete.
Here is your confidential link: %[Click here to access your survey]URL%
Do not forward your email. Otherwise, someone else will be your voice!
Note: If the link above does not work or has been disabled, please COPY the following link, beginning
wi
th “https:”, and paste it into your Web browser (try different web browsers if necessary). When
copying the link, please make sure you copy the entire link from beginning to end: %URL%
Ne
ed help?
We are committed to providing you with a voice to your leadership. If the survey format interferes with
your ability to respond due to a disability, such as assistive technology incompatibility, or if you are
experiencing other difficulties accessing your survey or have questions about the OPM FEVS, please
contact our Survey Support Center by replying to this message.
The OPM FEVS team thanks you!
2022 OPM Federal Employee Viewpoint Survey: Technical Report 82

First Reminder Email
Subject: 2022 OPM Federal Employee Viewpoint Survey
The 2022 Office of Personnel Management Federal Employee Viewpoint Survey (OPM FEVS) is a
powerful tool for you to share your opinions and perceptions with your leadership. The 2022 survey
features familiar items as well as improved and expanded content. We ask that you please take the time
to participate and help agency leadership understand where they can drive improvements. The survey is
voluntary, and you may use official time to complete it.
Here is your confidential link: %[Click here to access your survey]URL%
Please do not forward your email. Otherwise, someone else will be your voice!
Note: If the link above does not work or ha
s been disabled, please COPY the following link, beginning
with “https:”, and paste it into your Web browser (try different web browsers if necessary). When
copying the link, please make sure you copy the entire link from beginning to end: %URL%
Ne
ed help?
We are committed to providing you with a voice. If the survey format interferes with your ability to
respond due to a disability, such as assistive technology incompatibility, or if you are experiencing other
difficulties accessing your survey or have questions about the OPM FEVS, please contact our Survey
Support Center by replying to this message.
The OPM FEVS team thanks you!
%[Click here to unsubscribe from future OPM FEVS reminders]UNSUBSCRIBE%
2022 OPM Federal Employee Viewpoint Survey: Technical Report 83

Example of Other Reminder Emails
Subject: 2022 OPM Federal Employee Viewpoint Survey
The 2022 Office of Personnel Management Federal Employee Viewpoint Survey (OPM FEVS) is your
opportunity to share your opinion about many important aspects of your organization and work unit.
This year the OPM FEVS features new content focusing on topics of interest across government, such as
Diversity, Equity, Inclusion and Accessibility, and questions asking about innovation, customer
responsiveness, resilience, and work quality.
The survey is voluntary, and you may use official time to complete it. The survey takes approximately 20
minutes to complete.
Here is your confidential link: %[Click here to access your survey]URL%
Please do not forward your email. Otherwise, someone else will be your voice!
Note: If the link above does not work or has been disabled, please COPY the following link, beginning
wi
th “https:”, and paste it into your Web browser (try different web browsers if necessary). When
copying the link, please make sure you copy the entire link from beginning to end: %URL%
Ne
ed help?
We are committed to providing you with a voice. If the survey format interferes with your ability to
respond due to a disability, such as assistive technology incompatibility, or if you are experiencing other
difficulties accessing your survey or have questions about the OPM FEVS, please contact our Survey
Support Center by replying to this message.
The OPM FEVS team thanks you!
%[Click here to unsubscribe from future OPM FEVS reminders]UNSUBSCRIBE%
2022 OPM Federal Employee Viewpoint Survey: Technical Report 84

Subject: 2022 OPM Federal Employee Viewpoint Survey
Your opportunity to participate in the 2022 Office of Personnel Management Federal Employee
Viewpoint Survey (OPM FEVS) is running out. The survey will close at the end of this week.
Take this opportunity to share your feedback. When the Federal workforce speaks with one voice,
leadership listens. Add your voice TODAY!
Here is your confidential link: %[Click here to access your survey]URL%
Please do not forward your email. Otherwise, someone else will be your voice!
Note: If the link above does not work or has been disabled, please COPY the following link, beginning
wi
th “https:”, and paste it into your Web browser (try different web browsers if necessary). When
copying the link, please make sure you copy the entire link from beginning to end: %URL%
Ne
ed help?
We are committed to providing you with a voice. If the survey format interferes with your ability to
respond due to a disability, such as assistive technology incompatibility, or if you are experiencing other
difficulties accessing your survey or have questions about the OPM FEVS, please contact our Survey
Support Center by replying to this message.
The OPM FEVS team thanks you!
2022 OPM Federal Employee Viewpoint Survey: Technical Report 85
Appendix E: AAPOR Response Rate
The following presents the calculation of the OPM FEVS response rate using the AAPOR Response Rate 3
(RR3) formula.
Table E1. Case Assignment Allocation to Response Rate Groups, by the AAPOR RR3 Method
Response Rate (RR) Group
AAPOR RR3
Method Allocation
AAPOR RR3
Method Counts
Eligible Respondents (ER) CO 557,778
Eligible Non-respondents (ENR) UA, RF, IN 20,345
Unknown Eligibility (UNK) UD, NR, NE, NS 1,095,448
Ineligible (IE) IE 15,687
Total 1,689,258
AAPOR Response Rate 3 Formula:
Number of eligible employees returning completed surveys / (Number of known eligible employees +
estimated number of eligible employees among cases of unknown eligibility):
RR3
AAPOR
= ER / (ER + ENR + UNK
elig
) * 100,
where UNK
elig
= the estimated number of eligible cases among cases of unknown eligibility. It
was calculated as follows:
P
elig
= (ER + ENR) / (ER + ENR + IE) = proportion of eligible cases among cases of known
eligibility
P
elig
= (557,778 +20,345) / (557,778 + 20,345 + 15,687)
P
elig
= 0.973582459
UNK
elig
= P
elig
* UNK = 0.973582459* 1,095,448 = 1,066,508
Thus,
RR3
AAPOR
= 557,778 / (557,778 + 20,345+ 1,066,508) * 100
RR3
AAPOR
= 557,778 / 1,644,631 * 100
RR3
AAPOR
= 33.9 percent
2022 OPM Federal Employee Viewpoint Survey: Technical Report 86

Appendix F: Weighting of the Survey Data
Base Weights
The base weight for a sampled employee is equal to the reciprocal of an individual’s selection
probability. The sample frame for each agency was a list of all employees in the agency who were
eligible for the survey. Within each major agency frame, employees were grouped (stratified) by the
lowest desired work unit and by executive status (see Sample Design section of main report). The total
number of resulting subgroups (strata) created by the stratification was 860, with H=860 representing
the total number of subgroups and h indexing a particular subgroup. Thus, there were H nonoverlapping
groups consisting of N
h
employees in each subgroup so that
∑
=
=
H
h
h
NN
`1
where N is the total frame count—th
at is, the number of employees listed in the agency sample frame.
Within each subgroup a random sample was selected without replacement. The probability of selection
varied by subgroup to ensure adequate representation of subgroup members in the sample. Given this
design, the base weight for the i
th
sample employee in subgroup h was calculated as:
h
h
hi
n
N
w =
where n
h
is the sample size for the h
th
subgroup and N
h
is the frame count for the h
th
subgroup.
For each employee classified in subgroup h, the base weight is the ratio of the total number of
employees in the subgroup to the subgroup sample size (equals the inverse of the probability of
selection). The base weight is attached to each sample unit (employee) in the data file. Note that n
h
is
the number of employees initially sampled in subgroup h—all sample members, not just survey
responders, receive a base weight.
2022 OPM Federal Employee Viewpoint Survey: Technical Report 87

Survey Nonresponse Adjustment
Some sample members did not respond to the survey, usually because they chose not to participate,
they considered themselves ineligible, or their surveys were undeliverable. Adjustments to the base
weights reduce the bias in survey estimates that can occur when the respondent population and the
survey population no longer match on important characteristics. In other words, the adjustments
generally increase the base weights of respondents to account for non-respondents.
Nonresponse (NR) adjustments were calculated separately for individual agencies or sets of
subagencies. Prior to 2015, NR adjustments were calculated separately for each agency. Since 2015 –
2021, nonresponse adjustments have been calculated separately for subagencies that have 2,500 or
more employees and for an agency’s set of subagencies that each has fewer than 2,500 employees.
Within each agency, weighting cells were constructed to group respondents and non-respondents with
similar characteristics into the same cells for adjustment. The variables used to form the weighting cells
included a sub-agency identifier, supervisory status, sex, minority status, age group, tenure as a Federal
employee, full- or part-time status, and location (headquarters vs. field office). Large subgroups were
divided into smaller weighting cells to increase variation across the cells. A categorical search algorithm
was used to divide the data into smaller cells, with the goal of having response rates differ as much as
possible across the cells. Cells with similar response rates were combined when necessary to achieve a
minimum cell size of 30 respondents.
For the 2006 survey administration, the algorithm called CHAID (Chi-squared Automatic Interaction
Detector; Kass, 1980) was used to divide the data into smaller cells. For the 2008, 2010, 2011- 2016
survey administrations, the chi algorithm in the Search software developed and maintained by the
University of Michigan was used. The chi algorithm is an ancestor of CHAID. For the 2017 – 2021 survey
administration, the CHAID option of SAS’s PROC HPSPLIT procedure was used to divide the data into
smaller cells.
After the weighting cells were formed, statisticians calculated two nonresponse adjustment factors. The
following formula was used to compute the first nonresponse adjustment factor for each weighting cell:
∑ ∑∑
∑ ∑∑∑
∈ ∈∈
∈ ∈∈∈
++
+++
=
c cc
c ccc
ERi Ii
i
ENRi
ii
ERi Ui
i
Ii
i
ENRi
ii
nr
c
www
wwww
f
,1
2022 OPM Federal Employee Viewpoint Survey: Technical Report 88

where
∑
∈
c
ERi
i
w
is the sum of base weights for eligible respondents in weighting cell c,
∑
∈
c
ENRi
i
w
is the sum of
base weights for eligible non-respondents in
weighting cell c,
∑
∈
c
Ii
i
w
is the sum of base weights for
known ineligibles in weighting cell c, and
∑
∈
c
Ui
i
w
is the sum of base weights for non-respondents of
unknown eligibility in weighting cell c. The first adjustment factor was used to distribute the base
weights of non-respondents of unknown eligibility to units of known eligibility. The statisticians refer to
this type of weight adjustment as a Type 1A weight adjustment (see Appendix F). This was achieved by
multiplying the base weights of eligible respondents, known ineligibles, and non-respondents known to
be eligible by the first adjustment factor and setting the final weight of the non-respondents of
unknown eligibility to zero.
The following formula was used to compute the second nonresponse adjustment factor for each
weighting
cell:
∑
∑ ∑
∈
∈ ∈
′
′
+
′
=
c
c c
ERi
i
ERi ENRi
ii
nr2
c
w
ww
f
,
where
i
w
′
is the adjusted weight resulting from multiplying the base weight for unit i by the first
adjustment factor. The second adjustment factor was used to distribute the adjusted weights of non-
respondents of known eligibility to the eligible respondents. The statisticians refer to this type of
adjustment as a Type 1B adjustment. (See Appendix F) The final weights were calculated by multiplying
the base weights of the eligible respondents by both adjustment factors and by setting the final weight
of the non-respondents of known eligibility to zero. Thus, the nonresponse adjusted weights were
=
1,
×
for known ineligibles and
=
1,
2,
×
for eligible respondents.
Raking
The precision of survey estimates is improved if known information about the total population is used
during the weighting process. For the final stage of weighting, statisticians used a method called raking
that incorporated available information on the demographic characteristics of the 2021 OPM FEVS
sample population. For this third adjustment step, the sample file was subset to include only eligible
respondents and known ineligibles. Then, the adjusted base weights were further adjusted so they sum
2022 OPM Federal Employee Viewpoint Survey: Technical Report 89

to control totals computed from the sampling-frame variables. The known ineligibles are included in
raking because the control totals computed from the sampling frame variables also include ineligibles.
At the conclusion of raking, however, only the final weights of the eligible respondents are used with the
collected survey data to compute weighted estimates.
The raking procedure was carried out in a sequence of alternating adjustments. Weighted counts for
eligible respondents plus known ineligibles were arrayed into two dimensions. The first dimension was
formed by the crossing of agency, sex, and minority status. The second dimension was formed by
truncating the stratum identifier to four characters, and in some cases further collapsing the resulting
stratum-based cells. The actual population count was known for each cell in those two dimensions.
Weighted counts of eligible respondents plus known ineligibles were produced for the first dimension,
and then the weights were adjusted to reproduce the population counts. Those adjusted weights were
then used to produce counts for the second dimension. The weighted counts of eligible respondents
plus known ineligibles were compared with population counts for the second dimension, and the
weights were adjusted again to reproduce population counts. This process of alternately adjusting for
one, then the other, dimension was repeated until the survey distributions for the two dimensions
equaled the population control counts for both dimensions, within a specified level of precision. That is,
the sum of the weights for each raking dimension was acceptably close to the corresponding population
total.
The final raked weight for the i
th
respondent was computed as:
g
nr
i
R
i
R
i
siwfw ∈= ,
~
~
where
̃
is the product of the iterative adjustments (in each dimension group, s
g
) applied to the i
th
sample employee. The final weight equals the number of people in the survey population the i
th
respondent represents. The weights for the eligible respondents were added to the data file. When the
weights are used in data analysis, they improve the precision and accuracy of survey estimates.
2022 OPM Federal Employee Viewpoint Survey: Technical Report 90

Full sample versus Replicate Weights
For the 2004, 2006, and 2008 FHCS, full-sample weights were used to calculate standard errors and to
perform statistical tests when the Taylor linearization method is used. For the 2010-2021
administrations, full-sample weights and Taylor linearization were still used for all analyses, except
replicate weights were used for statistical analysis conducted on Analysis on Demand. Replicate weights
were used because these trend analyses were also available on demand in WesDaX, Westat’s online
query and analysis system.
WesDaX uses the jackknife method to determine standard errors and to perform statistical tests, which
requires the calculation of sets of replicate weights. The replicate weights were calculated by the JKn
method, which randomly assigns cases to groups, referred to as variance units, within sets of sampling
strata, referred to as variance strata. The sampling strata for a particular agency were assigned to
variance strata based on stratum response rates. Each set of replicate weights corresponds to deleting
one variance unit and then recalculating the weights based on the remaining variance units. The
nonresponse and calibration adjustments for the 2010-2021 OPM FEVS were replicated in each set of
replicate weights. Consequently, standard errors calculated by using the jackknife method correctly
accounts for the effects of weight adjustment on the variance of survey estimates.
Example:
The remainder of this appendix presents a numerical example of the three-step weighting procedure.
For this example, we assume that all the units in the sampling frame are eligible cases. Consequently,
this example does not include any adjustments for cases of unknown eligibility.
Table F1 shows how the population is partitioned into five strata, and strata 4 and 5 are combined. The
rightmost column of Table F1 contains the base weights by stratum. For example, the base weight for
stratum 1 is 13,470 / 950=14.179.
2022 OPM Federal Employee Viewpoint Survey: Technical Report 91
Table F1. Population counts, sample sizes, selection probabilities, and base weights
Stratum
Population
count
Sample
size
Selection
probability
Base
weight
1 13,470 13,470 1 1
2 12,300 12,300 1 1
3 22,980 22,980 1 1
4
450
450
4/5
1,250
1
1
5
800
800
Total
50,000
50,000
13,470/13,470
13,470/13,470
Table F2 contains the number of respondents by strata and th
e associated response rates. The rightmost
column of Table F2 contains the sum of the base weights for all the respondents in each stratum. For
example, for stratum 1 the sum of the base weights is 5,671 × 1 = 5,671. However, this is not close
to the stratum population size of 13,470 f
or stratum 1 shown in Table E1. If the response rate were 100
percent in stratum 1, then the sum of the base weights for all respondents in a stratum would equal the
stratum’s population size. Because the response rate is not 100%, adjustments to the weights to
compensate for nonresponse will be calculated.
Table F2. Sample, Respondents, Response Rates, and Base Weighted Totals
Stratum
Sample
size
Number of
respondents
Response
rate
Base weight total
for respondents
1
13,470
5,671
0.421
5,671
2
12,300
4,526
0.368
4,526
3
22,980
9,192
0.400
9,192
4/5
1,250
540
0.432
540
Total 50,000 19,929 0.405 19,929
5,671*1
2022 OPM Federal Employee Viewpoint Survey: Technical Report 92

One of the sampling-frame variables contains location information—that is, headquarters or field—
about each case. Table F3 shows how respondents can be assigned to nonresponse-adjustment cells on
the basis of location and then associated response rates and nonresponse adjustment factors calculated.
For example, for the Field location, the nonresponse adjustment factor would be the reciprocal of the
response rate of 0.310 for a 3.226 nonresponse adjustment factor. By using the reciprocal of the
response rate, the nonresponse adjustment factor will be greater than or equal to one, so multiplying
the base weight for a respondent by a nonresponse adjustment factor increases it so it represents both
the respondent and associated non-respondents. The base weights are then multiplied by the
adjustment factors, yielding the nonresponse-adjusted weights shown in Table F4.
Table F3. Response rates by location
Location
Number of
respondents
Response
rate
Nonresponse
adjustment factor
Headquarters
12,320
0.500
2.000
Field
7,609
0.310
3.226
Total 19,929 0.405
1/0.310
Table F4. Nonresponse adjusted weights
Stratum
Base
weight
Adjustment factor
Adjustment weight
HQ
Field
HQ
Field
1
1
2.000
3.226
2.000
3.226
2
1
2.000
3.226
2.000
3.226
3 1 2.000 3.226 2.000 3.226
4/5
1
2.000
3.226
2.000
3.226
In Table F5, the second column from the right contains the sum of the nonresponse-adjusted weights for
all the respondents in the eight cells defined by stratum and location. The rightmost column of Table F5
contains the cell’s population size. The corresponding entries for the stratum totals in the two columns
are not equal because of the variability in response rates across the four strata within each nonresponse
adjustment cell, defined by location. If there had been no cross-stratum variability of responses rates
within a nonresponse adjustment cell, the corresponding stratum totals in the two columns would have
been equal to each other.
2022 OPM Federal Employee Viewpoint Survey: Technical Report 93

Table F5. Unweighted and weighted counts for respondents and population counts by
stratum and location
Stratum
Location
Unweighted
count for
respondents
Weighted
count for
respondents
Population
count
1
HQ
4,324
8,648
7,880
1
Field
1,347
4,345
5,590
Total for 1
5,671
12,993
13,470
2
HQ
1,681
3,362
3,752
2
Field
2,845
9,178
8,548
Total for 2
4,526
12,540
12,300
3
HQ
5,249
10,498
10,915
3
Field
3,943
12,720
12,065
Total for 3
9,192
23,218
22,980
4/5
HQ
394
788
800
4/5
Field
146
471
450
Total for 4/5
540
1,259
1,250
Grand Totals 19,929
394*2
50,011 50,000
Table F6 illustrates two iterations of raking of the weights using stratum and sex as raking dimensions.
The objective of such raki
ng is to adjust the weights so that the sum of the weights for all the
respondents in each stratum equals the stratum’s population control total and also the sum of the
weights for all the respondents of each sex equals the sex’s population control total.
2022 OPM Federal Employee Viewpoint Survey: Technical Report 94

Table F6. Raking of weights using stratum and sex as ranking dimensions
Iteration 1
Stratum
Weighted
count
Population
count
Raking
factor
1 12,993 13,470 1.037
13,470/12,993
2 12,540 12,300 0.981
3 23,218 22,980 0.990
4/5
1,259 1,250 0.993
Multiply weights by raking
factors to get new weights and
produce distribution by sex.
Total 50,011 50,000
Sex
Weighted
count
Population
count
Raking
factor
Male 21,900 23,500 1.073
Calculate new weights using
raking factors and produce
distribution by group.
Female 27,000 26,500 0.981
Total 48,900 50,000
Iteration 2
Stratum
Weighted
count
Population
count
Raking
factor
1 13,416 13,470 0.996
2 12,325 12,300 1.002
3 23,003 22,980 1.001
4/5 1,253 1,250 1.002
Total 49,996 50,000
Sex
Weighted
count
Population
count
Raking
factor
Male 23,400 23,500 1.004
Female 26,400 26,500 1.004
Total 49,800 50,000
Iterations continue until weighted counts are close or equal to population counts.
2022 OPM Federal Employee Viewpoint Survey: Technical Report 95

Appendix G: Illustration of Weight
Adjustment Operations
Table G1. Values of status variables
Status
Description
0
Case where the initial weight should not be changed
1
Eligible respondents
2
Eligible non-respondents
3
Ineligible
4
Unknown eligibility status
Table G2. Sums of weights used to define Type 1A and Type 1B Nonresponse Adjustments
Sums of weights
Status
S
1
=
∑
wgt
status=1
Eligible Respondents
S
2
=
∑
wgt
status=2
Eligible Non-respondents
S
3
=
∑
wgt
status=3
Ineligible
S
4
=
∑
wgt
status=4
Unknown (non-respondents)
2022 OPM Federal Employee Viewpoint Survey: Technical Report 96

Figure G1. Type 1A Nonresponse Adjustment
Unknown Eligibility
S1 =
Eligible
Respondents
S2 =
Eligible Non-
respondents
S3 =
Ineligibles
Figure G2. Type 1B Nonresponse Adjustment
S1 =
Eligible
Respondents
S2 =
Eligible Non-
respondents
S3 =
Ineligibles
2022 OPM Federal Employee Viewpoint Survey: Technical Report 97