
FINAL REPORT

Sheep and Goat Dairy Market Conditions and Consumer Research 1
Abstract
This report was prepared by Atlantic Corporation for the Northeast Dairy Business Innovation
Center (NE-DBIC), hosted by the Vermont Agency of Agriculture, Food & Markets (VAAFM), under
Contract #40639. The goal of this project was to conduct market, consumer, and stakeholder
research on goat and sheep dairy products to determine regional consumer demographics, assess
consumer preferences, define optimal distribution channels, and identify marketing strategies and
innovations to improve and expand opportunities for Vermont goat and sheep farms.
Contributors
Ray Bernier, Project Director, Atlantic Corporation
Randy Labbe, Co-Project Director, Atlantic Corporation
Mathew George, Data Analytics Manager, Atlantic Corporation
About Atlantic
Atlantic Corporation is a leading agricultural business and economic research and development firm,
conducting important market research for local food, agriculture, and aquaculture development, often
spearheading large-scale public-private research collaborations and projects. We have completed
major market assessment projects for the USDA through their SBIR, AFRI, and LFPP grant
programs; NOAA; and many state governments, non-profits, and commercial enterprises. Our work
has been widely published in white papers, reports, agricultural economics journals, and presented
at regional and national conferences.
For more information about this report, please contact: Atlantic Corporation, 44 Main St. Suite 205,
Waterville, Maine, 04901 | [email protected] | www.atlanticcorporation.com
Citation
Atlantic Corporation. Sheep and Goat Dairy Market Conditions and Consumer Research. Prepared
for the New England Dairy Business Innovation Center. June 2021.

Sheep and Goat Dairy Market Conditions and Consumer Research 2
Contents
Introduction .............................................................................................................................................................. 4
Executive Summary ................................................................................................................................................ 5
Consumer preferences ........................................................................................................................................ 5
B2B Survey of Industry Stakeholders .................................................................................................................. 6
Analysis of Market Conditions ............................................................................................................................. 6
1. Consumer Preference Survey Results ................................................................................................................ 8
Respondent Characteristics ................................................................................................................................. 8
Consumption and Spending ................................................................................................................................ 9
Consumer Preferences ........................................................................................................................................ 9
Willingness to Pay ............................................................................................................................................. 10
Packaging Preferences ...................................................................................................................................... 12
Other Factors Affecting Purchasing Decisions .................................................................................................. 13
2. Demographic Subgroup Analysis ...................................................................................................................... 14
Spending ........................................................................................................................................................... 14
Preferences ....................................................................................................................................................... 15
3. Survey Insights and Recommendations ............................................................................................................ 16
4. Business to Business Survey ............................................................................................................................ 16
Respondent Characteristics ............................................................................................................................... 17
Price Points ....................................................................................................................................................... 17
Distribution Channels ......................................................................................................................................... 18
Challenges in Distribution .................................................................................................................................. 19
Strategies to Improve Distribution ...................................................................................................................... 19
Innovative Approaches ...................................................................................................................................... 19
Comments for the NE-DBIC .............................................................................................................................. 20
B2B Insights and Recommendations ................................................................................................................. 20
5. Analysis of Global Market Conditions and Context ............................................................................................ 21
Industry Trends .................................................................................................................................................. 21
International Sheep and Goat Dairy Production and Consumption ................................................................... 23
Global Sheep and Goat Dairy Production ...................................................................................................... 23
Global Goat Milk Production .......................................................................................................................... 23
Global Sheep Milk Production ........................................................................................................................ 24
U.S. Sheep and Goat Dairy Production ......................................................................................................... 24
Global Consumption ...................................................................................................................................... 25

Sheep and Goat Dairy Market Conditions and Consumer Research 3
U.S. Consumption .......................................................................................................................................... 25
Key Market Players ........................................................................................................................................... 26
Goat Milk Industry .......................................................................................................................................... 26
Sheep Milk Industry ....................................................................................................................................... 26
Industry Product Segments ............................................................................................................................... 27
Trade Flows and Anticipated Growth ................................................................................................................. 27
Goat Milk ........................................................................................................................................................ 27
Sheep Milk ..................................................................................................................................................... 28
Current Market Conditions ................................................................................................................................. 29
Global market conditions ............................................................................................................................... 29
U.S. Current Market Conditions ......................................................................................................................... 30
Global Trade and Service Gap Analysis ............................................................................................................ 31
U.S. Market Challenges ..................................................................................................................................... 32
Opportunities for Growth .................................................................................................................................... 33
6. Data Dashboard ................................................................................................................................................ 36
Conclusion ............................................................................................................................................................. 38
References Cited for Secondary Market Research ............................................................................................... 40
Appendix A. Survey Tool ....................................................................................................................................... 45
Appendix B. Consumer Preference Survey Methodology ..................................................................................... 63
Appendix C. Consumer Survey Tables ................................................................................................................. 64
Appendix D. B2B Methodology .............................................................................................................................. 68
Appendix E. List of B2B Survey Respondents ....................................................................................................... 69
Appendix F. B2B Survey Instrument ..................................................................................................................... 71
Appendix G. B2B Survey Tables ........................................................................................................................... 73

Sheep and Goat Dairy Market Conditions and Consumer Research 4
Introduction
Atlantic Corporation (Atlantic) completed a comprehensive market research report as well as an
interactive data dashboard on consumer preferences for goat and sheep dairy products for the
Northeast Dairy Business Innovation Center (NE-DBIC). To accomplish these deliverables, Atlantic
conducted secondary market research of existing literature regarding the goat and sheep dairy
industry, implemented a consumer preference survey of 597 Northeastern consumers, and
conducted a business-to-business (B2B) survey of 26 New England sheep and goat dairy farms.
This detailed market research will help sheep and goat milk producers accurately assess the best
markets, packaging options, and marketing activities to expand product lines and distribution,
ultimately resulting in more profitable operations. With the culmination of a comprehensive research
report and an easy-to-use, interactive data dashboard, this project supports the NE-DBIC’s aim “to
strengthen industry engagement, improve strategic planning, and support business development
and financial success to grow this sector of agriculture.”
The following objectives were completed, as described in the subsequent sections of this report:
1. Conduct a Domestic Consumer Demographics and Insights Survey. The goal of this objective
was to generate meaningful data to understand market conditions, gaps, opportunities, and
roadblocks relevant to sheep and goat milk operations.
2. Conduct a B2B Sheep and Goat Milk Industry Survey. The goal of this objective was to map
out the most effective sales channels for Vermont and New England-based sheep and goat
dairies based on first-hand accounts of previous market successes and failures.
3. Analysis of Global Market Conditions and Context. The goal of this objective was to develop
a comprehensive understanding of global markets, identify key factors that may influence
producers’ competitiveness, and potential avenues to improve market advantage.
4. Prepare Final Report and Interactive Dashboard. The goal of this objective was to aggregate
all findings and methodologies for the project to produce a final report for sheep and goat
dairy farmers and to develop a web-based interactive data dashboard for users to access and
assess project data.

Sheep and Goat Dairy Market Conditions and Consumer Research 5
Executive Summary
Atlantic conducted comprehensive mixed-methods market, consumer, and stakeholder research of
sheep and goat dairy products for the NE-DBIC to assess consumer preferences, define optimal
distribution channels, and identify strategies to improve and expand opportunities for U.S. sheep and
goat dairy producers and handlers. Our research consisted of the following components: primary
quantitative consumer research; secondary market research; and qualitative business-to-business
(B2B) research. Key findings are highlighted in this summary.
Consumer Preferences
Atlantic developed and implemented a consumer insights survey of 597 Northeast consumers to
determine attitudes and preferences about sheep and goat dairy products, including cheese, milk,
and yogurt. Key findings are as follows:
- Of the sheep and goat dairy products assessed, cheese was the most consumed, and may
be the leading product for sheep and goat dairy given its broad general appeal. Plant-based
products dominate market share for milk and yogurt alternatives.
- According to consumer liking ratings among those who tried the dairy types, cow dairy
products were liked the most, followed by sheep dairy then goat dairy. Sheep and goat dairy
products were still liked by half to two-thirds of those who tried them.
- Customer segments to target include those ages 18-44 years as well as households with
children under the age of 18 years, as households of both groups had high rates of dairy
consumption and spending. These consumers were significantly more likely to trial and
consume sheep and goat dairy products.
- In general, most consumers do not perceive sheep and goat dairy products as available for
purchase at their usual retail channels. Goat cheese was perceived to be available by half of
the respondents, but far fewer respondents viewed all other sheep and goat dairy products
as available for purchase.
- Fewer respondents are willing to pay premium pricing for sheep or goat dairy over cow dairy,
and the same holds true for local over non-local dairy, as well as organic over conventional.
However, those willing to pay premiums are willing to pay up to 39% more for sheep or goat
dairy over cow dairy depending on the product. While the customer segment willing to pay
premiums for sheep or goat dairy may be smaller, the profit margins could make up for it.
- Providing samples to consumers should lead to higher rates of purchasing, as respondents
stated that they purchased an average of one-third to one-half of the sheep and goat dairy
products they sampled.
- The survey revealed preferred packaging types and sizes for each product and dairy type.
For goat and sheep dairy, smaller packaging was preferred across all product types. Half-
gallon and quart sizes for milk, 8-oz to 4-oz packaging for cheese, and single-serve 5-oz to
6-oz cups for yogurt.

Sheep and Goat Dairy Market Conditions and Consumer Research 6
B2B Survey of Industry Stakeholders
Atlantic conducted informal qualitative interviews with 26 sheep and goat dairy stakeholders to
assess the most effective sales channels and identify common challenges in the industry.
- Sheep and goat dairy producers may find the most success in urban, local markets, where
consumers are more willing to pay premiums for local products. Almost all producers
interviewed would prefer to be in local markets and they believe consumers are willing to pay
up to 35% more for local products. Although the consumer survey showed that fewer
respondents are willing to pay for local dairy, the premiums they are willing to pay for local
goat and sheep dairy align with producer estimates, at least for milk products.
- Direct-to-consumer online sales and partnerships with neighboring farms were strategies
developed during the pandemic that proved to be profitable. E-commerce is an emerging
sales channel that became common during the COVID-19 pandemic and its utilization is
predicted to continue rising after the pandemic.
- Most respondents handle their own distribution. Factors limiting distribution included
challenges in scaling operations to produce more volume given a lack of infrastructure. Many
farms surveyed are just starting out and lack critical distribution components (trucks, storage,
and space). Others expressed hesitancy in outsourcing to wholesale distributers due to small
profit margins.
- Sheep and goat dairy farms use many marketing strategies such as humor, bright and colorful
packaging, and social media, which have proven to be successful. Offering samples was
another successful marketing strategy noted by respondents, which aligns with the findings
from the consumer survey indicating that sampling can drive purchases.
- More marketing is needed to increase awareness and educate consumers on the benefits of
these products. Producers indicated a large need for additional assistance and resources to
help craft marketing plans and sponsor advertising.
Analysis of Market Conditions
Atlantic conducted robust secondary market research to assess U.S. and global trends in production
and consumption, describe the competitive landscape, and identify compelling opportunities for
production and marketing.
- The global goat milk market size was valued at $8.5 billion in 2018 and is expected to reach
$11.4 billion by 2026. The majority of goat milk produced is used for direct consumption. The
remaining milk is used for cheese production, followed by milk powder and other products.
- The demand for goat and sheep dairy products is steadily rising in the global market. An
estimated 65% of the world’s population consumes goat milk, with the majority consumed in
Asia, particularly in India.
- Although most goat dairy production and consumption occurs in Asia, North America is the
second largest market for goat dairy, and the U.S. industry continues to evolve. There are
over 35,000 goat dairy farms in the U.S., and total sales topped $35 million in 2017. The New
England region has 1,570 goat dairy operations.
- The U.S. and Germany are leading importers of sheep cheese, accounting for 42% and 41%,
respectively, of all sheep cheese imports. Both the U.S. and Germany could serve as a
potential market for U.S. producers if they can capture a share of the imports.

Sheep and Goat Dairy Market Conditions and Consumer Research 7
- Market trends driving growth in the global industry include population growth and emerging
economies, government subsidies, technological development, trends in convenience foods
and snacking, and health and wellness.
- There are numerous health benefits of sheep and goat dairy products that producers can
capitalize on as health awareness is rising. Goat milk contains important amino acids,
calcium, Vitamin A, and other vitamins and minerals, while sheep milk is high in fatty acids,
immunoglobulins, proteins, and vitamins. Goat milk is also proven to be easier to digest than
cow milk and the lactose-free segment of dairy is the fastest growing.
- Value-added sheep and goat dairy products can be lucrative, such as infant formula, ice
cream, and especially cheese, as confirmed by the consumer survey. Demand for infant
formulas made with sheep milk and goat milk powders is rising in Asian countries.
- Market challenges specific to the U.S. include governmental regulations; high operating costs,
especially for the use of the country’s only milk testing and record keeping organization;
transportation costs for processing and distribution; limited available market research; and
high costs of production associated with limited sheep breeds in the U.S.
o High prices limit sales of sheep and goat dairy to specialty stores rather than
supermarkets, where most of consumers spend their money on dairy products,
according to survey.
- Local producers should capitalize on the “locavore” movement that encourages consumers
to purchase food from local, small-scale producers. This marketing is likely to be particularly
effective in Vermont and other New England states, based on their proximity to urban centers
and affluent consumers. Our consumer survey suggests that those willing to pay premiums
for local dairy are willing to pay between 19% and 30% more for locally produced goat or
sheep dairy over non-local dairy, depending on the product.
Sheep and Goat Dairy Market Conditions and Consumer Research 8
1. Consumer Preference Survey Results
Atlantic conducted a survey of Northeast consumers from New England as well as New York and
New Jersey to evaluate consumer preferences and spending of sheep and goat dairy products,
specifically cheese, milk, and yogurt. The survey tool can be found in Appendix A, while the
methodology of this survey is described in Appendix B.
Respondent Characteristics
A total of 597 consumers completed the survey, 75 from each state, except Vermont, which had
72 completes. Detailed respondent characteristics can be found in Table C1 of Appendix C. Key
findings are as follows:
- Respondents slightly skewed female (54.8%), and there were more respondents in the
oldest age category of 65+ years than the youngest category of 18-44 years (36.9%
compared to 28.6%, respectively).
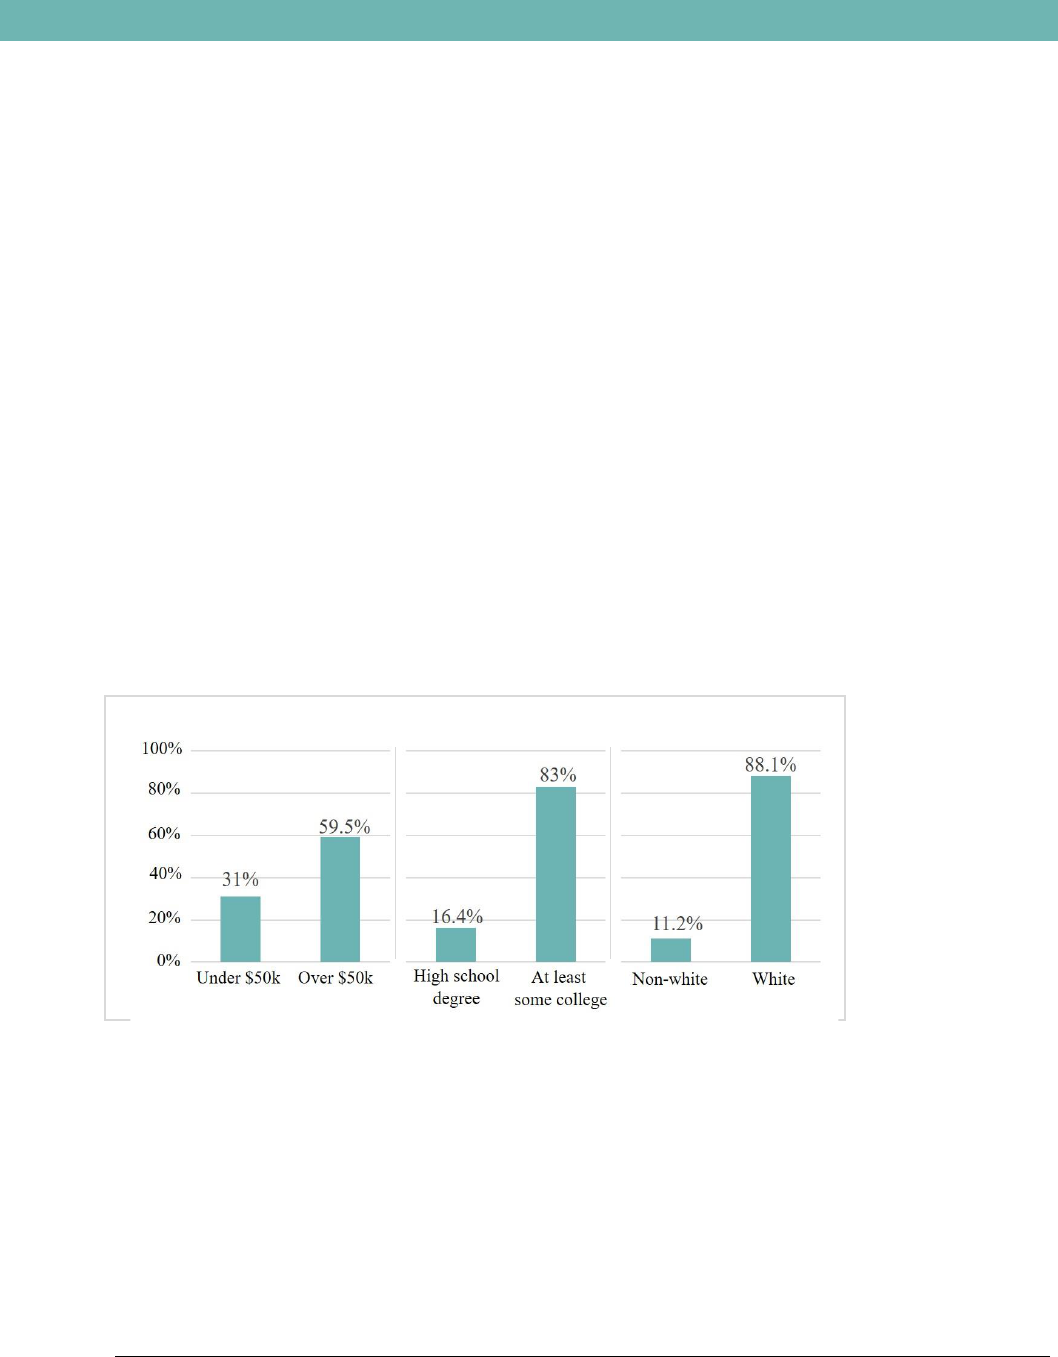
- The majority of respondents were white, married, had incomes of at least $50,000, and
completed at least some college (Figure 1).
- About one-third of respondents were employed full-time, while 38% were retired.
- More respondents indicated living in suburban areas than rural or urban areas.
- The vast majority of respondents (78%) had households of 2+ people that they shopped
for, including themselves. About 20% of respondents had children under the age of 18 years
living in the home.
Respondent Characteristics
Figure 1. Respondent characteristics: income, education, and race.

Sheep and Goat Dairy Market Conditions and Consumer Research 9
Consumption and Spending
By study design, all respondents consumed cheese, milk, and/or yogurt
of any type (cow, goat, or sheep) at least once monthly. Consumption
regarding each type was assessed, as was spending on general dairy
products across several retail channels.
- Cheese had the highest rate of consumption, followed by milk
and butter, though rates of ice cream and yogurt consumption
were also high (Figure 2).
- Fewer respondents consume sheep and goat dairy products, but
over half of respondents reported consuming sheep or goat
cheese (Figure 2).
- Consumers indicated making most of their dairy purchases at
regional supermarkets, followed distantly by national supermarkets or membership clubs.
- On average, respondents spent $38.00 on cheese, $40.90 on milk, and $41.60 on yogurt
per month at regional grocery stores.
- At national and membership clubs, they spent $17.90 per month on cheese, $22.10 on milk,
and $16.50 on yogurt.
Consumer Preferences
Preferences for dairy type were assessed by product (cheese, milk, and yogurt). Consumer liking
for each product was assessed on a scale of 1 (“Dislike very much”) to 10 (“Like very much”).
- Respondents overwhelmingly preferred cow dairy across all products assessed assuming
price and quality are equal (Figure 4).
- Consumers generally favored plant-based alternatives behind cow dairy.
- Only a small fraction of consumers preferred goat or sheep dairy (Figure 4).
Figure 2. Dairy consumption by product type and dairy type. Only cheese, milk,
and yogurt consumption of sheep or goat dairy was assessed.
0%
20%
40%
60%
80%
100%
Cheese Milk Butter Ice cream Yogurt Cream
Cow, sheep, or goat Sheep or Goat
Dairy Consumption
89% of
respondents
consume cheese.
56% consume
goat cheese.

Sheep and Goat Dairy Market Conditions and Consumer Research 10
- Almost all those who consumed cow dairy products within the past five years indicated that
they liked it (scores of 8-10).
- Many of those who tried sheep products indicated they liked them (55-70% depending on
the product).
- Respondents appeared to like goat milk the least, with only 44% of those trying the product
liking it. Goat cheese and yogurt had higher ratings of liking of 58% and 63%, respectively.
Willingness to Pay
Willingness to pay was assessed to determine how much more (or
less) consumers were willing to pay for sheep or goat dairy
products over cow dairy. We also assessed willingness to pay for
locally or regionally produced dairy products compared to non-
local dairy and organic dairy compared to conventional dairy.
- Only 7-12% of consumers were willing to pay more for
sheep dairy over cow dairy depending on the product, while
9-16% were willing to pay more for goat dairy (Figure 6).
- Those willing to pay more for sheep or goat dairy were
willing to pay over 25% more for each product, while those
inclined to pay less sought to pay around 40% less than cow
dairy products in most cases (Figure 7).
- One-quarter of consumers were willing to pay more for local cow dairy products as
compared to non-local. About 9-13% were willing to pay more for local sheep or goat dairy
depending on the product.
- Of those willing to pay more for local milk, they were willing to pay an average of 46% more
for local cow milk, 29.5% more for local sheep milk, and 27.2% more for local goat milk as
80%
78%
85%
7%
13%
5%
0% 20% 40% 60% 80% 100%
Cheese
Milk
Yogurt
Cow Plant-based Goat Sheep No Preference
Consumer Preferences by Product
Figure 3. Preferences for dairy type by product (cheese, milk, or yogurt)
assuming price and quality are equal.
Consumers are
willing to pay the
highest premiums
for local or organic
sheep and goat milk.
Sheep and Goat Dairy Market Conditions and Consumer Research 11
compared to non-locally or regionally produced products.
- Consumers were only willing to pay 19.6% for local sheep cheese and 18.9% for local goat
cheese over non-local.
- Trends were similar for organic dairy as compared to conventional. Across all dairy types,
consumers were willing to pay the highest premiums for organic milk of all three products.
They were willing to pay 35.4% more for organic cow milk, 27.8% for organic sheep milk,
and 31.6% for organic goat milk over conventional.
Figure 5. How much more (or less) respondents are willing to pay for sheep or goat dairy
compared to cow dairy.
-43%
-41%
-37%
-40%
-40%
-37%
29%
38%
27%
33%
39%
27%
-50% -30% -10% 10% 30% 50%
Yogurt
Milk
Cheese
Yogurt
Milk
Cheese
Goat
Sheep
Percentage willing to pay less or more
Less More
Percentage Willing to Pay Less or More Over Cow Dairy
Figure 4. Number of respondents willing to pay more (or less) for sheep or goat dairy as
compared to cow dairy.
WTP for Sheep/Goat Dairy Compared to Cow
26%
32%
27%
26%
32%
23%
7% 8%
12%
9%
10%
16%
0%
10%
20%
30%
40%
50%
Yogurt Milk Cheese Yogurt Milk Cheese
Sheep Goat
Percent of Respondents
Less More

Sheep and Goat Dairy Market Conditions and Consumer Research 12
Packaging Preferences
Preferences regarding packaging type and size were assessed for cheese, milk, and yogurt across
all dairy types. Key findings are as follows:
- Consumers preferred vacuum-sealed packaging for cheese or had no preference regarding
packaging across all dairy types.
- Preferred cheese package size varied by dairy type. About 30% of consumers desired 16-
ounce unit sizes for cow cheese, while around 30% desired 8-ounce sizes for sheep and
goat cheese (Figure 6).
- Respondents generally prefer white plastic containers for their milk, regardless of the dairy
type, followed by clear plastic containers or cartons.
- Only 5% of respondents preferred glass bottles for cow milk, and 9% preferred glass bottles
for sheep and goat milk each.
- Respondents were split between preferring gallon or half-gallon sizes for cow milk. Most
preferred half-gallon or quart sizes for sheep and goat milk.
- When asked specifically about specialty batch or artisanal milk, respondents preferred
smaller sizes (quart or 16-ounce pint) for sheep and goat milk.
- Consumers indicated an overwhelming preference for yogurt packaged in single-serving 5-
to 6-ounce cups.
- Over half of all respondents desired white plastic containers for yogurt across all dairy types,
while 19% to 25% had no preference regarding packaging type.
- More respondents preferred drinkable containers for goat or sheep yogurt than they did for
cow yogurt (11% for sheep, 10% for goat, and 3% for cow).
- Very few respondents preferred squeeze tubes for any dairy type.
10%
30%
15%
24%
4%
17%
0%
10%
20%
30%
40%
32 oz. 16 oz. 12 oz. 8 oz. 4 oz. No
Preference
Percentage of respondents
Cow Sheep Goat
Figure 6. Preferred packaging size for cheese by dairy type (among those who purchase
each cheese type)
Preferred Packaging Size - Cheese
Sheep and Goat Dairy Market Conditions and Consumer Research 13
Other Factors Affecting Purchasing Decisions
Many other factors that could affect purchasing decisions were
assessed, including perceived availability, label information,
sampling, and familiarity with dairy operations.
- Among those who do not purchase sheep or goat dairy, few
believe these products are available for purchase, with the
exception of goat cheese.
- About 48% of respondents perceive goat cheese as
available. In comparison, 19% believe sheep cheese is
available.
- Goat and sheep yogurt were perceived as being least
available, with only 4% and 9% of respondents reporting
sheep and goat yogurt as being available to purchase,
respectively.
- Sampling may help drive sales of sheep and goat dairy products. Among those who have
sampled these products in stores, over half indicated they went on to purchase the milk
products they sampled, while one-third purchased the cheese they sampled (Figure 7).
- When assessing labels, most respondents indicated that they do not have a preference
when it comes to the level of detail regarding geographic origin contained on labels.
Although, about one-quarter did prefer to see state-level information on the labels.
- Respondents were generally unfamiliar with the dairy operations that produce the products
they purchase, with no more than 25% of respondents familiar with dairy operations
producing their cheese, milk, or yogurt products.
Figure 7. Percentage of respondents that have ever sampled sheep or goat dairy
products and the percentage of those who go on to purchase the products after.
sampling.
Sampling Dairy Products
60%
33%
36%
59%
51%
45%
0%
10%
20%
30%
40%
50%
60%
Ever
sampled
Purchased
after
sampling
Ever
sampled
Purchased
after
sampling
Ever
sampled
Purchased
after
sampling
Cheese (n=534) Milk (n=127) Yogurt (n=67)
Percentage of respondents
Offering samples
can improve
consumer
awareness and help
drive sales of sheep
and goat dairy
products.

Sheep and Goat Dairy Market Conditions and Consumer Research 14
2. Demographic Subgroup Analysis
Atlantic assessed differences in spending and preferences across demographics, using t-tests at
the 95% level of confidence.
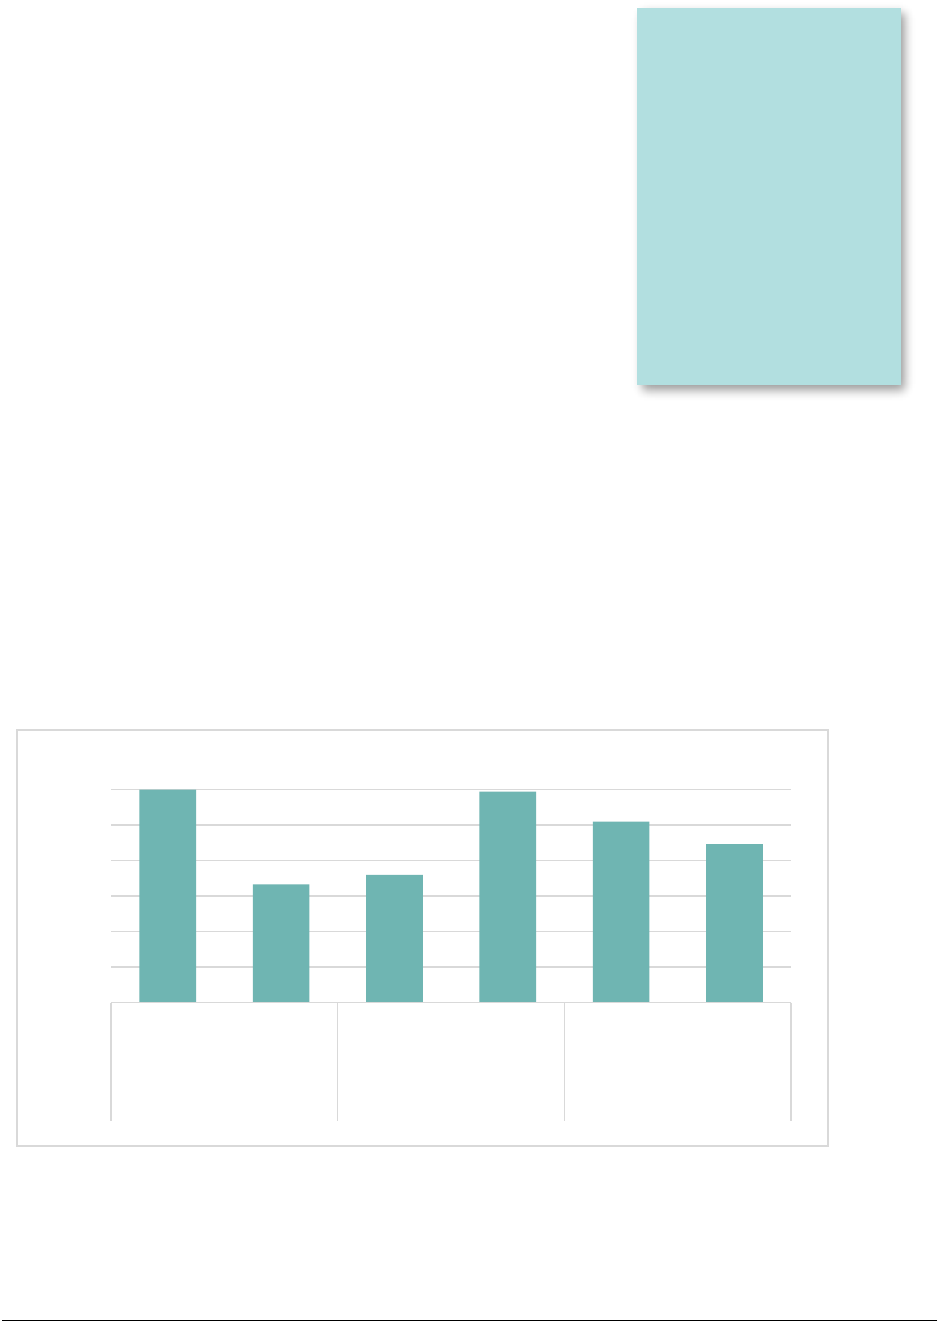
Spending
Average household monthly spending on dairy products at each retail channel varied widely by
state. Tables C2-C5, available in Appendix C, describe these results in detail. Key findings are as
follows:
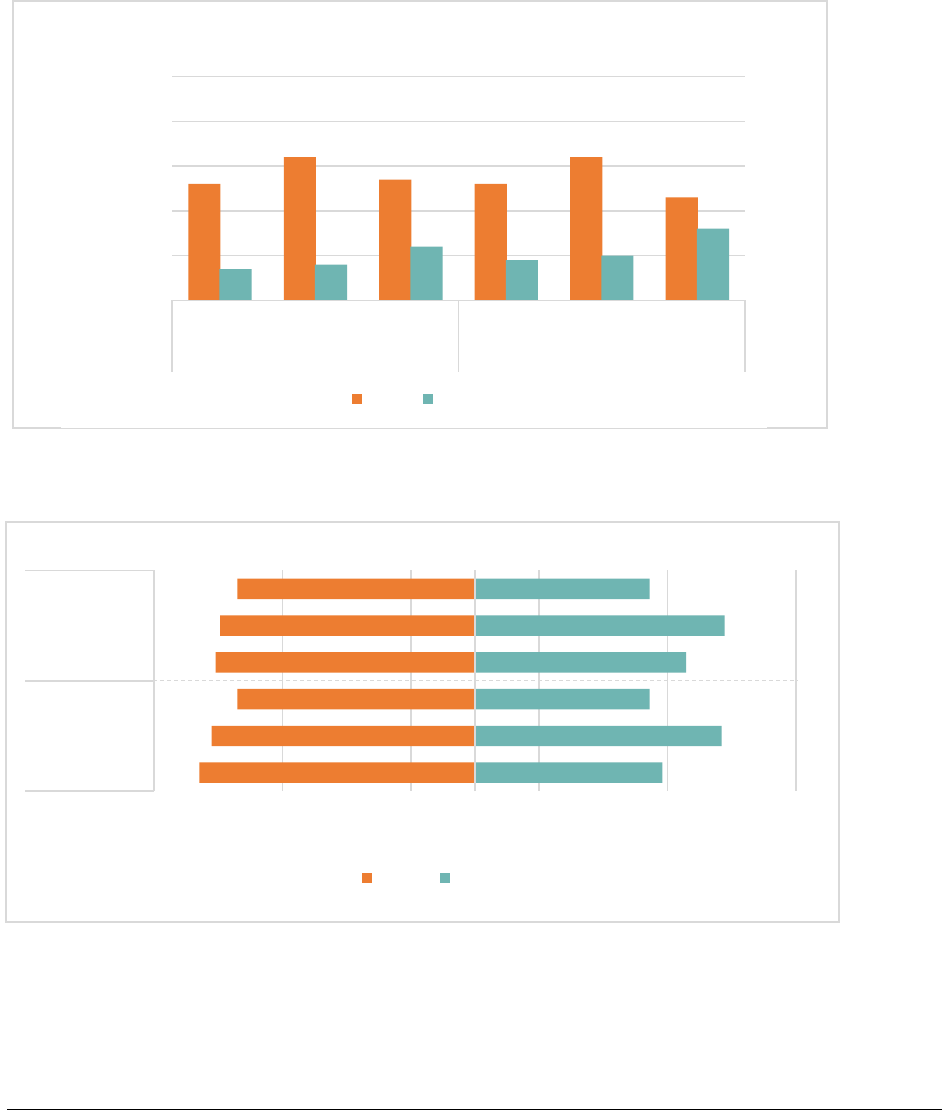
- Those in New York, New Jersey, and Massachusetts typically spent more than those in
other states on dairy products in general.
- Those in New York spent significantly more on cheese than those in all other states, except
for New Jersey, at national retailers/membership clubs and at specialty food markets
(Figure 8).
- Those in New York, New Jersey, and Massachusetts spent significantly more on milk than
all other states at national retailers/membership clubs and convenience stores.
- Those in New Jersey spent significantly more on yogurt than those in all other states, except
New York and Massachusetts, at the following channels: national chains; cooperative or
local food grocery stores; convenience stores; farmer’s markets and farm stands; and
specialty food markets.
Figure 8. New York and New Jersey cheese spending compared to the
average spending of all other states assessed (CT, ME, MA, NH, RI, VT)
$30.80
$54.20
$28.70
$26.00
$25.20
$29.90
$25.00
$0.00
$10.00
$20.00
$30.00
$40.00
$50.00
$60.00
Avg of other states assessed NY NJ
New York and New Jersey Cheese Spending

Sheep and Goat Dairy Market Conditions and Consumer Research 15
We also assessed differences in average monthly spending on cheese at each retail location
across age using categories of 18-44 years of age, 45-64, and 65+; income using categories of
<$50k (low-income group), $50k-$100k (middle-income group), and >$100k (high-income group);
and presence of children under the age of 18 years in the household. Tables C5-C7, available in
Appendix C, describe these results in detail. Key findings are as follows:
- Younger respondents spent significantly more on cheese per month than the older age
groups across every retail channel.
- Those ages 45-64 years spent significantly more on cheese at convenience stores, farmer’s
markets/stands, specialty food markets, and mail order/delivery than those 65 or older.
- Those in the high-income group spent significantly more on cheese than those in the
middle-income group across every retail location.
- High earners also spent significantly more than the lowest income group at national chains,
farmer’s markets and farm stands, and specialty food stores.
- Respondents in households with children spent significantly more on cheese on average
than those without at every retail channel.
- The youngest age group spent significantly more on milk per month than both the older age
groups across all retail channels.
- High earners spent significantly more on milk per month than those in the middle-income
group across all retail channels. They also spent significantly more than those in the low-
income group at national chains, farmer’s markets/stands, and specialty food stores.
- Respondents in households with children spent significantly more on milk than households
without children at every retail channel.
o This variable may drive higher spending seen in the younger age group (18-44 years)
as these respondents may be most likely to have young children that have high rates
of milk consumption.
- Much like cheese and milk, the youngest respondents, spent significantly more on yogurt
per month than the older age groups across all retail channels.
- The highest earners spent significantly more on yogurt than the other age groups at national
retailers and membership clubs.
- Respondents in households with children spent significantly more on yogurt than
households without children at every retail channel.
Preferences
Preferences for cheese, milk, and yogurt were assessed across demographic subgroups as well.
Key findings are described below.
- Older respondents were significantly more likely than the youngest age group (18-44 years)
to prefer cow cheese as compared to sheep or goat cheese. Those in the youngest age
group were significantly more likely to prefer sheep cheese.
- The highest earners were significantly more likely than the lowest to prefer goat cheese.
- Older respondents were significantly more likely to prefer cow yogurt over sheep and goat
yogurt than those in the youngest age group.

Sheep and Goat Dairy Market Conditions and Consumer Research 16
- Men were significantly more likely than women to prefer sheep yogurt, although still only a
small percentage of consumers preferred sheep yogurt.
- The youngest respondents were significantly more likely than older age groups to prefer
sheep yogurt, as were those with children in the household compared to those without.
3. Survey Insights and Recommendations
Increasing awareness of the availability of sheep and goat cheese, milk and yogurt would certainly
increase consumption. The most broadly consumed sheep and goat dairy products among
respondents was cheese. Yet, among those who reported consuming cheese but not sheep and/or
goat cheese, only 19% said they were aware of sheep cheese being available for purchase while
48% said goat cheese is available for purchase. Even lower rates of perceived availability were seen
for sheep and goat milk and yogurt. Familiarity of the dairy operations that produce these products
is also low. It is likely that increasing consumer awareness of these operations will also increase
their perception of sheep and goat dairy availability.
Providing more opportunities for consumers to try sheep and goat dairy products would likely drive
increases in consumption. Most cheese, milk and yogurt consumers have never tried the sheep and
goat varieties. Respondents overwhelmingly prefer the taste of cow dairy products over sheep and
goat; however, this could be due in large part to the lack of consumption of sheep and goat dairy. Of
those who purchase goat and sheep dairy, roughly one-third to 60% indicated they have sampled
these products. Of those who sampled these products, another one-third to 60% indicated they went
on the purchase the products they sampled, depending on the product type.
Grocery stores are the most shopped at channels for dairy, and those like Whole Foods provide
good opportunities for sampling of products. Wegmans, which has a very loyal following, also
provides samples and covers much of New York and Massachusetts, while Hannaford’s, which is
known for selling local products, covers most of the region included in the research.
Producers may want to focus on selling sheep and goat cheese, as these products have the highest
rates of consumption as compared to milk or yogurt. Target markets to focus on are younger adults
(18 to 44) and households with kids under the age of 18 as trial and consumption of sheep and goat
dairy products is higher among these segments than their counterparts. General spending on dairy
is highest among these groups as well across all retail channels as well.
This study uncovered preferred packaging types and sizes, which can help producers and
processors tailor their products to appeal to consumers. Typically, respondents preferred smaller
packaging for sheep and goat dairy, including half-gallon or quart sizes for milk, and 8-ounce or 4-
ounce packaging for cheese. Even smaller packaging (quarts and pints) were preferred for specialty
batch milk products. For yogurt, respondents overwhelmingly preferred five to six-ounce cups for all
dairy types.
4. Business to Business Survey
Atlantic conducted a qualitative business to business (B2B) survey of New England-based sheep
and goat dairies to map out the most effective sales channels based on first-hand accounts of
previous market successes and failures. Through interviews with 26 sheep and goat dairy farms, we
assessed trends in pricing and sales across various markets, explored previously profitable
distribution methods and successful marketing strategies, and identified current innovative practices.
The methodology for this study is described in Appendix D.

Sheep and Goat Dairy Market Conditions and Consumer Research 17
Respondent Characteristics
A total of 26 interviews were completed. A list of all respondents can be found in Appendix E.
- Respondents were located within one of four states:
o Vermont (14)
o Maine (7)
o New Hampshire (4)
o Massachusetts (1)
- Most respondents produce goat dairy (89%) with four of these operations also producing cow
dairy. Only two respondents produce sheep milk and two produce soap made from goat milk.
- Most respondents produce cheese (88%) followed by milk (54%) then yogurt (35%) (Figure
9).
- Respondents employed an average of 2.9 employees, including respondents themselves.
The smallest operation had only one employee and the largest 10.
- Respondents have been processing dairy for an average of 10.4 years, with the newest
business in operation for two years and the oldest in operation for 35 years.
- On average, respondents rated the current performance of their operations as a 5.0 on a 7-
point scale, with 1 being extremely unsatisfied and 7 being extremely satisfied.
Price Points
The retail and wholesale price points for each product are provided in Tables G1-G3 of Appendix G.
Key findings are as follows:
- The average retail price for goat milk was $18 per gallon, ranging from $12 to $32 per gallon.
- The average retail price of goat cheese was $19 per pound, ranging from $9 to $30/lb. Fewer
respondents offered wholesale goat cheese, the average price of which was $13.
- Retail prices for goat yogurt ranged from $7 to $20, while prices for sheep yogurt ranged from
$40 to $50 per quart.
1
2 2
4
2
0
13
1 1
17
7
2
0 0 0
2
0
1
0
5
10
15
20
Milk Cream Butter Cheese Yogurt Frozen
Dairy
Number of farms
Cow Goat Sheep
Figure 9. Type of products produced by participating farms

Sheep and Goat Dairy Market Conditions and Consumer Research 18
Distribution Channels
We assessed how and where respondents are currently selling their products as well as where they
would like to be selling their products.
- On average, respondents sold more products to rural consumers than urban (61% vs. 39%).
- The most utilized sales channel was retail or wholesale (53% of respondents), followed by
farmer’s markets (39%) and local grocery stores (8%).
- For those utilizing retail distribution channels, most sell in either their own store or in local
natural or artisan food stores, while others sell in regional stores, high-end cheese shops,
restaurants, and CSA’s.
- Most respondents handle their own distribution. Only 35% of respondents utilize a distribution
company, many of which use Provisions International or Farm Connex.
○ Others indicated using Black River Produce, Saxelby Cheese, Pumpkin Village North,
and Milk Mavens.
- On average, respondents reported that their products travel about 415 miles from the farm to
the point of sale. About half of the respondents sell their product to channels within 100 miles
of the farm. One sells globally and one sells to channels 3,000 miles away.
- Ideally, most respondents would like to sell in local markets (92%) as well as markets within
their state (69%) and surrounding states (42%) (Figure 10).
○ Local markets are desirable because almost all respondents believed consumers are
willing to pay at least 10% more for local products. On average, respondents thought
consumers would be willing to pay 35% more.
92%
69%
42%
31%
19%
0%
20%
40%
60%
80%
100%
Percentage of Respondents
Figure 10. Ideal geographic markets where respondents want
their products

Sheep and Goat Dairy Market Conditions and Consumer Research 19
Challenges in Distribution
Respondents were asked to provide open-ended answers about the factors that limit distribution. A
summary of findings is described below. Detailed participant responses providing more nuance are
provided in Table G4 of Appendix G.
- Eight respondents expressed challenges in scaling operations to produce more volume.
Given that goats and sheep produce less milk than cows, it can be difficult to meet the demand
of local markets, one that most respondents want to participate in.
- Conversely, three farms shared their concern about lack of demand, specifically for goat soap
as there is belief the market is oversaturated.
- Seven respondents stated lack of infrastructure as the main growth limiting factor. Several of
these farms are in their infancy and are lacking critical components of a solid distribution
system such as trucks, storage, and space.
- Farmers are also hesitant to outsource to wholesale distributors due to smaller profit margins.
For the smaller farms, it is simply unprofitable.
Strategies to Improve Distribution
Respondents were also asked how they could improve their distribution strategies. Table G5 in
Appendix G describes participant responses. Key findings are as follows:
- Many said that more focus needs to be placed on marketing and direct outreach to
consumers by implementing more advertisements and more marketing toward stores.
- Improvements to infrastructure and organizational capabilities were on the top of the list for
eight farms, which indicated that new delivery trucks and a better supply chain would
improve their distribution strategy.
- Farms need expanded access to capital to make these infrastructure improvements.
Innovative Approaches
Respondents were asked about innovative approaches in the processing, packaging, or sales of
their products. Table G6 in Appendix G details specific responses.
- Due to the pandemic, some respondents pivoted their sales and marketing strategies to online
sales direct to consumer, while others opened farm stands or partners with neighboring farms
to establish co-ops (Table 6).
- Many found the best way to differentiate themselves was through creative marketing such as
humorous advertisements and the use of social media.
- Three farms noted their approach to packaging. Two use environmentally friendly packaging
to appeal to consumers that prioritize sustainability, and another uses bright and colorful
packaging as a marketing strategy.

Sheep and Goat Dairy Market Conditions and Consumer Research 20
Comments for the NE-DBIC
Respondents were asked to provide information they want the NE-DBIC and the VAAFM to know
about producing goat and sheep dairy products. Table G7 in Appendix G details specific responses.
- Respondents cited concerns with lacking infrastructure, high operating costs, and the need
for more resources to address these challenges such as investments in small farms, grants,
and advertising.
- Many respondents noted the high demand for goat and sheep dairy products and room for
growth in the industry. They stated that providing opportunities for consumers to sample
products and improving consumer awareness can help farmers achieve this growth.
- Three respondents noted regulations as a barrier to entry among small businesses.
- Two participants mentioned challenges regarding costs of labor and labor shortages.
B2B Insights and Recommendations
This qualitative study was undertaken to explore the most effective sales strategies used by goat
and sheep farms in New England. Specifically, we aimed to better understand pricing strategies
across various product types and identify themes in distribution successes and challenges as well
as current innovative practices.
Our findings showed that most respondents produce cheese. This is likely due to increasing
consumer demand for locally-sourced specialty cheese and the premium prices for which consumers
are willing to pay. Producers are aware of these growing trends, and local markets were by far the
most sought-after geographic market for respondents’ products, with many believing that consumers
are willing to pay an average of 35% more for locally produced dairy products. Price points varied
widely within product categories. More research on sales data and profit margins is necessary to
gauge the effectiveness of varying pricing strategies.
Despite the enthusiasm for local markets, entry into these markets is challenging. Most respondents
handle their own distribution, and scaling operations to meet the demand of local distribution
channels would be difficult given the low milk output of goats and sheep in comparison to cows. High
costs of operations are another barrier to expansion, as is the lack of infrastructure and organization
in the industry that many farms require to profitably scale and take on a distributor. Nevertheless,
farmers insist the demand for goat and sheep milk products is there, and that there is room for growth
in the industry, especially if they can improve consumer awareness about the products and their
benefits. Consumers are often looking for healthier and easier to digest alternatives to cow milk, and
goat and sheep milk products can fill that need.
Goat and sheep farms are still finding success, particularly through creative marketing tactics such
as humorous or authentic advertisements, the use of social media, and by offering samples. Many
still believe that more marketing is needed, likely to educate consumers about their products.
Packaging was another noted tactic, with environmentally friendly and colorful packaging commonly
used by respondents.
Respondents were very clear regarding the need for more resources to help goat and sheep farms
overcome barriers to scaling operations and becoming more profitable. Some were frustrated about
the struggle small farms face and indicated there are many large structural problems within the
industry that need to be solved. Some resources that could help are industry-sponsored advertising
to help educate consumers about the benefits of goat and sheep milk as well as investments in small
farms, particularly grants, which some perceive as difficult to navigate and apply for as small farms.

Sheep and Goat Dairy Market Conditions and Consumer Research 21
Based on our findings, we have summarized our recommendations for goat and sheep dairy farms
and industry stakeholders as follows:
- Goat and sheep dairy producers may find the most success in local markets, particularly urban
ones where consumers are more willing to pay premium prices for local products. Those who
sell solely in rural markets should have effective marketing strategies for selling expensive
specialty goods to rural consumers less willing to pay for local attributes.
- Current successful marketing strategies include use of humor, social media, authentic
marketing, colorful packaging, and highlighting unique characteristics of the farm animals.
- Small goat and sheep farms found success pivoting to new sales and marketing strategies
during the pandemic, including new distribution channels such as direct-to-consumer online
sales and partnerships with neighboring farms to establish co-ops, making it easy for
consumers to shop locally in one place. These strategies may be worth exploring as online
food sales and demand for local foods is expected to keep rising even after the pandemic.
- There is room for growth in the sheep and goat dairy industry. More marketing is needed to
educate consumers on the benefits of these products; however, additional resources must be
directed to small goat and sheep farms to enable them to develop marketing plans.
Additionally, goat and sheep dairy industry associations could sponsor advertising to increase
consumer awareness of goat and sheep milk products and their benefits.
- State agencies and other agricultural grantmaking organizations should consider adding new
programs to support small farms or should better highlight existing programs and provide
training opportunities to teach small farmers how to apply for assistance through webinars,
easy-to-follow guides, or additional promotion of how to find these resources.
5. Analysis of Global Market Conditions and Context
Atlantic conducted secondary market research of the sheep and goat dairy industry to develop a
comprehensive understanding of global and domestic markets, identify key factors that may
influence producers’ competitiveness, and assess potential avenues to improve market advantage.
We conducted a global review of existing industry and trade research to determine the precise
sizing of international markets for sheep and goat milk products, including market statistics,
economic insights, a breakdown of industry product segments, key market and industry trends,
and analyses shaping the direction of the market. We utilized available data such as market
research reports, analyst reports, proprietary business and industry databases, government
resources, trade journals, and any pertinent secondary resources to inform the recommended
engagement strategy for Vermont and New England-based producers.
Industry Trends
Market projections for goat and sheep dairy show consumer demand will increase significantly
worldwide, providing new prospects for dairy producers, including U.S. farms that are poised to
embrace opportunities. Global sheep and goat dairy markets are currently valued at about $8 billion
each. Research indicates these markets will continue to expand, largely due to consumer demand
for dairy alternatives that have high-quality nutritional benefits but are lower in lactose and easy to
digest (Canterbury Development Corporation, 2017. Kadam et al., 2019). The global goat dairy
market is expected to increase by 42%, reaching $11.4 billion by 2026 (Kadam et al., 2019). Global
sheep milk production is expected to increase by approximately 26% by 2030 (FAOSTAT, 2018).

Sheep and Goat Dairy Market Conditions and Consumer Research 22
Research conducted by Atlantic shows significant untapped domestic market opportunities,
specifically for goat and sheep cheese products. A national survey completed in 2019 assessed
preferences for cheese made from either cow, goat, or sheep milk, assuming quality and cost are
consistent. Although 72% of respondents selected cheese made from cow milk as a top choice,
nearly 2% opted for sheep cheese, and almost 13% expressed a preference for goat cheese. State-
based data showed a wide range of preferences for sheep and goat milk cheese, from 1.5% (sheep's
milk cheese - Kansas) to 38% (goat's milk cheese - New York) (Atlantic Corporation, 2020).
While the sheep dairy market is comprised mostly of cheese products, the goat dairy market includes
a variety of health and beauty products as well as milk, cheese, and milk powder products, with fluid
milk the largest global market segment. Factors driving anticipated market growth for sheep milk are
similar to those invigorating the goat dairy sector, including an uptick in consumer demand for
nutritious, low-cholesterol milk alternatives, new opportunities in the health and beauty sector, and
expected population growth in Asia-Pacific countries, where goat milk is a dietary staple (Kadam et
al., 2019).
Although most of the world's dairy goat production and consumption occurs in Asia, the industry
continues to evolve in the U.S. (Miller and Lu, 2019).
According to the Agricultural Census, there are
35,682 U.S.-based dairy goat farms, and total sales topped more than $35 million in 2017 (USDA,
2017). The New England region has 1,570 dairy goat operations, accounting for 4.4% of the total
U.S. goat farms, and in 2017 these farms generated $1.8 million in sales.
Among the New England states, Maine has the largest number of farms, at 395, followed by
Massachusetts (335), Connecticut (280), Vermont (270), New Hampshire (231), and Rhode Island
(59) (USDA, 2017). However, Vermont dairy goat farms generated the most in sales among New
England states, bringing in $680,000 in 2017. Dairy goat operations represent about 4% of total farm
operations in the state (2017 Census).
Global trends of steady growth in the demand for goat milk products are mirrored in the U.S. In the
ten years between 2007 and 2017, the number of U.S.-based dairy goat herds more than doubled
and, in fact, outpaced all other major livestock groups in growth (Berry, 2018). USDA Agricultural
Census data show the number of milk goat farms grew 21% between 2012 and 2017, with
corresponding farm sales growing by 2%.
In addition to increased demand from health-conscious consumers and emerging economies, other
trends present sector opportunities and challenges. These include greater public awareness of dairy
alternatives, growth in e-commerce sales, more stringent government regulations, availability of
government subsidies, recognition of food production's impact on climate, and concerns about food
safety.

Sheep and Goat Dairy Market Conditions and Consumer Research 23
International Sheep and Goat Dairy Production and Consumption
Global Sheep and Goat Dairy Production
In 2016, dairy sheep and goats produced approximately 3.5%
of the world's milk. Cattle and buffaloes are the most important
milk producers globally, accounting for 83.1% and 13.1% of the
world's milk production, respectively. Sheep milk made up only
1.3% of the world's total milk production, and goat milk was
only slightly higher, at 1.9%. Sheep and goat milk remain a
small part of the world's total milk production, but both
industries are growing. In the last 50 years, worldwide sheep
and goat milk production has more than doubled. If this trend
continues, sheep milk production is expected to increase by
26% and goat milk production by 53% by 2030 (Figure 11)
(FAOSTAT, 2018). The world dairy goat population increased
by almost 22% between 2007 to 2017 (FAO, 2019). The
current global dairy goat population is estimated at 203 million
goats. There are an estimated 250 million dairy sheep in the
world (FAOSTAT, 2018).
The majority of the world's dairy sheep and goats are located
in subtropical-temperate areas of Asia, Europe, and Africa.
Dairy sheep are primarily found in the Mediterranean and Black
Sea regions, while dairy goats are concentrated in the Indian
subcontinent's low-income countries. Dairy goats can also be
found in high-income, technologically developed countries
worldwide, such as France and Spain (Pulina et al., 2018).
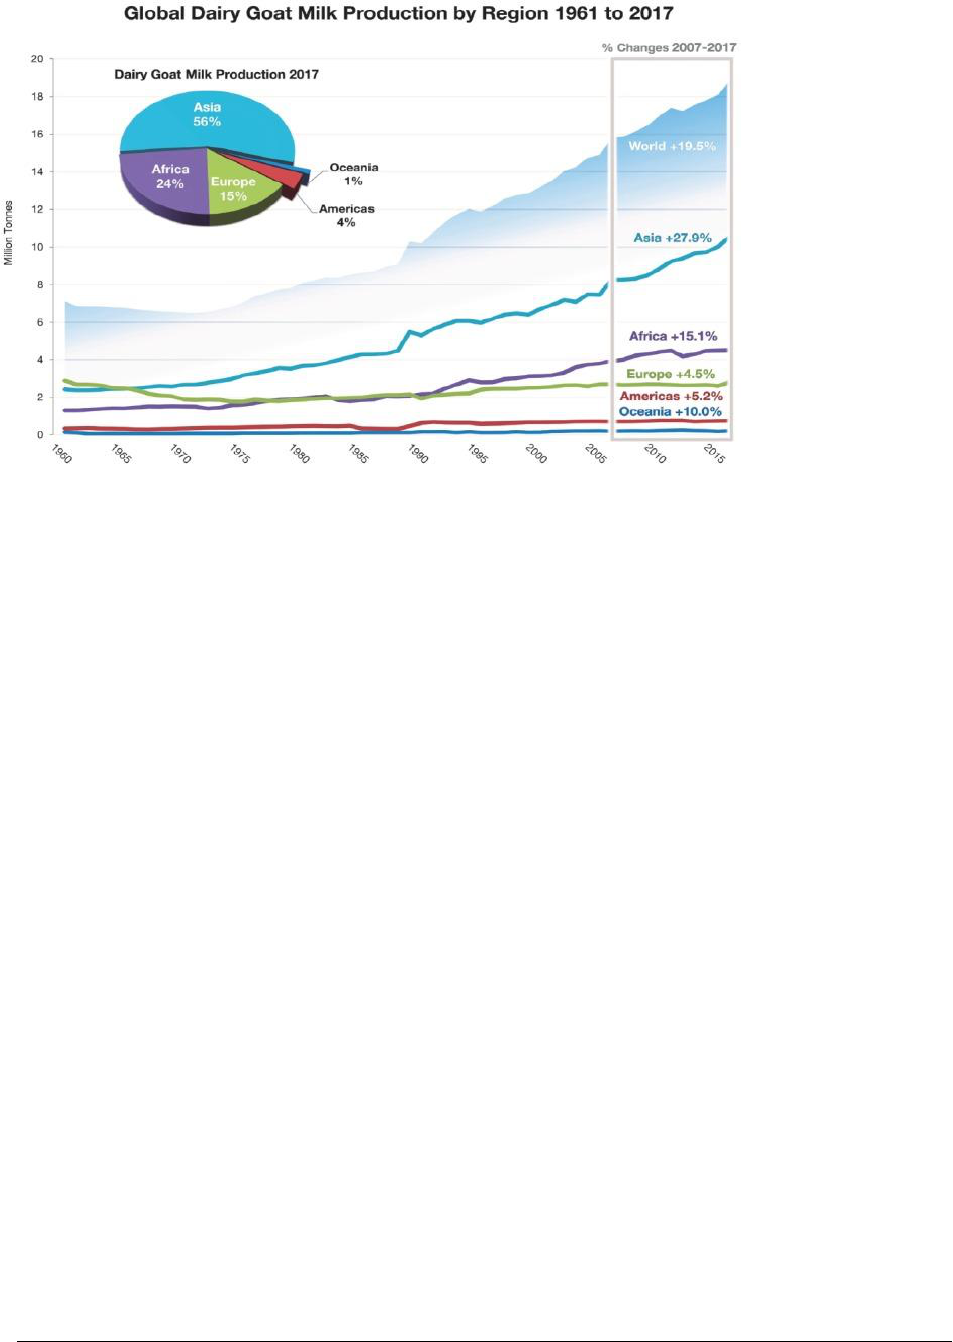
Global Goat Milk Production
Asia produces most of the world's goat milk (57%), followed by
Africa (24%) (Figure 12) (Lu and Miller, 2019).
Indian
subcontinent countries, including Indian, Bangladesh, and Pakistan, produce 40.7% of the world's
goat milk. China produces almost 2% of the world's goat milk and is rapidly increasing production.
Figure 11. World sheep and goat milk
production trends from 1960 to 2016 (solid
line) and forecast to 2030 using time-
series model (dashed line). (Source:
Pulina et al., 2018, FAOSTAT 2018.)
Sheep and Goat Dairy Market Conditions and Consumer Research 24
In Africa, Sudan and South Sudan are the most important milk producers (Pulina et al., 2018). The
goat milk industry in Europe is more specialized and commercialized than in any other part of the
world, allowing the region to produce 15% of the world's total goat milk with only 5% of the population
(FAO, 2019).
The Western Hemisphere is not considered a significant producer of goat milk and contributed only
4.4% of global goat milk production during 2006 through 2017 (FAO, 2019. Lu and Miller, 2019).
Mexico and Brazil are the primary dairy goat-producing countries in the Americas due to small-scale
production and local consumption.
Comparatively, the U.S. and Canada have fewer dairy goats but
rapidly commercializing industries.
In the ten years between 2007 and 2017, production increased
by 4.9% in the Americas while the dairy goat population decreased overall by 0.7%, indicating
productivity improvement with increased commercialization (Lu and Miller, 2019).
Global Sheep Milk Production
The majority of the world's sheep milk is produced in Asia (45.6%), mostly in China and Turkey.
Europe produces 29.0% of the world's sheep milk, followed by Africa (24.5%). Production is minimal
but growing in the North and South Americas (0.9%) and Oceania (<0.1%) (FAOSTAT, 2018).
In
Europe, France and Spain lead the sheep milk production market, and in combination with Greece
and Italy, produce 45.8% of the total sheep milk from the Mediterranean and Black Sea regions and
12.9% of the world's sheep milk (FAOSTAT, 2018., Elischer, 2017). In the United States, there are
approximately 100 commercial sheep dairies, primarily concentrated in the upper Midwest and New
England states, with a few found as far west as California (Elischer, 2017).
U.S. Sheep and Goat Dairy Production
The goat and sheep milk industries in the U.S. have been historically insignificant compared to the
country's cow dairy industry. Today, goat and sheep milk represent approximately 0.08% of the total
annual milk production in the U.S. (Milani and Wendorff, 2011). Approximately 75% of the goat milk
Figure 12. Global trends of goat milk production (Tonnes) from 1961 to
2017. From Miller and Lu 2019.

Sheep and Goat Dairy Market Conditions and Consumer Research 25
and 95% of the sheep milk produced in the U.S. are used to produce cheeses (Milani and Wendorff,
2011). Although the industries remain small, the U.S. goat and sheep dairy industries are seeing
significant growth. Dairy goat numbers in the U.S. doubled between 1997 and 2012 (Lu and Miller,
2019). In fact, dairy goat herds grew more quickly than any other major livestock group between
2007 and 2017, a ten-year period during which their size increased by 61%.
The U.S. Department of Agriculture's latest Census of Agriculture found that dairy goat herds grew
in all 48 states for which there was data. The most significant increases in dairy herd size were found
in Wisconsin, Iowa, and Texas, the nation's three biggest goat dairy states (Reiley and Van Dam,
2019). As of 2018, there were 2.6 million goats in the United States, approximately 380,000 (16%)
of which are thought to be raised primarily as dairy animals. Wisconsin, California, Iowa, Texas, and
Pennsylvania are the states with the highest number of dairy goats. These states are also in the list
of top 12 states for dairy cows, indicating that dairy goat production benefits from well-developed
cow dairy industries in the U.S. (Lu and Miller, 2019).
The Vermont dairy goat industry is the most successful in the New England States and has also
seen significant growth over the last several years. The number of milk goats in Vermont nearly
quadrupled from 1997 to 2017, and sheep and goat milk sales increased 24% from 2012 to 2017.
Sheep and goat milk sales in Vermont were valued at $4.2 million in 2017. The state's industry is
also seeing a considerable opportunity for growth. Vermont Creamery, a nationally renowned cheese
company, is unable to meet its need for goat milk and must source additional milk from Canada. The
company hopes to establish ten new Vermont goat dairies at 400 goats each over the next five years,
increasing the state's milk goat industry by 50% (KarenKarp & Partners, 2020).
The U.S. sheep dairy industry is less developed than the goat dairy industry in the country. The U.S.
had almost no dairy sheep until the early 1990s (Fletcher, 2016). Today, the U.S. dairy sheep
industry remains small, despite the high demand for sheep-milk cheeses (Pulina et al., 2018). U.S.
sheep milk production is estimated at approximately 9.4 million pounds, or almost two million pounds
of domestic cheese. The U.S. imports between 28 to 38 times more cheese than it produces,
suggesting considerable room for market growth within the country (Brown, 2017). There are already
signs of growth. From 2010 to 2016, the number of entries made from sheep's milk in the American
Cheese Society competition grew by 40% (Fletcher, 2016).
Global Consumption
Goat milk is the number one consumed milk globally, with an estimated 65% of the world population
consuming goat milk (Berry, 2018). The majority of goat milk is consumed in India, Bangladesh,
Pakistan, and Turkey, where milk is used for home consumption and kept by small-scale producers.
Goat milk is also an important food source in the Mediterranean, Middle East, Eastern Europe, and
parts of South America (Miller and Lu, 2019). There is little data available on sheep milk consumption
rates for specific regions. However, based on production locations, we can infer that much of the
world's sheep milk is consumed in Asia and Europe (Pulina et al., 2018).
U.S. Consumption
The U.S. loves dairy, which currently accounts for 15% of fresh food sales, 16% of packaged food
sales, and 15% of organic food sales. The Milk Processor Education Program manages large milk
campaigns that help maintain the demand for dairy products in the country (Canterbury Development
Corporation, 2017). Although cow milk remains dominant in the U.S., the consumption of goat and
sheep milk products is growing. North America is considered the second largest market for goat
dairy products in the world, with the U.S. leading the market in the region (Research and Markets,
2020). The U.S. also is a leader in the world market for sheep cheese imports, accounting for 41%

Sheep and Goat Dairy Market Conditions and Consumer Research 26
of the total amount of sheep cheese imports globally, or an estimated 53 to 73 million pounds of
sheep cheese (Brown, 2017, FAOSTAT, 2018).
Key Market Players
Goat Milk Industry
Key players in the market as identified by Allied Market Research in their Global Goat Milk Market
Research Report include a variety of companies within two broad categories: 1) large-scale
manufacturers and distributors specializing in global trade and market development (food and
beverage companies; and 2) top supplying multi-generational family farms that sell goat milk and
other goat dairy products (Kadam et al., 2019). Top goat milk food and beverage companies are
described in Table 5, while the top supplying farms are described in Table 6.
Table 5. Top Goat Milk Food and Beverage Companies
Company
Location
Ausnutria Dairy Corporation Ltd.
China
AVH Dairy Trade B.V.
Netherlands
Goat Partners International
U.S.
Granarolo S.p.A.
Italy
Stickney Hill Dairy Inc.
U.S.
Baiyue Dairy Group
China
Xi'an Baiyue Goat Dairy Group Co.Ltd.
China
FIT Company in France
France
Holle baby food A.G.
Switzerland
Yayi International
China
Table 6. Top Goat Milk Supplying Farms
Company
Location
Meyenberg Goat Milk
China
Redwood Hill Farm & Creamery
U.S.
St Helen's Farm
U.K.
Woolwich Goat Dairy Inc
Canada
Hay Dairies Pte Ltd.
Singapore
The Good Goat Milk Co.
New Zealand
Summerhill Goat Dairy
U.K.
Cherry Glen Goat Cheese Co.
U.S.
Delamere Dairy
U.K.
Sheep Milk Industry
The key players in the market as identified by MarketWatch in their Global Sheep Milk Market
Research Report include a variety of companies within two broad categories: 1) large-scale
manufacturers and distributors specializing in global trade and market development (food and
beverage companies); and 2) top supplying multi-generational family farms that sell goat milk and
other goat dairy products (MarketWatch, 2020). Top goat milk food and beverage companies are
described in Table 7, while the top supplying farms are described in Table 8.
Table 7. Top Sheep Milk Food and Beverage Companies
Company
Location
New Zealand Sheep Milk Company
New Zealand
Spring Sheep
New Zealand
Alimenta s.r.l.
Italy

Sheep and Goat Dairy Market Conditions and Consumer Research 27
Table 8. Top Sheep Milk Supplying Farms
Company
Location
Velvet Cloud
Ireland
Origin Earth Ltd.
New Zealand
The Sheep Milk Company Ltd.
U.K.
Haverton Hill Creamery
U.S.
Roquefort Vernieres
France
The Good Goat Milk Co.
New Zealand
Summerhill Goat Dairy
U.K.
Cherry Glen Goat Cheese Co.
U.S.
Delamere Dairy
U.K.
Dairy Goat Co-operation
New Zeland
Industry Product Segments
The product segments are similar for the goat and sheep dairy markets; however, there are more
segments for sheep dairy than goat dairy, while goat dairy consists of more sub-segments. These
are described in Table 9.
Table 9. Goat and Sheep Dairy Product Segments
Goat Dairy Product Segments and Subsegments
(Arizton Advisory and Intelligence)
Sheep Dairy Product Segments (MarketWatch)
- Packaged Milk
o Skim
o Whole
o UHT
o Other
- Milk Powder
o Skim
o Whole
- Cheese
o Chevre
o Mozzarella
o Cheddar
o Feta
o Others
- Other
- Fluid milk
- Milk powder
- Cheese
- Butter
- Yogurt
- Ice Cream
- Other
Trade Flows and Anticipated Growth
Goat Milk
The majority of goat milk produced in the world is used for direct consumption, although global
markets for goat milk are rapidly developing. The goat milk market in the Asia-Pacific region is
projected to grow at the fastest compound annual growth rate between 2020 and 2025. North
America is predicted to experience the highest incremental growth. Rapidly growing markets in
Brazil, Argentina, Peru, India, and Turkey are all expected to improve overall market growth
(Research and Markets, 2020). Goat milk markets are driven by different products based on the
region. In France, Greece, Italy, and Spain (FGIS), most goat milk is used for cheese production,
although the consumption of whole milk and yogurt is also common. Goat milk is considered a part
of the historical "Mediterranean Diet" and is culturally significant in the area. Data on the international

Sheep and Goat Dairy Market Conditions and Consumer Research 28
trade of goat cheese is not available, but it is significant to note that almost 50% of Protected
Designation of Origin (PDO) goat cheeses are produced in Spain and exported worldwide (Pulina et
al., 2018). France is also often associated with high-quality goat cheese, although Italy and the
United States both produce it. In fact, goat cheese is recognized as the most popular goat milk
product in the North American market. In 2019, fresh goat cheese contributed approximately 38% to
the global milk market revenue (Research and Markets, 2020).
In China, goat milk is used to make milk powder (Pulina et al., 2018), which, along with goat whey,
is used to manufacture baby formulas (Miller and Lu, 2019). Most of China's goat whey is imported
from Italy and the Netherlands (Li, 2019). The use of goat milk powder in infant nutritional formulas
is driving the expansion of the dairy goat industry in China, which has seen significant growth,
especially in Shaanxi, Shandong, and Henan provinces (Miller and Lu, 2019).
Sheep Milk
The majority of sheep milk produced in the world is processed into cheese (Ospanov, 2020). In 2013,
global exports of sheep-milk cheese valued at approximately $374 million. FGIS process more than
90% of their sheep milk as cheese and much of the rest as yogurt. FGIS sheep milk production is
characterized by specialized dairy breeds, large commercial processing plants, and advanced
technology. These characteristics help support the market for PDO sheep-milk cheeses recognized
by the European Union. PDO sheep-milk cheeses are significant to the international cheese trade
and have a growing international market (Pulina et al., 2018). Italy is the leader in sheep-milk cheese
exports, holding 36% of the market share, followed by France (20%) (FAOSTAT, 2018).
The United States and Germany are the leading importers of sheep-milk cheese, accounting for 42%
and 41%, respectively, of all sheep cheese imports (FAOSTAT, 2018). The majority of cheeses
imported by the United States and labeled as PDO sheep cheese come from Italy, but significant
imports also come from Spain, Greece, France, and Bulgaria (USDA-FAS, 2016).
Although little data is available on Chinese sheep dairy production, the sheep milk industry is growing
in the country, likely driven by the use of sheep milk in infant formulas. Otherwise, sheep milk in
China is primarily used for home consumption and the production of organic milk. China works with
New Zealand companies to produce infant formulas (Pulina et al., 2018).

Sheep and Goat Dairy Market Conditions and Consumer Research 29
Current Market Conditions
Global Market Conditions
The global goat milk market size was valued at $8.5 billion in 2018 and is expected to reach $11.4
billion by 2026, growing at a compound annual growth rate (CAGR) of 3.8% from 2019 to 2026.
Today, the majority of goat milk produced globally is used for direct consumption. The remaining
milk is used for cheese production, followed by milk powder and other products. Allied Market
Research predicts the milk powder segment will exhibit the highest CAGR of 7.4% during the
forecasted time period between 2019 and 2026 (Figure 13) (Kadam et al., 2019).
Figure 13. Global goat milk market growth by product from Allied Market Research's Global Goat Milk Market
Research Report. From Kadam et al. 2019.
The anticipated growth in the goat milk powder market segment is likely due to the increased use of
goat milk in infant formulas (Research and Markets, 2020). Goat milk is easy for infants to digest
and has similar nutritional properties to human milk (Kadam et al., 2019). Sheep milk is also being
increasingly used in infant formulas. For example, there is a high demand for sheep milk infant
formula in Taiwan (Canterbury Development Corporation, 2017).
In addition to milk powder, nutraceutical products containing goat and sheep milk are likely to do
increasingly well in the global market. The nutraceuticals market is expected to grow at a compound
rate of 7.3% for the next five years, achieving annual sales exceeding $279 billion (Canterbury
Development Corporation, 2017). Goat and sheep milk are increasingly used in nutraceutical
products, which are expected to drive overall market growth (Kadam et al., 2019. Canterbury
Development Corporation, 2017).
Other trends driving growth in the global sheep and goat milk markets include:
- Population Growth and Emerging Economies: Population and economic growth drive the goat
milk market growth in Asia-Pacific (Kadam et al., 2019). Similarly, changing consumer
demographics drive region-based market growth. For example, Mexican, African, and Middle
Eastern immigrants who prefer goat milk drive demand in the U.S. (Miller and Lu, 2019).

Sheep and Goat Dairy Market Conditions and Consumer Research 30
- Government Subsidies: Government subsidies drive global market growth in the goat dairy
industry. India's government provides 25-30% subsidy on the total cost of goat farms and the
E.U. provides allowances for maintenance of goat farms (Kadam et al., 2019).
- Technological Development: The quality of goat and sheep dairy products, along with their
shelf lives, are improving because of technological innovations in dairy processing equipment.
Additionally, improvement in chillers and cold chain logistics for products like yogurt and fresh
milk have increased their availability, and in turn, boosted demand. Technological innovation
drives product freshness, essential to the growth of these dairy products (Research and
Markets, 2020).
- Convenience Trends: Consumers live busier lives than ever before, and in turn, are often
seeking out products for their convenience. Snack and single-serving options are among the
fastest-growing food and beverage market segments (Berry, 2018). This may result in fresh
products, like milk and yogurt, being preferred over milk powder in certain regions (Canterbury
Development Corporation, 2017).
- Health and Wellness: Across the globe, an increasing number of consumers are becoming
more health-conscious and are willing to pay a premium for products that provide health
benefits (Canterbury Development Corporation, 2017).
o Goat milk is a rich source of protein, calcium, fats, vitamins, and iron and has a low
cholesterol level. It has been shown to help improve platelet count for people
experiencing viral diseases such as Dengue fever. Additionally, the similarities
between goat milk and human milk make it a plentiful source of energy for infants
(Kadam et al., 2019).
o Sheep milk is also vitamin and nutrient-rich, with higher levels of the essential vitamins
A, D, E, and C compared to both goat and cow's milk.
Sheep milk has a higher protein
content and 50% more iron than both goat and cow milk (Canterbury Development
Corporation, 2017).
- Dairy Alternatives: The population of people with a lactose-intolerance is growing, driving
demand for cow milk alternatives, especially in Asian markets (PRNewswire, 2020). Both goat
and sheep milk have lower lactose levels than cow milk and are considered easier to digest
(Canterbury Development Corporation, 2017). Over 3% of children have a cow milk allergy,
which can cause digestive issues and skin problems (Reiley and Van Dam, 2019). Goat milk
is considered less allergenic than cow milk and as cow milk allergies increase, consumers will
seek dairy alternatives and drive market growth for goat milk (Berry, 2018).
- Storied Products: Consumers seek out storied products and drive significant market growth
in 'craft' industries, such as craft beer. Goat and sheep dairy products are expected to benefit
from this overall market trend (Canterbury Development Corporation, 2017).
U.S. Current Market Conditions
The U.S. market for goat and sheep dairy products is growing, driven by the many global trends
previously described. The obesity crisis in the U.S. is driving consumers to find healthier, lower-fat
products (Canterbury Development Corporation, 2017). Lactose-intolerance is becoming more
common, further driving the expansion of cow dairy alternatives (Research and Markets, 2020).
Cheeses produced with sheep and goat milk are particularly popular as cow dairy alternatives in the
U.S. (Berry, 2018). Goat cheese is the most popular product in the North American goat milk product

Sheep and Goat Dairy Market Conditions and Consumer Research 31
market (Miller and Lu, 2019. Research and Markets, 2020). This finding was demonstrated in our
consumer survey. Demand for specialty cheeses, including those made from sheep milk, is expected
to continue growing. (Canterbury Development Corporation, 2017). Additional trends driving growth
in the goat and sheep milk industries in the U.S. include changing population demographics, local
and organic food movements, innovative products, and baby food, as described below:
- Changing Population Demographics: U.S. demographics are changing rapidly, driving shifts
in the food and beverage industry. The Hispanic and Asian-American populations in the
country, who have high lactose-intolerance rates, are growing faster than the total U.S.
population (Canterbury Development Corporation, 2017). Immigrant populations from Mexico,
Asia, Africa, and the Middle East are growing, further increasing the demand for goat and
sheep milk products more common in those regions (Lu and Miller, 2019).
- Local and Organic Foods Movements: The organic dairy goat industry in the U.S. is growing
in conjunction with the increasing demand for organic products in the country. Additionally,
many goat farms in the U.S. are located near major metropolitan areas where affluent
consumers are seeking organic and local goods and are willing to pay a premium for those
products (Lu and Miller, 2019). Goat and sheep dairy producers that capitalize on growing
demand for local and organic foods may see significant growth in coming years.
- Innovative Products U.S. sheep and goat dairy products already receive recognition on the
global market for their quality. U.S. goat cheeses have received multiple gold medals at
international cheese competitions, which helps attract new consumers to the market (USDA,
2011). Producers are working to develop innovative products. For example, Vermont
Creamery in Vermont released three new goat cheese varieties that were created using on-
trend flavors such as honey, pepper jelly, and blueberry lemon and thyme. Other producers
are developing more convenient products. LaClare Family Creamery in Wisconsin has offers
sliced goat cheeses, while FrieslandCampina in New Jersey released goat cheese slices in
easy peel-and reseal packaging (Berry, 2018). Innovation within the U.S. market helps
producers succeed both within the country and on the global stage.
- Baby Foods: Goat and sheep milk are being used more commonly in infant formulas and baby
foods worldwide. In the U.S., the scarcity of paid maternity leave forces mothers to stop
breastfeeding early, creating a high demand for infant formulas in the country. Milk formula
sales are predicted to increase in the U.S. during the next five years, presenting an opportunity
for sheep and goat milk producers to expand into this growing domestic market (Canterbury
Development Corporation, 2017).
Global Trade and Service Gap Analysis
Despite significant market growth for both goat and sheep milk products, there remains challenges
and gaps in domestic and international trade potential. This section describes these difficulties as
they relate to corruption, international laws, logistics, and seasonality among others.
- Corruption: The appeal of international markets can be severely impacted by government
corruption due to the resulting operating and financial risks. For example, high corruption
levels in Vietnam are a significant factor in market potential compared to somewhere like
Singapore (Canterbury Development Corporation, 2017).
- International Laws: Varying food and beverage laws between countries may limit producers'
abilities to export to certain countries. In Taiwan, for example, sheep milk may exceed the
regulated trans-fat levels in the country because of its high-fat content. Additionally, local

Sheep and Goat Dairy Market Conditions and Consumer Research 32
competitors can work with their governments to impose non-trade/tariff barriers on offshore
companies. This is possible in Asian food and beverage markets and can significantly impact
distribution and import logistics (Canterbury Development Corporation, 2017).
- Logistics: Physically exporting raw milk presents logistical challenges and can limit possible
export destinations. The challenges associated with raw milk must be considered during both
processing and transportation. Countries requiring fresh milk over milk powder can make the
cost of exportation too high to be viable. In general, short life shelf products create market
and trade challenges. Developing air freight technology increases the viability of specific
markets, such as the transportation of fresh milk to value markets in Greater China
(Canterbury Development Corporation, 2017).
- Seasonality: Goats can only be milked seasonally, which can create a surplus of goat's milk
during the summer and a shortage in the winter. Trade and business models must be built to
support seasonal production fluctuations. Producers can work as a co-op or choose products
with different cycles and shelf lives (Reiley and Van Dam, 2019).
- Online Distribution: Online distribution is an increasingly important sales channel for goat and
sheep milk products, including both nutraceuticals and fresh products like ice cream, yogurt,
and fresh milk. Emphasis on online distribution is disrupting traditional exports and sale
processes to Asian markets like Singapore and Taiwan through increased competition and
higher product transparency. Producers looking to enter the online distribution market must
ensure that the quality of their product and relevant marketing meets the standards and needs
of the regional market they are looking to enter.
U.S. Market Challenges
U.S. sheep and goat milk producers face additional challenges to those described above to maximize
their market potential on a domestic and global scale.
- Limited Data: The U.S. does not have an accurate estimate of the country's total number of
dairy goats. The National Agricultural Statistics Service conducted the first-ever full-scale goat
survey in January 2005. Without data, it is difficult for producers to understand the current
market potential (Animal and Plant Health Inspection Service, 2004).
- Government Regulations: U.S. regulations for the production, processing, and marketing of
milk were originally designed for cow dairy, which created challenges for goat milk producers.
In 2006, "Guidelines for the Production and Regulation of Quality Dairy Goat Milk" were
published, creating a legal framework under which the U.S. goat dairy industry could develop.
In 2009, the minimum somatic cell count for "grade A" (highest quality) goat milk was
established, allowing producers to sell products that command the maximum price. The
implementation of universal standards is critical to expanding goat dairy products in the U.S.
and building consumer trust for product safety (Lu and Miller, 2019).
- Operation Costs: Recording and using production data to improve dairy goat management
distinguishes modern dairy goat farming from traditional methods. In the U.S., the Dairy Herd
Improvement Association (DHIA) manages milk testing and record keeping. The cost of using
the DHIA's services is prohibitive for some producers. Unlike many European countries, there
are no government subsidies or programs to offset the cost of milk testing for producers and
there is little government support for the U.S. goat dairy industry in general. Despite high
costs, the use of DHIA has increased from less than 1% in 2004 to 13% of U.S. dairy goat
herds in 2012 (Lu and Miller, 2019).

Sheep and Goat Dairy Market Conditions and Consumer Research 33
- Transportation Costs: Many small U.S. goat farms sell their milk locally because of high
transportation costs or process the milk into artisanal cheese or goat milk soap. Large goat
farms in the U.S. are found near goat milk processing plants to limit transportation costs (Lu
and Miller, 2019).
- An Immature Industry: The U.S. sheep and goat milk industries are significantly less mature
than the cow dairy industry. To improve the commercial viability and reach larger markets,
these industries need to improve their herd management, feeding techniques, artificial
insemination practices, and marketing practices (Lu and Miller, 2019).
- Lack of Research and Veterinarians: Due to the immaturity of the goat and sheep milk
industries, there is limited research to support market growth. Budget cuts closed North
America's only dairy-sheep research program, at the University of Wisconsin-Madison, in
2016 (Fletcher, 2016). Dairy goats' status as a minor use species in the U.S. limits the medical
support producers can receive for their herds. There are few animal scientists or veterinarians
in the U.S. trained to treat goats, and only 15 drugs labeled for goats, most of which cannot
be used on lactating animals (Boyer, 2012. Lu and Miller, 2019).
- High Prices: There are few sheep dairy breeds in the U.S., limiting sheep milk production.
Without sheep specialized for milk production, it is difficult for U.S. producers to compete with
European prices. Wisconsin sheep farmer Laurel Kieffer reported that "A distributor can import
manchego for maybe a third of what it costs us to produce," because of the advanced milk
production systems in Europe. European sheep-cheese producers commonly have lower land
and labor costs and benefit from the decades of breed research and improvement that come
with a mature industry (Fletcher, 2016). The high prices of U.S. sheep cheese limit domestic
sales to specialty stores rather than supermarkets and often cause consumers to choose
lower-priced options like goat cheese (Brown, 2017. Fletcher, 2016). The U.S. must invest in
industry development to make domestic sheep milk products more competitive in the global
market.
Opportunities for Growth
Small ruminant dairy farmers across the United States recognize the industry is undergoing
tremendous change, and the same holds true in Vermont, the state leading New England goat dairy
sales. Farms face multiple challenges related to lack of consumer knowledge, uncertain pricing, and
increasing regulation, as well as incentives to adopt new technology, develop new products, and
cultivate unique brands. The demand for goat and sheep dairy products has seen a steady rise,
which adds additional pressure on farms to evolve quickly to meet the needs of growing markets.
There are several marketing strategies and areas of opportunity the industry can focus on to help
farmers capture this market share.
- Health Benefits: As health awareness is rising, research continues to back the health claims
of goat and sheep milk, which producers can capitalize on to market their products.
o Consumer awareness of the importance of protein is growing and consumers are
increasingly willing to pay a premium for high-protein foods and beverages (Henchion
et al. 2017; Ismail et al. 2020). Producers should capitalize on this trend both in
production and marketing. Millennial consumers are likely to be particularly interested
in protein-rich products (Wunsch 2020b).
o Goat milk, compared to cow milk, has a greater composition of important amino acids,
calcium, phosphorous, potassium, magnesium, Vitamin A, and oligosaccharides with

Sheep and Goat Dairy Market Conditions and Consumer Research 34
beneficial prebiotic and anti-infection characteristics (Ranadheera et al. 2019).
o Sheep milk is high in fatty acids, immunoglobulins, proteins, hormones, vitamins and
minerals (Flis and Molik 2021; Mohapatra, Shinde, and Singh 2019).
o Goat and sheep milk products can be marketed as products with significant dietary
value to help capture a share of the growing market for wellness products. A recent
study of 7,500 consumers in six countries found that 79% of respondents believe
wellness is important. Better nutrition is a key component of wellness to consumers
(Callaghan et al. 2021).
o The composition of sheep and goat milk makes them effective competitors in the dairy
alternatives market, as these products are easier to digest and have lower allergenic
potential than cow dairy (Verruck, Dantas, and Prudencio 2019; Turkmen 2017;
Balthazar et al. 2017). The market for lactose-free products is the fastest growing
segment of the dairy industry, indicating considerable consumer demand for products
with minimal lactose (Dekker, Koenders, and Bruins 2019).
o To capitalize on this market, producers must tailor their marketing to ensure consumers
recognize and understand the composition differences between goat and sheep milk
and other dairy products.
- Value-added products: Value-added products can increase the value of goat milk. Research
suggests significant opportunities, such as infant formula, ice cream, yogurt, cheese, and
nutraceutical products. U.S. and Vermont producers can capitalize on this opportunity by
delivering niche, premium products to specific target consumer groups.
o For example, goat milk powder is a popular ingredient for infant formulas, the U.S.
market for which is expected to grow at a compound annual growth rate of 8.3%
between 2018 and 2026 (Fortune Business Insights 2019; FnF Research 2021).
o There are opportunities to develop nutraceutical and health products made from sheep
milk. Nutraceutical and health products are a growing market in which products can
command higher margins (Grand View Research 2020a; Teoh et al. 2021). To maintain
higher price margins on relevant products, producers should consider using natural
health or food stores for distribution. Consumers are likely to understand price
differentials between products in stores that are known for having higher prices. Whole
Foods Market prices, for example, have historically been 10-20% higher than other
traditional retailers (Maverick 2020).
- Local Food Movement: Local producers can capitalize on the "locavore" movement by selling
their goods through farmers' markets, CSAs, and co-ops. The movement encourages
consumers to purchase and consume food from local, small-scale producers to help build
social stability in communities (Miller and Lu, 2019). This could be effective in New England
states, based on their proximity to urban centers and affluent consumers.
o Local producers should collaborate with local chefs and restaurants to promote
products to consumers, given that the Food Service and Ingredients markets can be
difficult wholesale channels to enter (Canterbury Development Corporation, 2017).
o Producers should partner with local distributors or category managers when working
to expand to different markets. Local partnerships help ensure the success of products
in new markets (Laudicina, McCaffrey, and Peterson 2018)

Sheep and Goat Dairy Market Conditions and Consumer Research 35
- Consumer Education: The industry should invest in consumer education to help distinguish
sheep and goat milk from other dairy products. Additional consumer education is needed to
justify the price differentials between cow dairy and goat/sheep dairy. Education highlighting
the nutritional characteristics of goat and sheep milk products could be an effective strategy
(Martin-Collado et al. 2019; Paskaš et al. 2020).
Research indicates price can deter
consumers from purchasing goat milk products yet consumers are often willing to pay more
for food products with proven health benefits (Ali and Ali 2020; Wunsch 2020a).
- Product marketing: Marketing should promote the compositional differences that resonate
with relevant consumers and market segments.
○ In Western countries, education and marketing should focus on the higher protein
content in sheep and goat milk compared to cow milk. Protein is surging in popularity
amongst Western consumers; the global protein ingredient market was valued at $38.5
billion in 2020 (Ismail et al. 2020; Grand View Research 2021).
○ In Asian countries, the focus should be on ease of digestion and feasibility for lactose-
intolerant consumers because of the high rates of lactose intolerance in the region
(Grand View Research 2020b). Highlighting the differences in nutritional makeup
between goat and sheep milk and plant-based milk alternatives or traditional dairy
products is likely to be valuable in all foreign markets as global demand for healthier
food products grows (Nunes et al. 2020).
- Smaller Formats: Producers should consider using smaller formats for their products to satisfy
consumers of all demographics and limit the risk for people trying new products. For example,
millennials living on their own are unlikely to consume a liter of milk before it expires.
Additionally, consumers of all demographics are unlikely to purchase a large volume of a
product they have never tried before (Byron 2019; Devenyns 2019). This is supported by our
consumer survey, where respondents indicated desiring quart-sized products for sheep and
goat milk.
- Environmentally Friendly Products: Producers should take advantage of goat and sheep
milk's environmentally clean image by avoiding practices like intensive milking that damage
consumers' positive image of their products. Environmentally sustainable practices, including
free-range grazing, may increase the concentration of beneficial phenolic compounds and the
antioxidant capacity of goat milk, further increasing its value to consumers (Dos Santos et al.
2017; Machado et al. 2017; Ranadheera et al. 2012; 2013; Silveira et al. 2015). Consumers
are willing to spend more on products they perceive as “natural” or environmentally
sustainable (Migliore et al. 2018; Nguyen 2021).
- Distribution Channels: Producers should consider using online retail channels for their
products, which experienced rapid growth during the COVID-19 pandemic. Online grocery
sales grew 54% in 2020. eMarketer, a market research company, expects more than half
(51.3%) of the U.S. population to buy groceries online by 2023, with per buyer spending
exceeding $1000 a year (eMarketer 2021).
- Changing Markets: Producers should monitor emerging markets and trends impacting goat
and sheep dairy’s in-market viability. Rising incomes, population growth and free trade
agreements can enhance the attractiveness of different international markets (Canterbury
Development Corporation, 2017).

Sheep and Goat Dairy Market Conditions and Consumer Research 36
6. Data Dashboard
Atlantic created an interactive data dashboard that dairy industry stakeholders can use to explore
the data from the consumer preference survey. The dashboard is a web-based application hosted
by Atlantic. It is available using following link: https://www.atlanticcorporation.com/vt-goat-sheep-
dashboard.
The dashboard is easy to navigate and provides clear instructions as well as background information
about the survey data. Users can query granular information such as “How much more are females
in Massachusetts ages 35-44 years willing to pay for locally produced goat milk?” using dropdown
filters (Figure 14).
The landing page allows users to select the dairy product of interest: cheese, milk, or yogurt. A user
guide is provided instructing users how to select filters, reset filters, and to click on graphics to
explore more granular detail. Users can click on a section of a graph to select a subgroup of
respondents, and the data will then be filtered to that subgroup, changing all remaining graphs on
the page automatically. For example, if users select those who prefer cow cheese by clicking on the
cow portion of the pie chart (Figure 15), graphs showing packaging preferences will automatically
filter to show only the packaging preferences for those who prefer cow cheese (Figure 16).
Atlantic will be hosting a webinar and stakeholder meeting with the NE-DBIC on July 15, 2021 to
present findings of the research. We will present a demo of the dashboard and how to use it and will
hold a Q&A session.
Figure 14. Example figure from the Goat and Sheep Dairy Product Data Dashboard showing those willing
to pay more for locally produced milk based on the filters on the sidebar (females, ages 35-44, residing in
Massachusetts)

Sheep and Goat Dairy Market Conditions and Consumer Research 37
Figure 15. Cheese packaging preferences regardless of cheese type preference
Figure 16. Cheese packing preferences for respondents who prefer cow cheese
(the cow "slice" of the Cheese Type Preference” pie chart is selected)

Sheep and Goat Dairy Market Conditions and Consumer Research 38
Conclusion
This report provides detailed information from consumer, market, and stakeholder research that can
position Vermont and other New England sheep and goat dairy producers to better compete in
domestic and U.S. and international markets.
Through consumer research, we determined that sheep and goat cheese is the product most likely
to succeed in the U.S. market of the three products studied. Secondary market research supports
this claim, as do the sales of the respondents from our B2B survey as most were cheese producers.
Additional market research uncovered other value-added sheep and goat dairy products popular in
the global market, such as milk powder for use in infant formula, which is in high demand in Asian
markets. Nutraceuticals, or supplements derived from food, are also expected to do well in global
markets. These products made with sheep or goat milk can be marketed as high in vitamins, proteins,
and electrolytes.
Educating consumers on the benefits of the sheep and goat dairy should increase consumption and
demand for the products, especially as health awareness is rising. Goat and sheep dairy products
have many benefits. Goat milk has a greater composition of important amino acids, and other
vitamins and minerals and has beneficial probiotic and anti-infection characteristics, while sheep milk
is high in fatty acids, proteins, vitamins, and minerals. Goat milk is also proven to be easier to digest
than cow milk and can be marketed to compete with lactose-free or minimal-lactose products.
Consumer education should also improve awareness of the products. Our consumer research
showed that many respondents did not perceive goat or sheep dairy products to be available for
them for purchase in their usual retail channels. Providing opportunities for consumers to sample
products should also drive consumption. Consumers who sampled sheep and goat dairy products
purchased them from one-third to 60% of the time on average. Stores like Whole Foods, which offers
samples and has a customer base that is willing to pay premiums for healthy products, could be
profitable sales channels for goat and sheep dairy products.
In addition to highlighting the health benefits of sheep and goat dairy, in our B2B survey, we found
that the most successful marketing strategies were the use of social media, bright and colorful
packaging, and humorous advertisements. Emphasizing unique characteristics of the farms may be
helpful as well, especially for consumers that prioritize local food and environmental sustainability.
Regardless of these marketing strategy opportunities, sheep and goat dairy stakeholders insist they
need assistance from dairy associations and governmental agencies to help improve marketing
strategies and increase consumer awareness. The industry is less mature than cow dairy, and there
are fewer governmental resources available to producers, which makes operating costs higher and
leaves less funds for producers to craft creative and successful marketing strategies, purchase
advertisements, or invest in appealing packaging.
Local markets are commonly thought of as being the most profitable for sheep and goat dairy
products, as consumers are often willing to pay premiums for local products. This finding was
uncovered through our secondary market research and through the B2B interviews, yet consumer
research showed that consumers may not place much importance on the geographic origin of their
dairy products, or they prefer regional products. However, while fewer consumers are willing to pay
more for local dairy, those willing to pay premiums are willing to pay roughly 20% more for cheese
or yogurt and 30% more for milk over non-local sheep and goat dairy. The customer segment for
local products may be smaller, but it could lead to greater profit margins. The most appropriate retail
channels to capitalize on local food premiums are farmer’s markets and farm stands, specialty food

Sheep and Goat Dairy Market Conditions and Consumer Research 39
stores, and local food stores or cooperatives. Producers could also work with local chefs and
restaurants to break into wholesale markets.
Consumers ages 18-44 years as well as those who have children under 18 years in their households
spend the most on dairy and are more likely to consume sheep and goat dairy, more willing to pay
for local products, and are more familiar with the farm operations that produce their dairy products.
More research is needed to determine whether age or having children is the dominant characteristic
that drives these trends, as there is likely overlap between the two groups, but it is possible that both
characteristics are equally important. It may also be prudent to study whether there are differences
in dairy consumption as well as willingness to pay for local products across the subgroups within
urban vs. suburban vs. rural areas to best narrow the target populations for niche products such as
sheep and goat dairy. Multivariable regression analysis may uncover these results using the data
that has already been collected.
Our research will provide sheep and goat dairy producers with comprehensive and precise data that
can enable them improve marketing strategies, tailor production to products highest in demand, and
identify target markets for their products. Our market research tools may also spur additional
research in an industry where producers desperately need more resources and assistance in
promoting their products and educating consumers.

Sheep and Goat Dairy Market Conditions and Consumer Research 40
References Cited for Secondary Market Research
1. Ali, Tabassum, and Jabir Ali. 2020. “Factors Affecting the Consumers’ Willingness to Pay for
Health and Wellness Food Products.” Journal of Agriculture and Food Research 2
(December): 100076. https://doi.org/10.1016/j.jafr.2020.100076.
2. Animal and Plant Health Inspection Service. "U.S. Meat Goat Operations, United States
Department of Agriculture". 2004 [cited 2020 Dec 23]. Available from:
https://www.aphis.usda.gov/animal_health/nahms/goats/downloads/goat09/Goat09_is_Meat
GoatOps.pdf https://doi.org/10.3168/jds.S0022-0302(01)74655-3.
3. Atlantic Corporation, "Dairy Market Assessment and Planning System (DairyMAPS),"
Waterville, ME, 2020, https://www.atlanticcorporation.com/dairymaps-tool
4. Balthazar, C. F., T. C. Pimentel, L. L. Ferrão, C. N. Almada, A. Santillo, M. Albenzio, N.
Mollakhalili, et al. 2017. “Sheep Milk: Physicochemical Characteristics and Relevance for
Functional Food Development.” Comprehensive Reviews in Food Science and Food Safety
16 (2): 247–62. https://doi.org/10.1111/1541-4337.12250.
5. Boyer T. Lack of approved pharmaceutics restrains U.S. goat industry. National Institute for
Animal Agriculture Small Ruminant Committee Meeting; 2012 Mar 27; [cited 2020 Dec 23].
Available from: https://animalagriculture.org/Resources/Documents/Conf%20-
%20Symp/Conferences/2012%20Annual%20Conference/Speaker%20Presentations/Tom%
20Boyer.pdf.
6. Brown, Sarah. The Prairie. "Domestic Sheep Milk Production for Cheese Gets Attention."
Twin Falls Times-News, https://magicvalley.com/business/agriculture/domestic-sheep-milk-
production-for-cheese-gets-attention/article_ee97b61d-bfae-5162-9e40-
8334aa87e8e5.html. Accessed 23 Dec. 2020.
7. Callaghan, Shaun, Martin Losch, Anna Pione, and Warren Teichner. 2021. “The Future of
the $1.5 Trillion Wellness Market.” McKinsey & Company.
https://www.mckinsey.com/industries/consumer-packaged-goods/our-insights/feeling-good-
the-future-of-the-1-5-trillion-wellness-market.
8. Canterbury Development Corporation, Sheep Milk Market Assessment, KPMG, April 2017.
9. D. Berry, New Goat Cheese Forms and Flavors to Increase Consumption in U.S., Farm
Business News, June 12, 2018
10. Dekker, Peter J. T., Damiet Koenders, and Maaike J. Bruins. 2019. “Lactose-Free Dairy
Products: Market Developments, Production, Nutrition and Health Benefits.” Nutrients 11
(3): 551. https://doi.org/10.3390/nu11030551.
11. Devenyns, Jessi. 2019. “Food Companies Shrink Portions to Target Solo Consumers.” Food
Dive. June 7, 2019. https://www.fooddive.com/news/food-companies-shrink-portions-to-
target-solo-consumers/556085/.
12. Elischer, Melissa. "Dairy Animals around the World: Sheep." MSU Extension. 12 December
2017. Available from:
https://www.canr.msu.edu/news/dairy_animals_around_the_world_sheep. Accessed 16
Dec. 2020.

Sheep and Goat Dairy Market Conditions and Consumer Research 41
13. eMarketer. 2021. “In 2021, Online Grocery Sales Will Surpass $100 Billion.” Insider
Intelligence. February 24, 2021. https://www.emarketer.com/content/2021-online-grocery-
sales-will-surpass-100-billion.
14. Flis, Zuzanna, and Edyta Molik. 2021. “Importance of Bioactive Substances in Sheep’s Milk
in Human Health.” International Journal of Molecular Sciences 22 (9): 4364.
https://doi.org/10.3390/ijms22094364.
15. FAOSTAT (Food and Agriculture Organization of the United Nations) Statistics database
(2018) http://www.fao.org/faostat/en/#data, Accessed 16th Dec 2020
16. Food and Agriculture Organization of the United Nations (FAO) Food and Agriculture
Organization of the United Nations statistical databases. 2019 [cited 2020 Dec 16].
Available from: http://faostat.fao.org/
17. FnF Research. 2021. “Global Goat Milk Powder Market Size Will Reach USD 6.03 Billion By
2026.” GlobeNewswire News Room. February 16, 2021.
https://www.globenewswire.com/news-release/2021/02/16/2176037/0/en/Global-Goat-Milk-
Powder-Market-Size-Will-Reach-USD-6-03-Billion-By-2026-Facts-Factors.html.
18. Fortune Business Insights. 2019. “Infant Formula Market Size to Reach USD 103.75 Billion
by 2026.” October 2, 2019. https://www.prnewswire.com/news-releases/infant-formula-
market-size-to-reach-usd-103-75-billion-by-2026--fortune-business-insights-
300929520.html.
19. F.X. Milani, W.L. Wendorff, Goat and sheep milk products in the United States (USA), Small
Ruminant Research, Volume 101, Issues 1–3, 2011, Pages 134-139, ISSN 0921-4488,
https://doi.org/10.1016/j.smallrumres.2011.09.033.
(http://www.sciencedirect.com/science/article/pii/S0921448811003828
20. Grand View Research. 2020a. “Global Nutraceutical Market Growth Analysis Report, 2020-
2027.” Grand View Research, Inc. https://www.grandviewresearch.com/industry-
analysis/nutraceuticals-market.
21. Grand View Research. 2020b. “Global Lactase Market Size: Industry Report, 2020-2027.”
GVR-4-68039-077-3. Grand View Research, Inc.
https://www.grandviewresearch.com/industry-analysis/lactase-market.
22. Grand View Research. 2021. “Global Protein Ingredients Market Size Report, 2021-2028.”
Grand View Research, Inc. https://www.grandviewresearch.com/industry-analysis/protein-
ingredients-market.
23. G. Pulina, M.J. Milán, M.P. Lavín, A. Theodoridis, E. Morin, J. Capote, D.L. Thomas, A.H.D.
Francesconi, G. Caja, Invited review: Current production trends, farm structures, and
economics of the dairy sheep and goat sectors, Journal of Dairy Science, Volume 101,
Issue 8, 2018, Pages 6715-6729, ISSN 0022-0302, https://doi.org/10.3168/jds.2017-14015.
24. Henchion, Maeve, Maria Hayes, Anne Maria Mullen, Mark Fenelon, and Brijesh Tiwari.
2017. “Future Protein Supply and Demand: Strategies and Factors Influencing a
Sustainable Equilibrium.” Foods 6 (7): 53. https://doi.org/10.3390/foods6070053.
25. Ismail, B Pam, Lasika Senaratne-Lenagala, Alicia Stube, and Ann Brackenridge. 2020.
“Protein Demand: Review of Plant and Animal Proteins Used in Alternative Protein Product
Development and Production.” Animal Frontiers 10 (4): 53–63.
https://doi.org/10.1093/af/vfaa040.

Sheep and Goat Dairy Market Conditions and Consumer Research 42
26. Kadam, A., Sangwai, V., and Deshmukh, R., Global Goat Milk Market: Opportunities and
Forecasts, 2019-2026, Allied Market Research, November 2019
27. KarenKarp & Partners. Vermont Dairy Marketing Assessment: Final Report. The Vermont
Agency of Commerce & Community Development and Agency of Agriculture, Food, &
Markets. February 24, 2020. Accessed from:
https://agriculture.vermont.gov/sites/agriculture/files/doc_library/KKP_VT%20Dairy%20Mark
eting%20Assessment0224.pdf
28. Laudicina, Paul, Courtney McCaffrey, and Erik Peterson. 2018. “Competing in an Age of
Multi-Localism.” A.T. Kearney. https://www.kearney.com/web/global-business-policy-
council/article?/a/competing-in-an-age-of-multi-localism.
29. Li L. Price of goat whey soars as Chinese milk powder makers seek new areas of growth.
Yicai Global. 2019 [cited 2019 Feb 16]. Available from:
https://www.yicaiglobal.com/news/china-goat-milk-price-nearly-doubles-puts-squeeze-on-
formula-processors.
30. Lu CD, Miller BA. Current status, challenges and prospects for dairy goat production in the
Americas. Asian-australasian Journal of Animal Sciences. 2019 Aug;32(8):1244-1255. DOI:
10.5713/ajas.19.0256.
31. MarketWatch. Global Sheep Milk Market 2020 Growth Analysis by Key Players, Globally
Effective Factors, Trends, Business Plans and Forecast to 2025.
https://www.marketwatch.com/press-release/global-sheep-milk-market-2020-growth-
analysis-by-key-players-globally-effective-factors-trends-business-plans-and-forecast-to-
2025-2020-11-25. Accessed 19 Dec. 2020.
32. Martin-Collado, D, C Díaz Martín, M Serrano, M J Carabaño, M Ramón, and R Zanoli. 2019.
“Sheep Dairy and Meat Products: From Urban Consumers’ Perspective to Industry
Innovations,” no. 123: 5.
33. Maverick, J.B. 2020. “How Expensive Is Whole Foods, Really?” Investopedia. December 31,
2020. https://www.investopedia.com/articles/markets/100715/how-expensive-whole-foods-
really.asp.
34. Migliore, Giuseppina, Massimiliano Borrello, Alessia Lombardi, and Giorgio Schifani. 2018.
“Consumers’ Willingness to Pay for Natural Food: Evidence from an Artefactual Field
Experiment.” Agricultural and Food Economics 6 (1): 21. https://doi.org/10.1186/s40100-
018-0117-1.
35. Miller, B. and Lu, C. Current Status of Global Dairy Goat Production: An Overview. Asian-
Australian Journal of Animal Sciences, July 1, 2019.
https://www.ncbi.nlm.nih.gov/pmc/articles/PMC6668863/
36. Mohapatra, Arpita, Ajay Kumar Shinde, and Raghvendar Singh. 2019. “Sheep Milk: A
Pertinent Functional Food.” Small Ruminant Research 181 (December): 6–11.
https://doi.org/10.1016/j.smallrumres.2019.10.002.
37. Ospanov A, Toxanbayeva B (2020) Switching to sheep's milk industry: problems and
prospective.Eurasia J Biosci 14: 1263-1271.
38. Nguyen, Hoang. 2021. “Global: Consumer Willingness to Pay for Environmentally Friendly
Products.” YouGov. April 29, 2021. https://yougov.co.uk/topics/food/articles-
reports/2021/04/29/global-willingness-pay-for-sustainability.

Sheep and Goat Dairy Market Conditions and Consumer Research 43
39. Nunes, Rubens, Vivian Lara Silva, Márcia Gabriela Consiglio-Kasemodel, Yana Jorge
Polizer, Maria Sylvia Macchione Saes, and Carmen Sílvia Fávaro-Trindade. 2020.
“Assessing Global Changing Food Patterns: A Country-Level Analysis on the Consumption
of Food Products with Health and Wellness Claims.” Journal of Cleaner Production 264
(August): 121613. https://doi.org/10.1016/j.jclepro.2020.121613.
40. Paskaš, Snežana, Jelena Miocinovic, Tijana Lopičić-Vasić, Izabela Mugoša, Marija Pajic,
and Zsolt Becskei. 2020. “Consumer Attitudes towards Goat Milk and Goat Milk Products in
Vojvodina Consumer Attitudes towards Goat Milk and Goat Milk Products in Vojvodina.”
Mljekarstvo / Dairy 70 (June): 171–83. https://doi.org/10.15567/mljekarstvo.2020.0304.
41. Ranadheera, C. S., C. A. Evans, S. K. Baines, Celso F. Balthazar, Adriano G. Cruz, Erick A.
Esmerino, Mônica Q. Freitas, et al. 2019. “Probiotics in Goat Milk Products: Delivery
Capacity and Ability to Improve Sensory Attributes.” Comprehensive Reviews in Food
Science and Food Safety 18 (4): 867–82. https://doi.org/10.1111/1541-4337.12447.
42. Reiley, Laura, and Andrew Van Dam. "America’s New Pastime? Milking Goats.” Washington
Post. www.washingtonpost.com,
https://www.washingtonpost.com/business/2019/04/23/americas-new-pastime-milking-
goats/. Accessed 16 Dec. 2020.
43. Research and Markets. The World Market for Goat Milk Products (2020-2025): Assessed by
Product, Distribution, Region and Vendor. Available from:
https://www.prnewswire.com/news-releases/the-world-market-for-goat-milk-products-2020-
2025-assessed-by-product-distribution-region-and-vendor-301071345.html. Accessed 19
Dec. 2020.
44. Teoh, Siew Li, Surachat Ngorsuraches, Nai Ming Lai, and Nathorn Chaiyakunapruk. 2021.
“Consumer Preferences and Willingness to Pay for Nutraceuticals: A Discrete Choice
Experiment.” Value in Health Regional Issues 24 (May): 167–72.
https://doi.org/10.1016/j.vhri.2020.09.003.
45. Turkmen, Nazli. 2017. “Chapter 35 - The Nutritional Value and Health Benefits of Goat Milk
Components.” In Nutrients in Dairy and Their Implications on Health and Disease, edited by
Ronald Ross Watson, Robert J. Collier, and Victor R. Preedy, 441–49. Academic Press.
https://doi.org/10.1016/B978-0-12-809762-5.00035-8.
46. USDA, Agricultural Census, 2017. https://www.nass.usda.gov/AgCensus/
47. USDA-FAS (Foreign Agricultural Service). Data and analysis (2016)
https://www.fas.usda.gov/data, Accessed 16th December 2020.
48. United States Department of Agriculture. Small-Scale U.S. Goat Operations. 2011 [cited
2020 Dec 22]. Available from:
https://www.aphis.usda.gov/animal_health/nahms/smallscale/downloads/Small-
scale_goat.pdf.
49. Verruck, Silvani, Adriana Dantas, and Elane Schwinden Prudencio. 2019. “Functionality of
the Components from Goat’s Milk, Recent Advances for Functional Dairy Products
Development and Its Implications on Human Health.” Journal of Functional Foods 52
(January): 243–57. https://doi.org/10.1016/j.jff.2018.11.017.

Sheep and Goat Dairy Market Conditions and Consumer Research 44
50. Wunsch, Nils. 2020a. “Healthy Snacks: Consumer Willingness to Pay More U.S. 2019.”
Statista. https://www.statista.com/statistics/1118744/healthy-snacks-willingness-to-pay-
more-by-category-us/.
51. Wunsch, Nils. 2020b. “Importance of Protein for Americans When Buying Groceries 2018.”
Statista. November 26, 2020. https://www.statista.com/statistics/875469/protein-importance-
grocery-shopping-us-generation/.

Sheep and Goat Dairy Market Conditions and Consumer Research 45
Appendix A. Survey Tool
Atlantic Goat and Sheep Dairy Market
Consumer Attitudes and Preferences Questionnaire (Web – Online
Panel)
(Fourth Draft – October 19, 2020)
QUOTA GROUPS:
Total:
n=600
Maine:
New Hampshire:
Vermont:
Massachusetts:
n=75
n=75
n=75
n=75
Rhode Island:
Connecticut:
New York:
New Jersey:
n=75
n=75
n=75
n=75
INTRODUCTION
Thank you for taking a few minutes out of your busy schedule to complete this questionnaire. It is about
your perceptions of various dairy products, regardless of whether you regularly purchase dairy products
or not. Your responses will remain strictly confidential. This survey is for research purposes only – we
will not try to sell you anything.
SCREENER
A. Which of the following categories describes your age? (Please select one response)
Under 18
01
(THANK AND TERMINATE)
18 to 24
02
25 to 34
03
35 to 44
04
45 to 54
55 to 64
05
06
(CONTINUE)
65 to 74
07
75 to 84
08
85 or older
09
Prefer not to answer
98
(THANK AND TERMINATE)
B. In which state is your primary residence located? (Please select one response)
IF MAINE, NEW HAMPSHIRE, VERMONT, MASSACHUSETTS, RHODE
ISLAND, CONNECTICUT, NEW YORK AND NEW JERSEY
(CHECK QUOTAS) CONTINUE, ELSE THANK AND TERMINATE

Sheep and Goat Dairy Market Conditions and Consumer Research 46
C. Would you say you are the primary food (grocery) shopper in your household or do you equally
share in the food shopping for your household? (Please select one response)
Primary
1
(CONTINUE)
Share
2
(CONTINUE)
No
3
(THANK AND TERMINATE)
D. Which of the following dairy products (Cow, Goat or Sheep) would you say your
household consumes at least once a month? (Please select all that apply) (RANDOMIZE
LIST)
Cheese 1
Milk 2
Yogurt 3
Butter 4
Cream 5
Ice cream 6
None at least once a month 9
MAIN QUESTIONNAIRE
1. What is your average monthly expenditure on all food from: (Please move slider to your response
for each below – best estimate is fine)
a. Food stores (e.g., national retailers and membership clubs, regional grocery stores/
supermarkets, cooperative grocery stores/local organic markets, convenience stores, farmer’s
markets, farm stands, and specialty food markets, etc.): (SLIDER ➔: $0 - $2,000+)
b. Mail order, subscription and other home delivery services: (SLIDER ➔: $0 - $2,000+)
c. Restaurants and prepared takeout: (SLIDER ➔: $0 - $2,000+)
IF “CHEESE,” “MILK,” AND/OR “YOGURT” CONTINUE ELSE, THANK AND
TERMINATE
ASK CHEESE, MILK AND YOGURT SECTIONS ONLY IF
MENTIONED IN QD RANDOMIZE CHEESE, MILK
AND YOGURT SECTIONS

Sheep and Goat Dairy Market Conditions and Consumer Research 47
Cheese (ASK THIS SECTION OF QUESTIONS IF “CHEESE” MENTIONED IN QD)
2. Approximately, how much do you spend on cheese (cow, goat, sheep, non-dairy, etc.) for yourself
and your household on average per month from the following retailers? (Please move slider to your
response for each below – best estimate is fine) (RANDOMIZE LIST)
a. National retailers and membership clubs
SLIDER ➔: $0 - $250+
b. Regional grocery stores/supermarkets
SLIDER ➔: $0 - $250+
c. Cooperative grocery stores/local organic markets
SLIDER ➔: $0 - $250+
d. Convenience stores
SLIDER ➔: $0 - $250+
e. Farmer’s markets/farm stands
SLIDER ➔: $0 - $250+
f. Specialty food markets
SLIDER ➔: $0 - $250+
g. Mail order and other home delivery
SLIDER ➔: $0 - $250+
3. Of your monthly cheese expenditure, approximately what percentage do you spend on the
following types of cheese? (Please enter your responses for each below – best estimate is fine)
a. Cow: %
b. Sheep: %
c. Goat: %
d. Others: %
Total: 100% (RUNNING TOTAL TO EQUAL 100%)
4. (IF Q3B = 0%) Have you ever tried sheep cheese? (Please select one response)
❑ Yes 1
❑ No 2
❑ Don’t know 9
5. (IF Q3C = 0%) Have you ever tried goat cheese? (Please select one response)
❑ Yes 1
❑ No 2
❑ Don’t know 9

Sheep and Goat Dairy Market Conditions and Consumer Research 48
6. (SHOW EACH REPORTED 1%+ IN Q3 OR “YES” IN Q4 OR Q5) Please rate the extent to
which you dislike or like these types of cheese. If you have not consumed the type of cheese in the
past five years, select, “NA.” (Please select one response for each type of cheese)
(RANDOMIZE LIST)
Types of Cheese
Dislike
Very Much
Like
Very Much
NA
Cow
1
2
3
4
5
6
7
8
9
10
90
Sheep
1
2
3
4
5
6
7
8
9
10
90
Goat
1
2
3
4
5
6
7
8
9
10
90
7. (SHOW EACH REPORTED 0% IN Q3) Are the following types of cheese available for you to
purchase?
(Please select one response for each type of cheese) (RANDOMIZE LIST)
Types of Cheese
Yes
No
Not Sure
Sheep
1
2
8
Goat
1
2
8
8. How much are you willing to pay for the following types of cheese compared to cow cheese? If
more or less, please indicate the percentage. (Please select a response) (RANDOMIZE LIST)
Types of Cheese
More
Same
Less
Percent
Sheep
1
2
3
SLIDER ➔: 0% - 100%
Goat
1
2
3
SLIDER ➔: 0% - 100%
9. How much are you willing to pay for the following types of cheese if they are produced locally or
northeast regionally compared to those produced in other areas of the U.S. or internationally? If
more or less, please indicate the percentage. (Please select one response for each – if
none/nothing, please select 0%) (RANDOMIZE LIST)
Types of Cheese
More
Same
Less
Percent
Cow
1
2
3
SLIDER ➔: 0% - 100%
Sheep
1
2
3
SLIDER ➔: 0% - 100%
Goat
1
2
3
SLIDER ➔: 0% - 100%
10. How much are you willing to pay for the following types of cheese if they are organically produced?
If more or less, please indicate the percentage. (Please select one response for each – if
none/nothing, please select 0%) (RANDOMIZE LIST)
Types of Cheese
More
Same
Less
Percent
Cow
1
2
3
SLIDER ➔: 0% - 100%
Sheep
1
2
3
SLIDER ➔: 0% - 100%
Goat
1
2
3
SLIDER ➔: 0% - 100%

Sheep and Goat Dairy Market Conditions and Consumer Research 49
11. When purchasing cheese products, what size package do you prefer? (Please select one response
for each) (RANDOMIZE LIST)
32 oz.
16 oz.
12 oz.
8 oz.
4 oz.
No
Preference
Don’t
Purchase
Cow
1
2
3
4
5
6
7
Sheep
1
2
3
4
5
6
7
Goat
1
2
3
4
5
6
7
12. When purchasing specialty cheese products, what type of packaging do you prefer? (Please select
one response for each) (RANDOMIZE LIST)
Clear
Plastic
Container
White
Plastic
Container
Paper
Wrap/
Wax
Sealed
Vacuum
Sealed
No
Preference
Don’t
Purchase
Cow
1
2
3
4
6
7
Sheep
1
2
3
4
6
7
Goat
1
2
3
4
6
7
13. Assuming everything else, such as quality and price, is equal, which of the following types of cheese
or cheese alternative do you prefer? (Please select one response) (RANDOMIZE 1-4)
❑ Cow 1
❑ Goat 2
❑ Sheep 3
❑ Plant-based 4
❑ No preference 8
14. How much detail would you like to know about where, geographically, the cheese products you
purchase are produced? (Please select one response) (DO NOT RANDOMIZE)
❑ No detail 1
❑ Country 2
❑ State/Province 3
❑ County 4
❑ City/Town 5
❑ Specific farm 6
❑ Doesn’t matter 7

Sheep and Goat Dairy Market Conditions and Consumer Research 50
15. In general, how unfamiliar or familiar are you with the dairy farms and businesses that produce the
cheese products you purchase? (Please select one response)
Very Unfamiliar
Very Familiar
1
2
3
4
5
6
7
8
9
10
16. Have you ever been in a retail setting where shoppers are sampling cheese? (Please select one
response)
❑ Yes 1
❑ No 2
17. Have you ever sampled cheese in a retail setting? (Please select one response)
❑ Yes
1
(CONTINUE)
❑ No
2
(SKIP TO Q19)
18. What percent of the time do you purchase cheese that you sampled? (Please select your response
below)
SLIDER ➔: 0% - 100%
19. What percent of the time do you look for a label to provide product information before purchasing
the following types of cheese? (Please select your response below)
Types of Cheese
Percent
Cow
SLIDER ➔: 0% - 100%
Sheep
SLIDER ➔: 0% - 100%
Goat
SLIDER ➔: 0% - 100%
20. What percent of the time do you look for a store sign to provide product information before
purchasing the following types of cheese? (Please select your response below)
Types of Cheese
Percent
Cow
SLIDER ➔: 0% - 100%
Sheep
SLIDER ➔: 0% - 100%
Goat
SLIDER ➔: 0% - 100%

Sheep and Goat Dairy Market Conditions and Consumer Research 51
Milk (ASK THIS SECTION OF QUESTIONS IF “MILK” MENTIONED IN QD)
21. Approximately, how much do you spend on milk (cow, goat, sheep, non-dairy, etc.) for yourself and
your household on average per month from the following retailers? (Please move slider to your
response for each below – best estimate is fine) (RANDOMIZE LIST)
a. National retailers and membership clubs
SLIDER ➔: $0 - $250+
b. Regional grocery stores/supermarkets
SLIDER ➔: $0 - $250+
c. Cooperative grocery stores/local organic markets
SLIDER ➔: $0 - $250+
d. Convenience stores
SLIDER ➔: $0 - $250+
e. Farmer’s markets/farm stands
SLIDER ➔: $0 - $250+
f. Specialty food markets
SLIDER ➔: $0 - $250+
g. Mail order and other home delivery
SLIDER ➔: $0 - $250+
22. Approximately what percentage of the average monthly amount you spend on milk for yourself
and your household is spent on the following types of milk? (Please enter your responses for each
below – best estimate is fine)
a. Cow: %
b. Sheep: %
c. Goat: %
d. Others: %
Total: 100% (RUNNING TOTAL TO EQUAL 100%)
23. (IF Q22B = 0%) Have you ever tried sheep milk? (Please select one response)
❑ Yes 1
❑ No 2
❑ Don’t know 9
24. (IF Q22C = 0%) Have you ever tried goat milk? (Please select one response)
❑ Yes 1
❑ No 2
❑ Don’t know 9

Sheep and Goat Dairy Market Conditions and Consumer Research 52
25. (SHOW EACH REPORTED 1%+ IN Q22 OR “YES” IN Q23 OR Q24) Please rate the extent to
which you dislike or like these types of milk. If you have not consumed the type of milk in the past
five years, select, “NA.” (Please select one response for each type of milk) (RANDOMIZE LIST)
Types of Milk
Dislike
Very Much
Like
Very Much
NA
Cow
1
2
3
4
5
6
7
8
9
10
90
Sheep
1
2
3
4
5
6
7
8
9
10
90
Goat
1
2
3
4
5
6
7
8
9
10
90
26. (SHOW EACH REPORTED 0% IN Q22) Are the following types of milk available for you to
purchase?
(Please select one response for each type of milk) (RANDOMIZE LIST)
Types of Milk
Yes
No
Not Sure
Sheep
1
2
8
Goat
1
2
8
27. How much are you willing to pay for the following types of milk compared to cow milk?
(Please select a response) (RANDOMIZE LIST)
Types of Milk
More
Same
Less
Percent
Sheep
1
2
3
SLIDER ➔: 0% - 100%
Goat
1
2
3
SLIDER ➔: 0% - 100%
28. How much are you willing to pay for the following types of milk if they are produced locally or
northeast regionally compared to those produced in other areas of the U.S.? If more or less, please
indicate the percentage. (Please select one response for each – if none/nothing, please select 0%)
(RANDOMIZE LIST)
Types of Milk
More
Same
Less
Percent
Cow
1
2
3
SLIDER ➔: 0% - 100%
Sheep
1
2
3
SLIDER ➔: 0% - 100%
Goat
1
2
3
SLIDER ➔: 0% - 100%
29. How much are you willing to pay for the following types of milk if they are organically produced?
If more or less, please indicate the percentage. (Please select one response for each – if
none/nothing, please select 0%) (RANDOMIZE LIST)
Types of Milk
More
Same
Less
Percent
Cow
1
2
3
SLIDER ➔: 0% - 100%
Sheep
1
2
3
SLIDER ➔: 0% - 100%
Goat
1
2
3
SLIDER ➔: 0% - 100%

Sheep and Goat Dairy Market Conditions and Consumer Research 53
30. When purchasing milk products, what size package do you prefer? (Please select one response for
each) (RANDOMIZE LIST)
Gallon
Half
Gallon
Quart
16 oz./
Pint
No
Preference
Don’t
Purchase
Cow
1
2
3
4
8
6
Sheep
1
2
3
4
8
6
Goat
1
2
3
4
8
6
31. When purchasing milk products, what type of packaging do you prefer? (Please select one
response for each) (RANDOMIZE LIST)
Clear
Plastic
Container
White
Plastic
Container
Carton
Glass
No
Preference
Don’t
Purchase
Cow
1
2
3
4
8
6
Sheep
1
2
3
4
8
6
Goat
1
2
3
4
8
6
32. When purchasing small batch or artisan milk products, what size package do you prefer?
(Please select one response for each) (RANDOMIZE LIST)
Gallon
Half
Gallon
Quart
16 oz./
Pint
No
Preference
Don’t
Purchase
Cow
1
2
3
4
8
6
Sheep
1
2
3
4
8
6
Goat
1
2
3
4
8
6
33. When purchasing small batch or artisan milk products, what type of packaging do you prefer?
(Please select one response for each) (RANDOMIZE LIST)
Clear
Plastic
Container
White
Plastic
Container
Carton
Glass
No
Preference
Don’t
Purchase
Cow
1
2
3
4
8
6
Sheep
1
2
3
4
8
6
Goat
1
2
3
4
8
6

Sheep and Goat Dairy Market Conditions and Consumer Research 54
34. Assuming everything else, such as quality and price, is equal, which of the following types of milk
or milk substitute do you prefer? (Please select one response) (RANDOMIZE 1-4)
❑ Cow 1
❑ Goat 2
❑ Sheep 3
❑ Plant-based (Almond, Soy, etc.) 4
❑ No preference 8
35. How much detail would you like to know about where, geographically, the milk products you
purchase are produced? (Please select one response) (DO NOT RANDOMIZE)
❑ No detail 1
❑ Country 2
❑ State/Province 3
❑ County 4
❑ City/Town 5
❑ Specific farm 6
❑ Doesn’t matter 7
36. In general, how unfamiliar or familiar are you with the dairy farms and businesses that produce the
milk products you purchase? (Please select one response)
Very Unfamiliar
Very Familiar
1
2
3
4
5
6
7
8
9
10
37. Have you ever been in a retail setting where shoppers are sampling goat or sheep milk? (Please
select one response)
❑ Yes 1
❑ No 2
38. Have you ever sampled goat or sheep milk in a retail setting? (Please select one response)
❑ Yes
1
(CONTINUE)
❑ No
2
(SKIP TO Q40)
IF Q22B OR Q22C IS GREATER THAN 0 OR Q23 = 1 OR Q24 = 1 CONTINUE, ELSE
SKIP TO Q40

Sheep and Goat Dairy Market Conditions and Consumer Research 55
39. What percent of the time do you purchase goat or sheep milk that you sampled? (Please select
your response below)
SLIDER ➔: 0% - 100%
40. What percent of the time do you look for a label to provide product information before purchasing
the following types of milk? (Please select your response below)
Types of Milk
Percent
Cow
SLIDER ➔: 0% - 100%
Sheep
SLIDER ➔: 0% - 100%
Goat
SLIDER ➔: 0% - 100%
41. What percent of the time do you look for a store sign to provide product information before
purchasing the following types of milk? (Please select your response below)
Types of Milk
Percent
Cow
SLIDER ➔: 0% - 100%
Sheep
SLIDER ➔: 0% - 100%
Goat
SLIDER ➔: 0% - 100%
Yogurt (ASK THIS SECTION OF QUESTIONS IF “YOGURT” MENTIONED IN QD)
42. Approximately, how much do you spend on yogurt (cow, goat, sheep, plant-based, etc.) for
yourself and your household on average per month from the following retailers? (Please move
slider to your response for each below – best estimate is fine) (RANDOMIZE LIST)
a. National retailers and membership clubs
SLIDER ➔: $0 - $250+
b. Regional grocery stores/supermarkets
SLIDER ➔: $0 - $250+
c. Cooperative grocery stores/local organic markets
SLIDER ➔: $0 - $250+
d. Convenience stores
SLIDER ➔: $0 - $250+
e. Farmer’s markets/farm stands
SLIDER ➔: $0 - $250+
f. Specialty food markets
SLIDER ➔: $0 - $250+
g. Mail order and other home delivery
SLIDER ➔: $0 - $250+

Sheep and Goat Dairy Market Conditions and Consumer Research 56
43. Approximately what percentage of the average monthly amount you spend on yogurt for yourself
and your household is spent on the following types of yogurt? (Please enter your responses for each
below – best estimate is fine)
a. Cow: %
b. Sheep: %
c. Goat: %
d. Others: %
Total: 100% (RUNNING TOTAL TO EQUAL 100%)
44. (IF Q43B = 0%) Have you ever tried sheep yogurt? (Please select one response)
❑ Yes 1
❑ No 2
❑ Don’t know 9
45. (IF Q43C = 0%) Have you ever tried goat yogurt? (Please select one response)
❑ Yes 1
❑ No 2
❑ Don’t know 9
46. (SHOW EACH REPORTED 1%+ IN Q43 OR “YES” IN Q44 OR Q45) Please rate the extent to
which you dislike or like these types of yogurt. If you have not consumed the type of yogurt in the
past five years, select, “NA.” (Please select one response for each type of yogurt) (RANDOMIZE
LIST)
Types of Yogurt
Dislike
Very Much
Like
Very Much
NA
Cow
1
2
3
4
5
6
7
8
9
10
90
Sheep
1
2
3
4
5
6
7
8
9
10
90
Goat
1
2
3
4
5
6
7
8
9
10
90

Sheep and Goat Dairy Market Conditions and Consumer Research 57
47. (SHOW EACH REPORTED 0% IN Q43) Are the following types of yogurt available for
you to purchase? (Please select one response for each type of yogurt) (RANDOMIZE
LIST)
Types of Yogurt
Yes
No
Not Sure
Sheep
1
2
8
Goat
1
2
8
48. How much are you willing to pay for the following types of yogurt compared to cow yogurt?
(Please select a response) (RANDOMIZE LIST)
Types of Yogurt
More
Same
Less
Percent
Sheep
1
2
3
SLIDER ➔: 0% - 100%
Goat
1
2
3
SLIDER ➔: 0% - 100%
49. How much are you willing to pay for the following types of yogurt if they are produced locally or
northeast regionally compared to those produced in other areas of the U.S.? If more or less, please
indicate the percentage. (Please select one response for each – if none/nothing, please select 0%)
(RANDOMIZE LIST)
Types of Yogurt
More
Same
Less
Percent
Cow
1
2
3
SLIDER ➔: 0% - 100%
Sheep
1
2
3
SLIDER ➔: 0% - 100%
Goat
1
2
3
SLIDER ➔: 0% - 100%
50. How much more are you willing to pay for the following types of yogurt if they are organically
produced? If more or less, please indicate the percentage. (Please select one response for each – if
none/nothing, please select 0%) (RANDOMIZE LIST)
Types of Yogurt
More
Same
Less
Percent
Cow
1
2
3
SLIDER ➔: 0% - 100%
Sheep
1
2
3
SLIDER ➔: 0% - 100%
Goat
1
2
3
SLIDER ➔: 0% - 100%
51. When purchasing yogurt products, what size package do you prefer? (Please select one response
for each) (RANDOMIZE LIST)
Quart
16 oz./
Pint
5oz. to 6oz.
Cup
No
Preference
Don’t
Purchase
Cow
1
2
3
8
6
Sheep
1
2
3
8
6
Goat
1
2
3
8
6

Sheep and Goat Dairy Market Conditions and Consumer Research 58
52. When purchasing specialty yogurt products, what type of package do you prefer? (Please select
one response for each) (RANDOMIZE LIST)
Clear
Glass
Container
White
Plastic
Container
Drinkable
Container
Squeeze
Tube
No
Preference
Don’t
Purchase
Cow
1
2
3
4
8
6
Sheep
1
2
3
4
8
6
Goat
1
2
3
4
8
6
53. Assuming everything else, such as quality and price, is equal, which of the following types of yogurt
do you prefer? (Please select one response) (RANDOMIZE 1-4)
❑ Cow 1
❑ Goat 2
❑ Sheep 3
❑ Plant-based (Almond, Soy, etc.) 4
❑ No preference 8
54. How much detail would you like to know about where, geographically, the yogurt products you
purchase are produced? (Please select one response) (DO NOT RANDOMIZE)
❑ No detail 1
❑ Country 2
❑ State/Province 3
❑ County 4
❑ City/Town 5
❑ Specific farm 6
❑ Doesn’t matter 7
55. In general, how unfamiliar or familiar are you with the dairy farms and businesses that produce the
yogurt products you purchase? (Please select one response)
Very Unfamiliar
Very Familiar
1
2
3
4
5
6
7
8
9
10
IF Q43B OR Q43C IS GREATER THAN 0 OR Q44 = 1 OR Q45 = 1 CONTINUE, ELSE
SKIP TO Q58

Sheep and Goat Dairy Market Conditions and Consumer Research 59
56. Have you ever been in a retail setting where shoppers are sampling goat or sheep yogurt? (Please
select one response)
❑ Yes 1
❑ No 2
57. Have you ever sampled goat or sheep yogurt in a retail setting? (Please select one response)
❑ Yes
1
(CONTINUE)
❑ No
2
(SKIP TO Q59)
58. What percent of the time do you purchase goat or sheep yogurt that you sampled? (Please select
your response below)
SLIDER ➔: 0% - 100%
59. What percent of the time do you look for a label to provide product information before purchasing
the following types of yogurt? (Please select your response below)
Types of Yogurt
Percent
Cow
SLIDER ➔: 0% - 100%
Sheep
SLIDER ➔: 0% - 100%
Goat
SLIDER ➔: 0% - 100%
60. What percent of the time do you look for a store sign to provide product information before
purchasing the following types of yogurt? (Please select your response below)
Types of Yogurt
Percent
Cow
SLIDER ➔: 0% - 100%
Sheep
SLIDER ➔: 0% - 100%
Goat
SLIDER ➔: 0% - 100%
CLASSIFICATION
61. The remaining questions are for classification purposes only and will not be used to identify you in
any way. What is the 5-digit zip code where your primary residence is located? (Please enter your
response below)
/ / / /

Sheep and Goat Dairy Market Conditions and Consumer Research 60
62. How would you characterize the setting of your primary residence? (Please select one
response)
❑ Urban 1
❑ Suburban 2
❑ Rural 3
❑ Prefer not to answer 8
63. What is your marital status? (Please select one response)
❑ Single, never married 1
❑ Married or Partnered 2
❑ Previously married 3
❑ Prefer not to answer 8
64. How many adults (18 years or older), including yourself, live in your household?
(Please select one response)
❑ 1 1
❑ 2 2
❑ 3 3
❑ 4 4
❑ 5 or more 5
❑ Prefer not to answer 8
65. How many children under the age of 18 live in your household? (Please select one
response)
❑ None 1
❑ 1 2
❑ 2 3
❑ 3 4
❑ 4 or more 5
❑ Prefer not to answer 8

Sheep and Goat Dairy Market Conditions and Consumer Research 61
66. For how many household members (adults and children), including yourself, do
you purchase groceries and/or meals? (Please select one response)
❑ 1 1
❑ 2 2
❑ 3 3
❑ 4 4
❑ 5 5
❑ 6 6
❑ 7 or more 7
❑ Prefer not to answer 8
67. What is your employment status? (Please select one response)
❑ Employed full-time (30 hours or more) 1
❑ Employed part-time (less than 30 hours) 2
❑ Unemployed 3
❑ Retired 4
❑ Stay at home parent 5
❑ Military 6
❑ Student 7
❑ Prefer not to answer 8
68. What is the highest level of education you have completed? (Please select one response)
Less than high school degree 1
High school degree 2
Some college 3
Two year college/technical degree 4
Four year college degree 5
Some Graduate work 6
Graduate degree (Masters, PhD, etc.) 7
Prefer not to answer 8

Sheep and Goat Dairy Market Conditions and Consumer Research 62
69. Into which of the following general categories does your 2019 household income before
taxes fall?
(Please select one response)
❑ Less than $15,000, 01
❑ $15,000 to less than $25,000, 02
❑ $25,000 to less than $35,000, 03
❑ $35,000 to less than $50,000, 04
❑ $50,000 to less than $75,000, 05
❑ $75,000 to less than $100,000, 06
❑ $100,000 to less than $150,000 07
❑ $150,000 to less than $200,000 08
❑ $200,000 or more 09
❑ Prefer not to answer 98
❑ Don’t know 99
70. With what race and/or ethnicity do you associate? (Please select one response)
(DROP DOWN MENU)
❑ American Indian or Alaska Native 01
❑ Asian 02
❑ Black or African American 03
❑ Hispanic or Latino 04
❑ Native Hawaiian or Other Pacific Islander 05
❑ White 06
❑ Two or more races/ethnicities 07
❑ Other (Please specify): <<OTHER SPECIFY – ACCEPT UP TO 100
CHARACTERS>>
❑ Prefer not to answer 98
71. Please select the gender with which you most closely associate. (Please select one
response)
❑ Female 1
❑ Male 2
❑ Gender neutral 3
❑ Prefer not to answer 8
Thank you very much for your time!

Sheep and Goat Dairy Market Conditions and Consumer Research 63
Appendix B. Consumer Preference Survey Methodology
Atlantic developed and implemented a consumer preference survey to assess domestic
demographics and insights on sheep and goat milk products across the following eight
Northeastern U.S. states: Maine, New Hampshire, Vermont, Massachusetts, Rhode
Island, Connecticut, New York and New Jersey. Our initial target was to collect 600
internet-based surveys distributed evenly, with at least 75 participants representing
each state. A random sample of n=600 generates a maximum sampling error or
confidence interval of +/- 4.0 percentage points at the 95% confidence level. That is,
for a reported 50% where variability is at its greatest, one can be 95% sure the results
for the entire population would fall between 46.0% and 54.0%. State-level data will be
most useful for state-to-state comparisons.
The survey was developed by Atlantic in conjunction with VAAFM and administered in
collaboration with the Portland Research Group. Panelists were engaged from a
national representative online panel using a broad range of sources, including active
recruitment. To ensure a representative sample, we screened the following criteria: 1)
adults ages 18 and older living on their own; 2) reasonable distribution of age, gender,
and household income; and 3) good representation of primary residence settings
(urban, suburban, rural). Panel managers closely assessed the responses provided
and the time it took panelists to complete surveys.
The survey consisted of an estimated 75 closed-ended questions, including screeners
(Appendix A). The survey included demographic adjustments to specifically engage a
representative sample of Millennial and older Gen Z participants (ages 18 to 38), which
previous research show have a high level of interest in goat and sheep milk products.
Specific objectives of the insights survey included:
• Identifying households’ consumption of dairy products in general;
• Determining dairy product purchase expenditures and types of retailers used
for dairy product purchases;
• Understanding preferences for different types of cow, sheep and goat dairy
products (cheese, milk, and yogurt)
• Gauging preferences for sheep and goat cheese, yogurt and milk packaging;
and
• Exploring at a high level sheep and goat cheese, yogurt and milk shopping
habits.
Data analysis was conducted by Atlantic and PRG using descriptive statistics such as
means and medians for continuous data and frequencies and percentages for
categorical variables. We used t-tests at the 95% level of confidence to determine
significant differences in key variables of interest across demographic subgroups.

Sheep and Goat Dairy Market Conditions and Consumer Research 64
Appendix C. Consumer Survey Tables
Table C1. Respondent Characteristics
Characteristic
N (%)
Age
18-44
171 (28.6%)
45-64
206 (34.5%)
65 or older
220 (36.9%)
Female
327 (54.8%)
Marital Status
Single
136 (22.8%)
Married
373 (62.5%)
Previously married
84 (14.1%)
Race
White
526 (88.1%)
Non-white
67 (11.2%)
Income
Less than $50k
185 (31.0%)
$50k – less than $100k
161 (27.0%)
More than $100k
194 (32.5%)
Prefer not to answer
53 (8.9%)
Education level
Less than high school degree
2 (0.3%)
High school
98 (16.4%)
Some college
164 (27.5%)
Bachelor’s degree
192 (32.2%)
Graduate degree
139 (23.3%)
Employment
Employed full-time
204 (34.2%)
Employed part-time
54 (9.0%)
Unemployed
92 (15.4%)
Retired
226 (37.9%)
Student
8 (1.3%)
Number of household members*
1
147 (24.6%)
2
279 (46.7%)
3+
165 (31.3%)
Presence of children in household
124 (20.8%)
Setting
Urban
134 (22.4%)
Suburban
289 (48.4%)
Rural
173 (29.0%)

Sheep and Goat Dairy Market Conditions and Consumer Research 65
For Tables C2-C7, each category is labeled A-H. Cells with a letter next to the result
indicate that the result is significantly higher than the column referenced at the 95%
confidence level.
Table C2. Average monthly spending on cheese by retail location and state.
ME
NH
VT
MA
RI
CT
NY
NJ
n=68
n=70
n=68
n=63
n=68
n=70
n=62
n=65
A
B
C
D
E
F
G
H
National Retailers and
Membership Clubs
$11.60
$14.70
$9.50
$21.80
$12.40
$14.60
$30.80
ABCDEF
$29.90
ACE
Regional Grocery
Stores/ Supermarkets
$30.10
$41.80
$28.70
$41.10
$29.90
$34.10
$54.20
ACEF
$46.20
C
Cooperative Grocery
Stores/ Local Organic
Markets
$9.70
$12.10
$6.80
$17.20
E
$5.20
$10.60
$28.70
ABCEF
$22.20
CE
Convenience Stores
$9.20
$6.10
$2.30
$23.60
BCE
$5.70
$10.40
C
$26.00
ABCEF
$23.20
BCE
Farmer’s Markets/ Farm
Stands
$10.20
C
$10.40
$1.60
$17.90
C
$5.50
$10.00
C
$25.20
ABCEF
$22.10
CE
Specialty Food Markets
$7.90
$8.50
$3.70
$18.00
CE
$5.80
$11.70
$29.90
ABCDEF
$27.70
ABCEF
Mail Order and Other
Home Delivery
$5.80
$9.30
$2.50
$18.70
ACE
$5.50
$8.00
$25.00
ABCEF
$22.90
ACE
Table C3. Average monthly spending on milk by retail location and state.
ME
NH
VT
MA
RI
CT
NY
NJ
n=63
n=62
n=65
n=63
n=71
n=71
n=61
n=66
A
B
C
D
E
F
G
H
National Retailers and
Membership Clubs
$11.90
$11.40
$10.90
$30.60
ABCEF
$13.80
$14.30
$36.50
ABCEF
$49.00
ABCEF
Regional Grocery
Stores/ Supermarkets
$36.70
$39.00
$28.70
$50.30
C
$32.40
$34.80
$52.10
CE
$55.10
CEF
Cooperative Grocery
Stores/ Local Organic
Markets
$11.90
$12.30
$5.60
$27.70
CF
$12.90
$12.00
$31.10
ABCEF
$37.20
ABCEF
Convenience Stores
$15.00
$12.50
$5.20
$32.50
ABCEF
$7.50
$10.80
$33.90
ABCEF
$41.30
ABCEF
Farmer’s Markets/ Farm
Stands
$10.50
$11.00
$3.80
$25.20
CE
$5.60
$10.20
$33.70
ABCEF
$37.70
ABCEF
Specialty Food Markets
$12.50
$10.80
$4.10
$25.90
CE
$7.20
$10.80
$33.50
ABCEF
$40.20
ABCEF
Mail Order and Other
Home Delivery
$9.20
$11.40
$4.20
$23.90
CE
$7.00
$13.10
$33.80
ABCEF
$38.80
ABCEF

Sheep and Goat Dairy Market Conditions and Consumer Research 66
Table C4. Average monthly spending on yogurt by retail location and state.
ME
NH
VT
MA
RI
CT
NY
NJ
n=53
n=46
n=52
n=54
n=52
n=57
n=46
n=39
A
B
C
D
E
F
G
H
National Retailers and
Membership Clubs
$12.40
$7.60
$4.40
$17.90
C
$11.60
$18.00
C
$30.10
BC
$34.70
ABCE
Regional Grocery
Stores/ Supermarkets
$39.80
$35.00
$28.90
$42.20
$33.60
$44.00
$62.10
BCE
$50.80
C
Cooperative Grocery
Stores/ Local Organic
Markets
$10.80
$6.10
$2.90
$13.90
C
$4.40
$16.70
C
$23.60
BCE
$33.60
ABCE
Convenience Stores
$9.30
$6.70
$5.60
$11.00
$3.70
$14.40
$19.50
E
$30.50
ABCE
Farmer’s Markets/ Farm
Stands
$6.90
$6.50
$2.80
$12.50
$2.80
$21.80
CE
$23.40
ACE
$34.40
ABCE
Specialty Food Markets
$7.00
$5.30
$2.50
$13.30
CE
$2.80
$13.90
$26.30
ABCE
$34.10
ABCE
Mail Order and Other
Home Delivery
$9.40
$7.90
$2.70
$13.60
C
$5.80
$11.60
$22.30
CE
$30.20
CE
Table C5. Average monthly spending on cheese by age, income, and presence of children in household
Age
Income
Presence of Kids
Retailer
18 to
44
45 to
64
65+
<$50K
$50K-
$100K
$100K+
Yes
No
n=144
n=185
n=205
n=168
n=147
n=173
n=103
n=430
A
B
C
D
E
F
G
H
National Retailers and
Membership Clubs
$35.80
BC
$13.30
$9.50
$14.40
$13.70
$26.40
DE
$44.60
H
$11.50
Regional Grocery
Stores/ Supermarkets
$54.00
BC
$32.50
$31.80
$41.30
$31.00
$42.80
E
$64.00
H
$31.90
Cooperative Grocery
Stores/ Local Organic
Markets
$34.60
BC
$7.80
$4.60
$13.80
$8.70
$19.70
E
$38.60
H
$7.90
Convenience Stores
$34.90
BC
$8.20
C
$1.80
$12.30
$8.30
$18.70
E
$42.70
H
$5.90
Farmer’s Markets/
Farm Stands
$34.00
BC
$7.80
C
$1.90
$10.00
$8.70
$19.80
DE
$44.10
H
$5.10
Specialty Food
Markets
$34.50
BC
$9.90
C
$2.90
$11.90
$8.30
$22.20
DE
$42.50
H
$7.00
Mail Order and Other
Home Delivery
$32.90
BC
$6.50
C
$2.10
$10.10
$7.30
$18.90
E
$40.70
H
$5.10

Sheep and Goat Dairy Market Conditions and Consumer Research 67
Table C6. Average monthly spending on milk by age, income, and presence of children in household
Age
Income
Presence of Kids
Retailer
18 to
44
45 to
64
65+
<$50K
$50K-
$100K
$100K+
Yes
No
n=150
n=186
n=186
n=164
n=139
n=168
n=112
n=409
A
B
C
D
E
F
G
H
National Retailers and
Membership Clubs
$45.10
BC
$17.00
C
$8.70
$17.00
$16.00
$34.00
DE
$58.80
H
$12.10
Regional Grocery
Stores/ Supermarkets
$64.30
BC
$35.70
$27.30
$42.00
E
$30.30
$51.60
E
$79.20
H
$30.50
Cooperative Grocery
Stores/ Local Organic
Markets
$47.30
BC
$10.90
$3.40
$16.30
$10.90
$30.30
E
$59.00
H
$7.70
Convenience Stores
$49.80
BC
$12.90
C
$1.80
$21.20
E
$11.20
$28.20
E
$62.00
H
$8.00
Farmer’s Markets/
Farm Stands
$45.40
BC
$9.40
C
$1.50
$13.80
$9.20
$29.60
DE
$58.30
H
$5.70
Specialty Food
Markets
$48.60
BC
$10.00
C
$0.90
$14.70
$11.10
$30.00
DE
$61.80
H
$5.90
Mail Order and Other
Home Delivery
$47.20
BC
$10.00
C
$0.90
$13.60
$10.90
$29.70
E
$59.00
H
$6.10
Table C7. Average monthly spending on yogurt by age, income, and presence of children in household
Age
Income
Presence of Kids
Retailer
18 to
44
45 to
64
65+
<$50K
$50K-
$100K
$100K+
Yes
No
n=117
n=138
n=144
n=120
n=113
n=133
n=88
n=310
A
B
C
D
E
F
G
H
National Retailers and
Membership Clubs
$34.60
BC
$9.50
$8.40
$12.70
$11.40
$24.40
DE
$40.80
H
$9.60
Regional Grocery
Stores/ Supermarkets
$60.10
BC
$33.40
$34.40
$39.20
$32.40
$52.70
E
$66.00
H
$34.80
Cooperative Grocery
Stores/ Local Organic
Markets
$35.50
BC
$6.80
C
$1.60
$16.00
$8.60
$16.90
$38.80
H
$6.20
Convenience Stores
$32.40
BC
$5.50
$1.60
$13.60
$7.50
$15.90
$37.50
H
$4.80
Farmer’s Markets/
Farm Stands
$34.60
BC
$6.30
$2.60
$12.40
$8.80
$19.40
$38.40
H
$6.20
Specialty Food
Markets
$32.10
BC
$5.50
$3.00
$11.00
$7.00
$19.50
E
$36.40
H
$5.60
Mail Order and Other
Home Delivery
$33.70
BC
$5.20
$1.80
$10.70
$9.00
$17.60
$38.70
H
$4.80

Sheep and Goat Dairy Market Conditions and Consumer Research 68
Appendix D. B2B Methodology
Atlantic built a contact database of goat and sheep dairy producers located in New
England, consisting of company name, location, contact name, phone number, and email.
Methods for selection included the membership list from two associations: Vermont
Sheep and Goat Association and the Vermont Cheese Guild. Additional candidates
outside of Vermont were found through direct query of various online search engines.
The survey instrument (available in Appendix A) was developed by Atlantic. It consisted
of 17 questions and was designed to be completed in less than 10 minutes through
informal phone interviews. Four of the survey questions were related to general
information (company name, experience, # of employees, etc.), six questions related to
product type and price points, and seven questions related to distribution. Other questions
asked for respondent opinion on the state of the industry and feedback for what might be
done to improve it.
The project team contacted 107 goat and sheep dairies via phone/email to participate in
the B2B survey. Potential participants were contacted a maximum of two times over four
weeks starting March 1, 2021 and concluding March 31, 2021. Survey participants were
contacted by phone and invited to participate. If they agreed, the survey was administered
over the phone. If they were unavailable, a call-back time was scheduled for a phone
survey or they were offered the option to complete the web-based survey, developed
using SurveyPlanet. Data was aggregated in SurveyPlanet and analyzed using Microsoft
Excel.

Sheep and Goat Dairy Market Conditions and Consumer Research 69
Appendix E. List of B2B Survey Respondents
Knotty Goat Soapery
Winterport, ME
(207) 223-5115
Abraham’s Goat Farm & Creamery
Newport, ME
(207) 368-2165
Sunset Acres Farm and Dairy
Brooksville, ME
(207) 326-4741
Four Hearts Farm Udderly Delicious
Creamery
Waterboro, ME
(207) 459-6607
Ten Apple Farm
Gray, ME
(207) 657-7880
Paradise Farm
Lyndeborough, NH
(603) 345-0860
Sunset Rock Farm
Lebanon, NH
(603) 448-3499
Purely Wholesome Farm
Loudon, NH
(603) 988-4109
Field O Dreams Farm
Amherst, NH
(603) 620-0166
Little White Goat Dairy
Orange, MA
(978) 790-1240
Barn First Creamery
Westfield, VT
(802) 744-6852
Blue Ledge Farm
Salisbury, VT
(802) 247-0095
Midnight Goat Farm
Huntington, VT
(802) 882-1952
Villa Villekulla Farm
Tunbridge, VT
(347) 276-7131
East Meets West Family Farm
Richford, VT
(802) 933-2998
Maggie's Farm at Mulberry Creek
Bowdoinham, ME
(812) 489-1349
Fat Sheep Farm
Windsor, VT
(802) 436-4696
Boston Post Dairy LLC
Enosburg Falls, VT
(802) 933-2749
Wooly Hill Farm
Bridport, VT
(802) 758-5083
Lazy Lady Farm
Westfield, VT
(802) 744-6325
Woodcock Farm Cheese Comp.
Weston, VT
(802) 824-6135

Sheep and Goat Dairy Market Conditions and Consumer Research 70
Tide Mill Creamery & Long Lost Farm
Dennysville, ME
(207) 271-6654
Sage Farm Goat Dairy
Stowe, VT
(802) 760-0943
Ice House Farm
Goshen, VT
(802) 247-1443
AlpineGlo Farm
Westminster, VT
(802) 463-2018
Fairy Tale Farm
Bridport, VT
(802) 758-680

Sheep and Goat Dairy Market Conditions and Consumer Research 71
Appendix F. B2B Survey Instrument
1. Which type(s) of milk do you produce: goat, sheep, and/or cow?
2. How long have you been processing dairy?
3. Which of the following (goat, sheep, and/or cow) dairy products do you
produce?
o Milk
o Cream
o Cheese
o Yogurt
o Butter
o Frozen dairy
4. What are your retail and wholesale price points for each product?
5. Including yourself, how many employees do you have?
6. What percentage more do you believe retail customers are willing to pay
for your local products vs non-local products?
7. Estimate the percentage of your sales to rural consumers vs urban
consumers.
8. Estimate the percentage of your income from the following sales channels:
o Retail/wholesale
o Farmer’s market
o Local grocery stores
o Institutions (colleges, hospitals, etc)
9. Do you use a distribution company to transport your products? If yes, what
is the name of your distribution company?
10. What types of stores or markets are you selling dairy products in?
o Own store
o Locally owned/natural artisan food store
o Regional grocery store
o Farmer’s market
o Other [Respondent writes-in response]
11. What is the farthest distance your product travels to a point of sale?
12. What are the ideal geographic markets you would like your products in?
o Local/Community
o In state
o Surrounding states
o Regionally
o Nationally
13. What factors do you believe are limiting your distribution?
14. Do you have any thoughts on what could improve your distribution
strategy?
15. Have you used any new or innovative approaches to
processing, packaging or sales? If yes, please describe.

Sheep and Goat Dairy Market Conditions and Consumer Research 72
16. On a scale of 1-7, 1 being extremely dissatisfied and 7 being extremely
satisfied, how satisfied are you with the current performance of your
business?
17. Is there any additional information you think the State of Vermont Agency
of Agriculture, Food, and Markets should know about producing goat and
sheep dairy products?

Sheep and Goat Dairy Market Conditions and Consumer Research 73
Appendix G. B2B Survey Tables
Table G1. Retail and Wholesale Price Points for Goat Milk Products*
Respondent
Product
Retail
Wholesale
Unit
1
Milk
$32.00
$32.00
Gallon
Cheese
$22.40
$22.40
Pound
Yogurt
$20.00
$20.00
Quart
Frozen Dairy
$20.00
$20.00
Quart
2
Milk
$11.00
$11.00
Gallon
Cheese
$9.50
$9.50
Pound
Yogurt
$11.00
$8.00
Quart
3
Milk
$20.00
NA
Gallon
Cheese
$30.00
NA
Pound
Yogurt
$7.00
NA
Quart
4
Milk
$20.00
NA
Gallon
Cheese
$18.67
$13.33
Pound
Yogurt
$12.00
$8.00
Quart
5
Milk
$20.00
NA
Gallon
Cheese
$28.50
$16.00
Pound
0Yogurt
$8.50
$6.00
Quart
6
Milk
$12.00
NA
Gallon
Cheese
$22.40
NA
Pound
7
Milk
$14.00
$10.50
Gallon
Cheese
$15.50
$13.00
Pound
8
Milk
$16.00
NA
Gallon
Cheese
$24.00
$14.50
Pound
9
Milk
NA
$20.00
Gallon
Cheese
$9.00
$7.00
Pound
10
Milk
$20.00
NA
Gallon
Cheese
$16.00
NA
Pound
11
Milk
$15.98
NA
Gallon
12
Milk
$17.00
NA
Gallon
13
Milk
$15.00
NA
Gallon
14
Cheese
$14.00
$10.00
Pound
15
Cheese
$10.50
$10.00
Pound
16
Cheese
$14.00
$11.00
Pound
17
Cheese
$21.95
$12.61
Pound
18
Cheese
$24.00
$14.50
Pound
19
Cheese
$25.00
$15.88
Pound
20
Cheese
$22.00
$11.00
Pound
21
Yogurt
$16.00
NA
Quart

Sheep and Goat Dairy Market Conditions and Consumer Research 74
Table G4. Challenges in Distribution
Table G2. Retail and Wholesale Price Points for Sheep Milk Products
Respondent
Product
Retail
Wholesale
Unit
1
Yogurt
$40.00
$26.00
Quart
Frozen Dairy
$18.00
$14.00
Quart
2
Yogurt
$50.00
NA
Quart
Table G3. Retail and Wholesale Price Points for Cow Milk Products
Respondent
Product
Retail
Wholesale
Unit
1
Milk
$10.00
NA
Gallon
Cream
$8.00
NA
Quart
Butter
$13.33
NA
Pound
Cheese
$16.00
NA
Pound
Yogurt
$7.00
NA
Quart
2
Cream
$12.00
NA
Quart
Butter
$16.00
NA
Pound
Cheese
$19.00
NA
Pound
Yogurt
$8.00
$5.30
Quart
3
Cheese
$15.20
$11.93
Pound
4
Cheese
$24.00
$14.00
Pound
Theme
Quotes
Scaling operations
• Plenty of demand, our current business model doesn't produce enough
to meet it.
• We work with distributors sometimes, but we are very small, so can't
always meet demand.
• Scale, still such a small farm so it's not economically viable to work with
a distribution company.
• Our supply is limited. Goats give much less milk than a cow.
Lack of infrastructure
• We need a more efficient delivery system.
• We are building as fast as we can, but we need more infrastructure.
• We are limited by infrastructure. We don't have a good delivery vehicle.
Other
• The actual distribution itself. Difficulty reaching stores without products
with the shipping companies we use.
• Regulations, not a licensed dairy farmer. Can only do direct off the farm
sales.
• Biggest challenge is balancing homeschooling children due to COVID-19
and working on the farm. The production is too low, and better
infrastructure.
• Environmental concerns regarding the shipment of food prevents us from
expanding our distribution.

Sheep and Goat Dairy Market Conditions and Consumer Research 75
Table G5. Potential Improvements to Distribution Strategies
Theme
Quotes
Marketing and Direct
Outreach
• Update and improve the website and advertising.
• Getting the word out, more marketing.
• More direct outreach. More marketing towards stores.
Improvements to
Infrastructure
• Use a better vehicle for distribution. Start shipping certain products such as
hard cheese. Set up ecommerce.
• Need access to capital
Other
• We are noticing some niche distributors who work almost exclusively with
small family farms and doing a great job.
• Nutritional label testing. Long process to get this certification which is
necessary to sell in many stores.
• Distributors would have to be willing to make less money! I think a coop
style distribution between local farmers willing to pitch in and rotate
deliveries and not make a profit would work.
• Food hubs, we supply our product and they distribute them to restaurants.
Table G6. Innovative Approaches in Processing, Packaging, or Sales
Theme
Quotes
Distribution
• We moved to a lot of direct online sales. We established a farm stand on the
farm.
• The pandemic created a huge market for online food sales, and we created a
gift basket of cheeses and local jams that did very well.
• Co-op where people can get dairy products from their farm and produce and
meat from other farms all at the same location.
• To work within the pandemic, we have had to partner with other farms and work
around many businesses closing down. We added non-dairy products.
Marketing
• Incorporated humor into Facebook advertisements.
• Offering samples.
• Utilizes social media for marketing, especially Instragram.
• For marketing to the public, the farm is composed mostly of rescue animals,
previous neglected or rejected goats, which is a big selling point for their
customers.
Packaging
• Using bright/colorful packaging that is environmentally friendly.
• Vacuum packing
• Moving to biodegradable packaging
Other
• We bought an automatic milking machine which has improved our efficiency.
Cut the time by more than half, and it's more hygienic.

Sheep and Goat Dairy Market Conditions and Consumer Research 76
Table G7. Feedback for VAAFM
Theme
Quotes
Need for
infrastructure and
challenge with
high costs
• It is very expensive to produce the product as equipment is not only expensive
to set up, when something breaks, as it always does, the parts & labor to repair
are very expensive. We are not able to get a high enough price on our cheese,
to cover the overhead and equipment used to make the cheese.
• Farmers who are practicing small scale, local, and regenerative agriculture
should not struggle they way they do. The more ethical you operate, it seems
the less you grow and the harder it is to survive. The current US farm system
rewards the corporate model and hurts the smaller operations. Lots of large
structural issues hurt goat and sheep farmers.
• Infrastructure is always high on the list of needs to achieve success.
Resources
• Grants should be easier for farmers to apply for infrastructure improvements.
• Dairy coalition of Maine focuses too heavily on cow milk, it would be nice to see
more resources and advertising directed towards the benefits of goat milk.
• Making sure that resources are available to small producers is very important.
Most of the grants/fundraising are directed towards people with larger
operations. It would be nice to see more assistance for smaller farmers.
• Start investing in small farms, they are important.
Room for growth
and the need for
consumer
awareness
• Goat’s and sheep’s mill products are in extremely high demand and there is lots
of room in the market for growth, especially in fluid milk.
• The goat dairy has the potential for greater growth and greater public
acceptance. There are many health benefits of raw goat milk and more people
should learn this. Farms need to relay this message more.
• The ignorance about sheep milk out there is great. We just need to have lots
and lots of sampling so people get to know how good it is!
Regulations
• It is difficult for a small operation to follow the same guidelines as large
corporations as costs become a major factor. For example, running a delvo
test on every batch of cheese is rather costly.
• Vermont's rules regarding dairy farming are much more pro-business than New
Hampshire's.
• Go easy on all the regulations. It is hurting small start ups.
Labor
• Labor is another factor, as minimum wage is rising in Vermont, this in turns
causes other wages increase accordingly. It is very expensive to do business in
Vermont. We are having to give yearly raises at a rate of 6-7% to keep up with
the rise in minimum wage and are not able to increase the price of the product
by that much as stores just cannot sustain these higher prices.
• It's very hard to find good employees, there is a labor shortage.
