
STUDYING OF TRAFFIC SIGNAL DESIGN AND
CALCULATION OF CYCLE INTERVAL AFTER
TRAFFIC SURVEYING OF A ROTARY
PROJECT REPORT SUBMITTED IN PARTIAL FULFILLMENT
OF THE DEGREE OF
BACHELOR OF TECHNOLOGY
IN
CIVIL ENGINEERING
NAME OF SUPERVISORS: PROF. DR. ASHOK KUMAR GUPTA
: MR. NIRAJ SINGH PARIHAR
NAME OF STUDENT: SHAHBAAZ SINGH MANN(101647)
MAY-2014
DEPARTMENT OF CIVIL ENGINEERING
JAYPEE UNIVERSITY OF INFORMATION
TECHNOLOGY,
WAKNAGHAT

TRAFFIC SIGNAL DESIGN
‘`
DEPARTMENT OF CIVIL ENGG | J.U.I.T
2
CERTIFICATE
This is to certify that project report entitled “Studying of Traffic signal design and Calculation of
cycle interval after Traffic surveying of a Rotary”, submitted by Shahbaaz Singh Mann (101647) in
partial fulfillment for the award of degree of Bachelor of Technology in Civil Engineering to Jaypee
University of Information Technology, Waknaghat, Solan has been carried out under my supervision.
This work has not been submitted partially or fully to any other University or Institute for the award
of this or any other degree or diploma.
Signature of Supervisor: Signature of Supervisor:
Name of Supervisor: Dr.Ashok Kumar Gupta Name of Supervisor: Mr. Niraj Singh Parihar
Designation: HOD(Civil), JUIT Designation: Associate professor, JUIT
Date: 15/05/2014 Date: 15/05/2014

TRAFFIC SIGNAL DESIGN
‘`
DEPARTMENT OF CIVIL ENGG | J.U.I.T
3
ACKNOWLEDGEMENT
We express our sincere gratitude to our respected project supervisors Prof. Dr. Ashok Kumar Gupta &
Mr.Niraj Singh Parihar, Department of Civil Engineering, Jaypee University of Information
Technology, Waknaghat under whose supervision and guidance this work has been carried out. His
whole hearted involvement, advice, support and constant encouragement throughout, have been
responsible for carrying out this project work with confidence. We are thankful to him for showing
confidence in us to take up this project. It was due to his planning and guidance that we were able to
complete this project in time.
We are sincerely grateful to Dr. Ashok Kumar Gupta, Professor and Head of Department of Civil
Engineering, Jaypee University of Information Technology, Waknaghat for providing all the
necessities for the successful completion of our project.
We would also like to thank the laboratory staff of Department of Civil Engineering for their timely
help and assistance.
Date: 15/05/2014
Shahbaaz Singh Mann(101647)
(Signature)

TRAFFIC SIGNAL DESIGN
‘`
DEPARTMENT OF CIVIL ENGG | J.U.I.T
4
ABSTRACT
Highways and the roads are like the veins of nation connecting all the parts of the country efficiently
to each other for transportation and forming a well connected network. Designing of the highways and
other related parts of the system plays a very pivotal role for swift movement of traffic. Proper traffic
surveys are to be conducted before designing any part of the highway or traffic signals for swift
movement of traffic on that route.
In this project I perform traffic surveys at a rotary measuring different parameters determining the
peak hour of traffic of the rotary and other traffic volume surveys determining the traffic flow at the
rotary. The data is then further used in designing of a traffic signal design on the rotary considering
different phases at a time and for efficient movement of traffic at that rotary. The project encompasses
the different parameters significant to be studied before designing a traffic signal. In this project I also
cover the different steps that might be taken for efficient movement of traffic across that rotary.

TRAFFIC SIGNAL DESIGN
‘`
DEPARTMENT OF CIVIL ENGG | J.U.I.T
5
List of figures
Figure 1
approaching road from sector 17 direction
Figure 2
approaching road from industrial end direction
Figure 3
approaching road from sector 17 direction
Figure 4
approaching road from industrial end direction
Figure 5
approaching road from sector 32 direction
Figure 6
approaching road from sector 26 direction
Figure 7
approaching road from sector 32 direction
Figure 8
approaching road from sector 26 direction
Figure 9
Google earth view of the rotary

TRAFFIC SIGNAL DESIGN
‘`
DEPARTMENT OF CIVIL ENGG | J.U.I.T
6
Table of Contents
CERTIFICATE…………………………………………………………………………...i
ABSTRACT…………………………………… ………………………………………..ii
ACKNOWLEDGEMENT………………………………………………………………..iii
LIST OF FIGURES………………………………..……………………………………..iv
Chapter-1 Introduction …………………………………………………6
1.1 Traffic signals
1.2 Types of traffic signal system
1.3 Definitions and notations
1.4 Phase design
1.5 Interval design
Chapter-2 Design Methods……………………………………………17
3.1 Trial cycle method
3.2 Approximate method
3.3 Webster method
3.4 Special design considerations
3.5 Control measures
3.6 Design as per IRC method
Chapter-3 Field Studies and general review………………………….. 24
Chapter-4 Results………………………………………………………. 28
4.1 signal design
Chapter-5 Conclusion and Recommendations………………………..32
Appendix………………………………………………………………….37
References…………………………………………………………………47

TRAFFIC SIGNAL DESIGN
‘`
DEPARTMENT OF CIVIL ENGG | J.U.I.T
7
INTRODUCTION
The conflicts arising from movements of traffic in different directions is solved by time sharing of
the principle. The advantage of traffic signal includes an orderly movement of traffic, an increased
capacity of the intersection and requires only simple geometric design. However the disadvantages of
the signalized intersection are it affects larger stopped delays and the design requires complex
considerations. Although the overall delay may be lesser than a rotary for a high volume, a user is
more concerned about the stopped delay.
TRAFFIC SIGNALS
An intersection where there is a large number of crossing and right turn traffic, there is possibility of
several accidents as there cannot be orderly movements. The earlier practice has been to control the
traffic by means of traffic police by showing stop signs alternately at the cross roads so that one of the
traffic streams may be allowed to move while the cross traffic is stopped. Thus, the crossing streams
of the traffic flow by time, segregation. Traffic signals are control devices which alternately direct the
traffic to stop and proceed at intersections using red and green light signals automatically. The main
requirements of a traffic signal are to draw attention, provide meaning and time to respond and to
have minimum waste of time.
ADVANTAGES OF TRAFFFIC SIGNALS
Properly designed signals have the following advantages:
They provide orderly movement of traffic and increase the traffic handling capacity of most of
the intersections at grade.
They reduce certain types of accidents, notably the right angled collisions.
Pedestrians can cross the roads safely at the signalized intersection.
The signals allow crossing of heavy traffic flow with safety.
When the signal system is properly co-ordinated, there is a reasonable speed on the major road
traffic.

TRAFFIC SIGNAL DESIGN
‘`
DEPARTMENT OF CIVIL ENGG | J.U.I.T
8
Signals provide a chance of crossing traffic of minor roads to cross the path of the continuous
flow of traffic streams at reasonable interval of time.
Automatic traffic signals may work out to be economical when compared to manual control.
The quality of traffic flow is improved by forming compact platoons of vehicles, provided all
the vehicles move at approximately the same speed.
DISADVANTAGES OF TRAFFIC SIGNALS
The rear end collisions may increase.
Improper design and location of signals may lead to violations of the control system.
Failure of the system due to electric power failure or any other defect may cause confusion to
the road users.
TYPE OF TRAFFIC SIGNALS
The signals are classified into following type
I. Traffic control signals
II. Pedestrian signals
III. Special traffic signals
The traffic control signals have three colored lights facing each direction of traffic flow. The red light
is meant for stop , the green light indicates go and amber or yellow light allows the clearance time for
the vehicles which enters intersection area by the end of green time , to clear off.
Fixed time signal or pre-timed signals are set to repeat regularly , a cycle of red , amber and green
lights. The timing of each phase of the cycle is pre-determined based on the traffic studies and they
are the simplest type of automatic traffic signals which are electrically operated. The main drawback
of the signal is that sometimes the traffic flow on one road may be almost nil and the traffic on the
cross road may be quite heavy.yet as the signal operates with fixed timings, the traffic in the heavy
stream will have to stop at red phase.
Traffic actuated signals are those in which timings of the phase and cycle are changed
according to traffic demand. In semi actuated traffic signals the normal clean phase of an approach

TRAFFIC SIGNAL DESIGN
‘`
DEPARTMENT OF CIVIL ENGG | J.U.I.T
9
may be extended up to a certain period of time for allowing a few more vehicles approaching closely,
to clear off the intersection with the help of detectors installed at the approaches.
In some cities in India the traffic police are assigned the duty to watch the traffic demand from
suitable observations point during the peak hours on various approaches and to vary the timings of the
phases and cycle according to the actual traffic demand.
When there are series of signals on the city road at each intersection with the cross road, the signal
system may be operated with only one controller. But it is desirable thet a vehicle moving along a
main road at normal speed should not have to stop at every signalised intersection till getting the “go”
signal. Hence there should be proper co-ordination of the signal system to provide a through band.
TYPE OF TRAFFIC SIGNAL SYSTEM
There are 4 general types of co-ordination of signals for road networks, as listed below:
Simultaneous system
Alternate system
Simple progressive system
Flexible progressive system
SIMULTANEOUS SYSTEM
In this system all signals along a road always show the same indications (red, green and yellow) at
same time. As the division of cycle is also same at all intersections, this system does not work
satisfactorily.
ALTERNATE SYSTEMS
In this system, alternate signals or groups of signals show opposite indications in a route at same
time. The system is also operated by a single controller, but by reversing the red green indicator
connections at successive signal systems. This system generally is considered more satisfactory than
simultaneous system.

TRAFFIC SIGNAL DESIGN
‘`
DEPARTMENT OF CIVIL ENGG | J.U.I.T
10
SIMPLE PROGRESSIVE SYSTEM
A time schedule is made to permit, as nearly as possible, a continuous operation of groups of
vehicle along the main road at reasonable speed. The signal phases controlling “Go” indications along
this road is scheduled to work at the predetermined time schedule. The phases and intervals at each
signal installation may be different; but signal unit works as fixed time signal, with equal signal cycle
length.
FLEXIBLE PROGRESSIVE SYSTEM
In this system it is possible to automatically vary the cycle length, cycle division and the same time
schedule at each signalized intersection with help of computer. This is most efficient system of all
four types described above.
Pedestrian Signal are meant to give right way to pedestrians to cross a road during the ‘walk
period’ when the vehicular traffic shall be stopped by red or stop signal on the traffic siganls of the
road.
Flashing Beacons are meant to warn the traffic. At flashing red signals, the drivers of vehicles
shall stop before entering the nearest cross walk at an intersection or at a stop line, when marked.
Flashing yellow signals are caution signals meant to signify that drivers may proceed with caution.
DEFINITIONS AND NOTATIONS
A number of definitions and notations need to be understood in signal design.They are discussed
below:
Cycle:A signal cycle is one complete rotation through all of the indications provided.
Cycle Length: Cycle length is the time in seconds that it takes a signal to complete one full cycle of
indications.It indicates the time interval between the starting of green for one approach till the next
time the green starts.It is denoted by C.
Interval:It indicates the change from one stage to another.There are two types of intervals-change
interval and clearance interval.Change interval is also called the yellow time and it indicates the

TRAFFIC SIGNAL DESIGN
‘`
DEPARTMENT OF CIVIL ENGG | J.U.I.T
11
interval between the green and red signal indications for an approach.Clearance interval indicates a
period during which all signal faces show red and is used for clearing off the vehicles in the
intersection.
Green Interval:It is the green indication for a particular movement or set of movements and is
denoted by G
i
.This is the actual duration during which the green light of a traffic signal is turned on.
Red Interval:It is the red indication for a particular movement or set of movements and is denoted by
R
i
.This is the actual duration during which the red light of a traffic signal is turned on.
Phase:A phase is the green interval plus the change and clearance intervals that follow it.Thus during
green interval,non conflicting movements are assigned into each phase.It allows a set of movements to
flow and safely halt the flow before the phase of another set of movements start.
Lost Time:It indicates the time during which the intersection is not effectively utilized from any
movement.For example,when the signal for an approach turns from red to green,the driver of the
vehicle which is in the front of the queue will take some time to perceive the signal(usually called as
reaction time)and some time will be lost here before he moves.
5
8
3
7
4
6
2
1. Four legged intersection

TRAFFIC SIGNAL DESIGN
‘`
DEPARTMENT OF CIVIL ENGG | J.U.I.T
12
PHASE DESIGN
The signal design procedure involves six major steps.This includes the(i)phase
design,(ii)determination of amber time and clearance time,(iii)determination of cycle
length,(iv)apportioning of green time,(v)pedestrian crossing requirements and (vi)the performance
evaluation of the above design.The objective of phase design is to separate the conflicting movements
in an intersection into various phases,so that movements in a phase should have no conflicts.If all the
movements are to be separated with no conflicts,then a large number of phases are required.In such a
situation,the objective is to design phases with minimum conflicts or with less severe conflicts.
There is no precise methodology for the design of phases.This is often guided by the geometry of
the intersection,flow pattern especially the tuning movements,the real magnitudes of flow.Therefore,a
trial and error procedure is adopted.However,phase design is very important because it affects the
further design steps.Further,it is easier to change the cycle time and green time when flow pattern
changes,where as a drastic change in the flow pattern may cause considerable confusion to the
drivers.To illustrate various phase plan options,consider a four legged intersection with through
traffic and right turns.Left turn is ignored.See figure 1.The first issue is to decide how many phases
are required.It is possible to have two,three,four or even more number of phases.
TWO PHASE SIGNALS
Two phase system is usually adopted if through traffic is significant compared to the turning
movements.For example in above figure non-conflicting through traffic 3 and 4 are grouped in a
single phase and non-conflicting through traffic 1 and 2 are grouped in the second phase.However,in
the first phase flow7 and 8 offer some conflicts and are called permitted right turns.Needless to say
that such phasing is possible only if the turning movements are relatively low.On the other hand,if
the turning movements are significant,then a four phase system is usually adopted.
8
2
6
3
4
5

TRAFFIC SIGNAL DESIGN
‘`
DEPARTMENT OF CIVIL ENGG | J.U.I.T
13
FOUR PHASE SIGNALS
There are atleast three possible phasing options.For example,figure above shows the most simple
and trivial phase plan where flow from each approach is put into a single phase avoiding all
conflicts.This type of phase plan is ideally suited in urban areas where the turning movements are
comparable with through movements and when through traffic and turning traffic need to share the
same lane.
Figure below shows a second possible phase plan option where opposing through traffic are put into
same phase.The non-conflicting right turn flows 7 and 8 are grouped into a third phase.Similarly,flows
5 and 6 are grouped intofourth phase.This type of phasing is very efficient when the intersection
geometry permits to have atleast one lane for each movement,and the through traffic volume is
significantly high.
There are five phase signals,six phase signals,etc.They are normally provided if the intersection
control is adaptive,that is,the signal phase and timing adapt to the real time traffic conditions.
8
3
4
7
P1
P2
7
2
5
6
P3 P4
1
One way of providing four phase
signals

TRAFFIC SIGNAL DESIGN
‘`
DEPARTMENT OF CIVIL ENGG | J.U.I.T
14
3
4 7
P1
P2
1
8
5
6
P3
P4
7
Second possible way of providing a four phase
signal
3
5
P1 6
4
P2
2 8
P3
P4
7
1
Third possible way of providing a four-phase
signal
TRAFFIC SIGNAL DESIGN
‘`
DEPARTMENT OF CIVIL ENGG | J.U.I.T
15
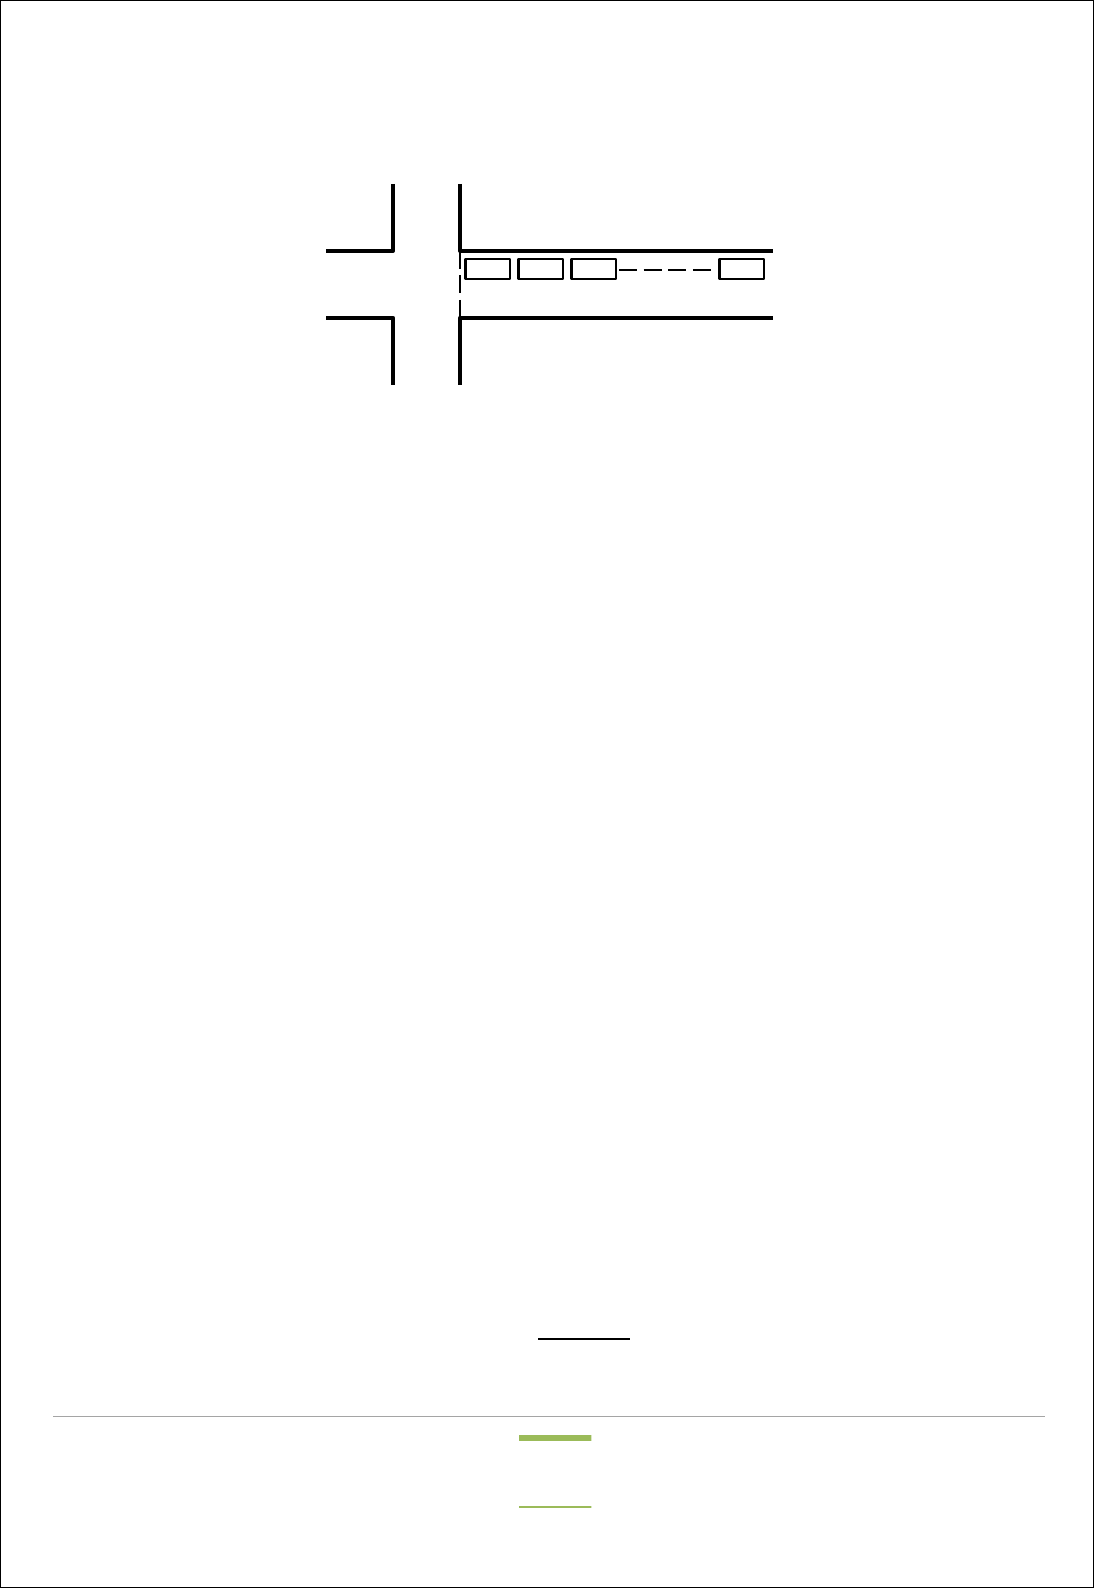
1 2 3 N
Group of vehicles at a signalized
intersection
waiting for green
signal
INTERVAL DESIGN
There are two intervals,namely the change interval and clearance interval,normally provided in a
traffic signal.The change interval or yellow time is provided after green time for movement.The
purpose is to warn a driver approaching the intersection during the end of a green time about the
coming of a red signal.They normally have a value of 3 to 6 seconds.
The design consideration is that a driver approaching the intersection with design speed should be
able to stop at the stop line of the intersection before the start of red time.Institute of Transportation
Engineers(ITE)has recommended a methodology for computing the appropriate length of change
interval which is as follows:
Y = t + (V
85
/2a +19.6g),
where y is the length of yellow interval in seconds,t is the reaction time of the driver,V
85
is the 85
th
percentile speed of approaching vehicles in m/s,a is the deceleration rate of vehicles in m/s
2
,g is the
grade of approach expressed as a decimal.Change interval can also be approximately computed as
y=(SSD/v),where SSD is the stopping sight distance and v is the speed of the vehicle.The clearance
interval is provided after yellow interval and as mentioned earlier,it is used to clear off the vehicles in
the intersection.Clearance interval is optional in a signal design.It depends on the geometry of the
intersection.If the intersection is clear,there is no need of clearance intervalwhereas for very large
intersections,it may be provided.

TRAFFIC SIGNAL DESIGN
‘`
DEPARTMENT OF CIVIL ENGG | J.U.I.T
16
v
CYCLE TIME
Cycle time is the time taken by a signal to complete one fully cycle of iterations i.e. one complete
rotation through all signal indications.It is denoted by C.The way in which the vehicles depart from
an intersection when the green signal is initiated will be discussed now.Figure below illustrates a
group of N vehicles at a signalized intersection,waiting for the green signal.As the signal is
initiated,the time interval between two vehicles,referred as headway,crossing the curb line is
noted.The first headway is the time interval between the initiation of the green signal and the instant
vehicle crossing the curb line.The second headway is the time interval between the first and the
second vehicle crossing the curb line.Successive headways are then plotted as in figure.The first
headway will be relatively longer since it includes the reaction time of the driver and the time
necessary to accelerate.The second headway will be comparatively lower because the second driver
can overlap his/her reaction time with that of the first driver’s.After few vehicles,the headway will
become instant.This constant headway which characterizes all headways beginning with the fourth or
fifth vehicle,is defined as the saturation headway,and is denoted as h.This is the headway that can be
achieved by a stable moving platoon of vehicles passing through a green indication.If every vehicle
require h seconds of green time,and if the signal were always green time,then s vehicles per hour
would pass the intersection.Therefore,
S=(3600/h)
where s is the saturation flow rate in vehicles per hour of green time per lane,h is the saturation
headway in seconds vehicles per hour of green time per lane.As noted earlier,the headway will be
more than h particularly for the first few vehicles.The difference between the actual headway and h
for the i
th
vehicle and is denoted as shown in figure.These differences for the first few vehicles can be
added to get start up lost time.
The green time required can be found out as,
T=l
1
+hN,
where T is the time required to clear N vehicles through signal.It is the start-up lost time required to
clear N vehicles through signal,l
1
is the start-up lost time,and h is the saturation headway in seconds.

TRAFFIC SIGNAL DESIGN
‘`
DEPARTMENT OF CIVIL ENGG | J.U.I.T
17
Headway
EFFECTIVE GREEN TIME
Effective green time is the actual time available for the vehicles to cross the intersection.It is the
sum of actual green time(G
i
)plus the yellow minus the applicable lost times.This lost time is the sum
of start-up lost time(l
1
)and clearance lost time(l
2
)denoted as t
1
.Thus effective green time can be
written as,
G
g
=G
i+
Y
i
-t
i
LANE CAPACITY
The ratio of green time to the cycle length(g/c)is defined as green ratio.We know that saturation
flow rate is the number of vehicles that can be moved in one lane in one hour assuming the signal to
be green always.
CRITICAL LANE
During any green signal phase,several lanes on one or more approaches are permitted to move.Thus
it requires more time than any other lane moving at the same time.If sufficient time is allocated for
this lane,then all other lanes will also be well accommodated.There will be one and only one critical
lane in each signal phase.The volume of this critical lane is called critical lane volume.
e
1
h
1
e
2
e
3
h
Vehicles in queue
Headways
departing signal

TRAFFIC SIGNAL DESIGN
‘`
DEPARTMENT OF CIVIL ENGG | J.U.I.T
18
DESIGN METHODS
1.TRIAL CYCLE METHOD
The 15 minute-traffic counts n1 and n2 on road 1 and 2 are noted during the design peak hour flow.
Some suitable trial cycle C
1
second is assumed and the number of assumed cycle in 15 minutes or
15*60 seconds period is found to be (15*60) / C
1
, i.e. 900/C
1
. Assuming an average time headway 2.5
seconds, the green periods G
1
and G
2
of roads 1 and 2 are calculated to clear the traffic during the trial
cycle.
G
1
=2.5 n
1
C
1
/ 900 and G
2
= 2.5 n
2
C
2
/ 900
The amber periods A
1
and A
2
are either calculated or assumed suitably (3-4 seconds) and length C
1
’
is calculated, equal to (G
1
+ G
2
+A
1
+ A
2
) seconds. If the calculated cycle length C
1
’ works out to be
approximately equal to assumed cycle length C
1
, the cycle length is accepted as design cycle.
otherwise the trials are repeated till trial cycle length works out approximately equal to calculated
value.
2.APPROXIMATE METHOD
The following design procedure is suggested for the simple design of the two phase signal unit at
cross roads , along with pedestrian signals :
Based on approach speed of the vehicles , the suitable , clearance interval between green
and red period i.e. clearance amber period are selected . The amber period may be taken as
2 , 3 and 4 seconds for low , medium and fast approach speeds.
Based on pedestrian walking speed of 1.2 m per sec. , the clearance for pedestrian time is
also calculated.
Minimum red time of traffic signal is taken as pedestrian clearance time for crossing plus
initial interval for pedestrian to start crossing. This red time is equal to the the minimum
green time plus amber time for the cross road.

TRAFFIC SIGNAL DESIGN
‘`
DEPARTMENT OF CIVIL ENGG | J.U.I.T
19
The minimum green time is calculated based on pedestrian criterion , equal to pedestrian
clearance time for cross road plus an initial interval when pedestrian may start to cross
minus amber period. This is equal to the red time for the cross road minus amber period for
the cross road.
with pedestrian signal the initial interval is the walk period ; this should not be less
than seven seconds.
where no pedestrian signal is used , a minimum period of five seconds is used as
initial interval.
The actual green time needed is increased based on the ratio of approach volume for the
heaviest traffic volume per hour per lane. The cycle length so obtained is adjusted for the next
higher 5-seconds interval. The extra time is then distributed to green timings in proportion to
the approaching volumes of the traffic.
The values so obtained are calculated in percentage basis is the controller settings are in per
cent of cycle.
The timings so obtained are installed in the controller and the operations are then observed at
the site during the traffic peak hours. Corrections or modifications are carried out if needed.
1. WEBSTER’s METHOD
In this method, the optimum signal cycle C
0
corresponding to least total delay to the vehicles at the
signalised intersection has been worked out. This is a rational approach. The field work consist of ( i)
The saturation flow S per unit time on each approach of the water section and (ii) The normal flow q
on each approach during the design hour. Based on the higher value of normal flow, the ratio y
1 =
q
1
/S
1
and y
2=
q
2
/S
2
are determined on the approach road 1 and 2. In case of mixed traffic , it is necessary to
convert all the normal flow and saturation flow values in terms of suitable PCU values which should
be determined separately.
The saturation flow is to be obtained from careful field studies by noting the number of vehicles in
the stream of compact flow during the green phases and the corresponding time interval precisely. In
the absence of data the approximate value of saturation flow is estimated assuming 160pcu per 0.3 m

TRAFFIC SIGNAL DESIGN
‘`
DEPARTMENT OF CIVIL ENGG | J.U.I.T
20
width of the approach. The normal flow of the traffic is also determined on the approach road from the
field studies for the design period (during the peak or off- peak hours as the case may be ).
The optimum signal cycle is given by:
C
O=
(1.5L+5)/(1-Y)
where L = total lost time per cycle, seconds = 2n+R (n is the no. of phase and R is all red-time)
Y=y
1
+y
2
Then G
1
=y
1
(C
o
–L)/Y and
G
2
=y
2
(C
o
–L)/Y
Similar procedure is followed when there are more no. of signal phases.
SPECIAL DESIGN CONSIDERATIONS
1. CONTROL OF ACCESS
To ensure safe and efficient circulation of traffic, which serves the various land uses adequately and
ensures logical community development, the network of roads in an urban area has to be divided into
different subsystems each serving a particular function or a purpose,. The principal factor to be
considered in designation of roads into different categories are the travel desire lines, access needs of
adjacent properties, network pattern and land use. For the purpose of these guidelines, urban
highways/ streets are considered to be divide into following types :
Arterial highways/ streets
Sub-arterial streets
Collector streets
Local street
2. SPACING OF INTERSECTIONS
Although the standards for the locations of access points depend largely on the need of an area, the
following guidelines which are indicative of good practice, may be followed as far as possible.

TRAFFIC SIGNAL DESIGN
‘`
DEPARTMENT OF CIVIL ENGG | J.U.I.T
21
Spacing between intersections should have regard to the relevant geometric design and traffic
requirements, such as type of traffic, length of right turn or speed change lanes etc.
As a rough guide, the suggested minimum spacing along various
types of roads is given below :
a. Arterial highways / streets 500 metres
b. Sub-arterial 300 metres
c. Collector streets 150 metres
d. Local streets Free access
Where necessary, a greater distance than given above should be adopted, as for
example between junctions with linked traffic signals.
Arterial streets should preferably be linked to have a progressive system, permitting
continuous movement of vehicles at a planned speed of travel. As far as possible, all such
intersections should approximately the same spacing.
Apart from regular intersections, limited number of access points with intervening streets may
be permitted at a spacing closer than mentioned above provided only left turns and from the
main streets are permitted.
The location and spacing of all major points of access including accesses to bus terminals,
railways station, parking areas etc. should be carefully planned so as to ensure safety and
freedom from congestion, bus bays should not be located too close to intersection. It is
desirable that they are located 75m from either side, preferable on farther on farther side of
intersection.
On arterials, direct access to residential plots is not permitted. Driveways may, however, be
permitted on a restricted basis for commercial and industrials complexes and other public
locations when these are major generators of traffic. Right turn from these driveways should
not be permitted unless the crossing fulfils the spacing criteria given above. Moreover,
adequate road geometries should be provided to enable safe operations of vehicles.
On sub arterials, direct access to residential property should be granted only where alternative
cannot be provided at reasonable cost.

TRAFFIC SIGNAL DESIGN
‘`
DEPARTMENT OF CIVIL ENGG | J.U.I.T
22
On collector streets, access to abutting propertis may be allowed to a limit extent keeping in
view the safety of traffic.
On local streets, which will have no through traffic, access to abutting properties can be freely
given.
1. PEDESTRIANS AT JUNCTION
Pedestrian crossings may be designed in accordance with the ‘Guidelines on pedestrians’ facilities’
by IRC.
2.CYCLE TRACKS
it is desirable to segregate cycle traffic at intersections also since intersections also since
intersections are dangerous, accident-prone locations. This could be achieved by a suitable
system of multi-phase signalisations.
Where cycle tracks are not segregated, suitable safety measures at intersections should be
adopted, such as provision of separate lanes for cycle traffic, provision of cycle boxes ahead of
stop lines, and provision of turning cycle paths in conjunction with signalisation. Cyclist
crossings must always be marked in accordance with IRC guidelines.
At signalised intersections, a separate lane for cycle traffic along with a reservoir space between
pedestrians’ crossings zone and stop line for motorised vehicle provides an efficient regulation. A
separate cycle track of minimum 1.2m width should be provided in the approaches of intersection.
There would be two stop lines, one for motor vehicle and other for cyclists such that the cyclists can
wait in the reservoir space, for signal to turn green.
CONTROL MEASURES
CHANNELISATION
Channelisation involves the use of islands a intersections to guide and protect the traffic it provides
reference points within the intersection which enable drivers to better predict the path and speed of

TRAFFIC SIGNAL DESIGN
‘`
DEPARTMENT OF CIVIL ENGG | J.U.I.T
23
other drivers. They increase the driver’s ability to avoid accidents and congestions. Channelised
islands should be at least 4.7m
3
and preferably 7.1m
3
in area , not less than 2.4m and preferably
3.6m on any side rounding of corners if triangular and at least 1.2m and preferably 3.6m if elongated.
CARRIAGEWAY MARKINGS
Carriageway markings and direction signs should be located sufficiently in advance of the
intersection to enable drivers to select and follow the lane and path they should take through the
intersection , Markings at intersections can be a combination of centre lines , turn markings , stop
lines , route direction arrows , pedestrian crossings etc.
OTHER ASPECTS
VISIBILITY
The safety of traffic can be ensured only if the visibility is full and unimpeded along both roads . Any
obstruction should be clear of the minimum visibility triangle for a height of 1.2m above the
roadway.
The intersection should be planned and located to provide as much sight distance as possible.
In achieving a safe highway design , there should be sufficient sight distance for the driver on the
minor highway to cross the major highway without requiring the approaching traffic to reduce speed.
LIGHTING
From the operation point of view , road illumination should provide pleasant and accurate night
seeing conditions so that traffic movements may be made easily and safely. More light is required if
the pedestrian crossing the intersections are larger in number. With light to medium pedestrian traffic
and vehicular traffic upto 500 veh / hour.., 120 mtrs , staggered lamp posts with lamps of 10000
lumens will be sufficient.

TRAFFIC SIGNAL DESIGN
‘`
DEPARTMENT OF CIVIL ENGG | J.U.I.T
24
DESIGN AS PER I.R.C METHOD
The design of a signal scheme includes the selection of the type of signal, number of phases, amber
period, cycle time and time allotted to each phase as also other specific features such as exclusive
turning phase or pedestrian phase. Based on the field data, volume and speeds. The signal timings are
calculated by IRC method.
DESIGN METHOD AS PER IRC GUIDELINES
The pedestrian green time required for the major and minor roads are calculated based on
walking speed of 1.2m/s and initial walking time of 7 seconds. These are the minimum green
time required for vehicular traffic on major and minor roads respectively.
The green time required for vehicular traffic on the major road is increased in proportion to the
traffic on the two approach roads.
The cycle time is calculated after allowing amber time if 2 sec each.
The minimum green time required for clearing vehicles arriving during the cyclist determined
for each lane of approach road assuming that first vehicle will take 6.0 sec. and the subsequent
vehicles (PCU) of the queue will be cleared at the rate of 2.0 sec. The minimum green time
required for the vehicular traffic on any of the approaches is limited 16 sec.
The optimum signal cycle time is calculated using Webster formula. The saturation flow
values may be assumed as 1850,1890,1950,2250,2550 and 2990 PCU per hour for the
approach roadway width ( kerb to median or centre line) of 3.0,3.5,4.0,4.5,5.0 and 5.5 metre,
for width above 5.5 metre, the saturation flow may be assumed as 525 PCU per hour per metre
width. The loss time is calculated from amber time, inter-green time and initial delay of 4
seconds for first vehicle, on each leg.
The signal time and the phases may be revised keeping in view the green time required for
clearing the vehicles and the optimum cycle length determined in steps 4 and 5 above.

TRAFFIC SIGNAL DESIGN
‘`
DEPARTMENT OF CIVIL ENGG | J.U.I.T
25
FIELD STUDIES AND GENERAL REVIEW
Traffic studies are conducted with the aim of analyzing the existing traffic characteristics and to
provide a national basis for the evolution of a geometrically safe and efficient traffic control facility.
These studies also help in deciding upon measures to be adopted for the improvement of any
inefficient or faulty exiting traffic facility.
The following field studies have been conducted for the purpose of this study:-
1. Traffic Volume Studies
2. Traffic Speed Studies
PERIOD OF STUDY
Peak flow timings are of necessity to form the basis for conducting traffic studies. By observation it
was found that peak flow conditions exist between 9:30 A.M. to 10:30 A.M. and again between 5:00
P.M. to 6:00 P.M at the sector 17 approaching road and between 9:00 A.M. to 10:00 A.M. and again
between 4:30 P.M. to 5:30 P.M on the industrial area approaching road, between 9:00 A.M. to 10:00
A.M. and again between 5:30 P.M. to 6:30 P.M on the sector 26 approaching road, between 8:30 A.M.
to 9:30 A.M. and again between 6:00 P.M. to 7:00 P.M on the sector 32 approaching road at the
selected intersection of Sectors 27-28-29 & 30 and covered a heterogeneous mix of traffic which
included commercial , office-going, school/college going and city (CTU) buses. Studies were
conducted on Tuesdays ,Wednesdays ,Thursdays while Saturdays , Sundays and Holidays were
excluded. There were no maintenance or repair works being carried out any of the four legs of the
intersection during the period of study. Field studies were conducted during Feb / March. 2014.

TRAFFIC SIGNAL DESIGN
‘`
DEPARTMENT OF CIVIL ENGG | J.U.I.T
26
TRAFFIC VOLUME STUDIES
Traffic volume is the number of vehicles crossing a section of road during a selected period. A
knowledge of the flow characteristics helps us determine whether a particular section of the road is
efficiently capable of handling the volume of traffic for which it has been designed. The volume is
recorded in vehicles / day or PCU / hour. A comprehensive volume study must record the volume of
various types of traffic and the distribution by direction and turning movements per unit time.
PURPOSE OF TRAFFIC VOLUME STUDY
The objectives of a traffic volume study are as follows :-
To analyse traffic patterns and trends.
For planning traffic operations and controls of existing facilities , and for designing
new facilities.
Classified volume study is useful in structural design of pavements , in geometric
design and in computing road capacity , and thereby deciding on priorities for
improvement and expansion.
Volume distribution study is used in planning one-way streets and other regulatory
measures.
Pedestrian volume study is used for planning side walks , cros walks , subways and
pedestrian signals.
Turning movements study is used in design of intersection , in deciding on signal
timings , channelization and other control devices.
Traffic volume study is used in deciding on the relative importance of roads and in
allocating priorities for the improvement of existing facilities.

TRAFFIC SIGNAL DESIGN
‘`
DEPARTMENT OF CIVIL ENGG | J.U.I.T
27
METHOD OF TRAFFIC COUNT
The various methods available for traffic counts are listed below, and the method which has been
used in the present study is explained thereafter.
a) Manual Method
b) Combination of manual and mechanical method
c) Automatic devices
d) Moving observer Method
(a)MANUAL METHOD
While each of the methods have their own advantages , the manual method is the most convenint
wherein field personnel are used to count and classify traffic flowing part a fixed point. This method
is also advantageous when counts are for fairly short durations , and when severe weather conditions
could interfere with the use of mechanical or other equipment is available. The number of observers
needed to count the traffic depends on the number of lanes or rounds converging at the intersection
under study. As there are four approaches to the roundabout , a team of 5 observers was required on
each approach to record the traffic volume and Scooters / Mopeds / 3-Wheelers / motorcycles and
Cycles / Cycle i.e. straight , left turning and right turning. The volume count was conducted with the
help of four observers , over a number of days and the results are summed up and tabulated.
.
CONCEPT OF PASSENGER CAR UNITS
Vehicles of different types require different amounts of road space. As each type of vehicle has an
influence on the performance of a traffic facility in its own different way , it is the normal practice to
convert the flow into equivalent passenger car units (PCUs) by using certain equivalence factors. The
basic unit is the car ( taxis , light vans and three wheelers all count as one unit ). Buses and trucks
which cover more road space impose a greater traffic load on the roads than cars do and thus the

TRAFFIC SIGNAL DESIGN
‘`
DEPARTMENT OF CIVIL ENGG | J.U.I.T
28
overall effect of a truck or bus is equivalent to several passenger car units. Hence for design purposes
, we convert all the vehicles into passenger car units (PCUs) with the car taken as basic unit.
The appropriate PCU values for different types of vehicles under varying conditions are given in
table 1 in annexure
TABULATION AND PRESENTATION OF TRAFFIC VOLUME DATA
For the purpose of collection of traffic volume data at the intersection vehicles have been classified
into five broad categories as follows :
a) Heavy vehicles comprising buses and trucks
b) Medium vehicles comprising cars / jeeps / vans and light vehicles.
c) Scooters , mopeds , motor cycles.
d) Cycles and cycle rickshaws
e) Animal driven carts
The traffic counts were made for the above classes of vehicles respect to their respective directional
movements i.e. for straight moving , left turning and right turning by the manual method. The traffic
volume data was collected with the help of colleagues engaged in similar research studies , posted on
each approach during the peak hour flow specified earlier.
The peak traffic volumes have been calculated after converting the various traffic classifications
mentioned above into Passenger Car units. Traffic volumes for signal design and rotary design were
calculated separately for their respective PCU values as given in table above. These are given in
Tables appended in the next section for signal and rotary design respectively.
The Traffic flow diagrams for both signal design and rotary design have been shown in fig. for peak
hour volume for signal design and for peak hour volume for rotary design.

TRAFFIC SIGNAL DESIGN
‘`
DEPARTMENT OF CIVIL ENGG | J.U.I.T
29
RESULTS
DESIGN OF SIGNAL
STEP1
ROAD 1 (R1) –Sector 17- INDUSTRIAL AREA
ROAD 2 (R2) – Sector 26- Sector 32
ROADS
MORNING PCU
EVENING PCU
From Sec 17 (R1)
1040
1321
From Ind. Area (R1)
750
340
From Sec 26 (R2)
376
728
From Sec 32 (R2)
(GMCH)
564
210
Max. PCU for R1 = 1321
Max. PCU for R2 = 728
Width of roads R1 and R2 = 19.5m (4 lanes)
Design traffic for R1 = 1321/2 = 660.5 PCU/hr
Design traffic for R2 = 728/2 = 364 PCU/hr
Pedestrian green time for R1 = (19.5/1.2) + 7 = 23.25
Pedestrian green time for R2 = (19.5/2) +7 = 23.25
Green time for vehicles on R2= 23.25
Green time for vehicles on R1 = 23.254 * (660.5/364) = 42.18
Now, adding 2 seconds each towards clearance amber and 2 seconds inter-green
period for each phase
Therefore, total cycle = (2+42.18+2) + (2+23.5+2)
= 73.44 seconds = 75 seconds
Therefore,
Green for R2 , G1 = 24 seconds
Green for R1, G2 = 43 seconds

TRAFFIC SIGNAL DESIGN
‘`
DEPARTMENT OF CIVIL ENGG | J.U.I.T
30
STEP 2
Vehicle arrival per lane on R2 = 364/75 = 4.85 PCU
Minimum green time for clearing vehicles on Road 2 = 6 + (4.85 - 1)*2
= 13.7 seconds < 24 seconds
On Road 1,
Vehicle arrival per lane on R1 = 660.5/75 = 8.8 PCU
Minimum green time for clearing vehicles on Road 1 = 6 + (8.8 – 1)*2
= 21.6 seconds < 43 seconds
As green time provide for two roads by pedestrian crossing criteria are higher than
these values, the above design is alright.
STEP 3
Lost time per cycle = (amber time +inter-green time+ time lost in initial delay of first
vehicle) for two phases
= (2+2+4) * 2
= 16 seconds
Saturation flow for Road 1 = 525 * 9.75 = 5118.75 PCU/hr
Saturation flow for Road 2 = 525 * 9.75 = 5118.75 PCU/hr
Y
1
= 1321/5118.75 = 0.258
Y
2
= 728/5118.75 = 0.142
Y = Y
1
+ Y
2
= 0.4
Now, OPTIMUM CYCLE TIME C
o
= ( 1.5 L + 5 ) / (1 – Y)
= ((1.5*16)+5) / (1-0.4)
= 48.3 seconds
Therefore the cycle time of 75 seconds designed earlier is acceptable.

TRAFFIC SIGNAL DESIGN
‘`
DEPARTMENT OF CIVIL ENGG | J.U.I.T
31
Details of signal timings is given below :-
ROAD
DIRECTION
GREEN
AMBER
RED
CYCLE
R1
STRAIGHT
27
2
46
75
R1
RIGHT
14
2
59
75
R2
STRAIGHT
14
2
59
75
R2
RIGHT
8
2
65
75
*Time is in seconds

TRAFFIC SIGNAL DESIGN
‘`
DEPARTMENT OF CIVIL ENGG | J.U.I.T
32

TRAFFIC SIGNAL DESIGN
‘`
DEPARTMENT OF CIVIL ENGG | J.U.I.T
33
CONCLUSIONS AND RECOMMENDATIONS
ALTERNATE PROPOSALS IN GENERAL
The collected traffic data in tables and survey plan of the intersections gives a complete idea of the
problem. The first traffic control measure is the control with the use of signs, but such a large traffic
volume which occurs at peak hours negates its utility; for effective traffic control by police constables
is not satisfactory.
The present traffic volume also does not justify a grade-separated interchange, although such a
measure may be required at a future in time. The other options available are either redesign of
roundabout or the installation of traffic signals.
TRAFFIC VOLUME
The existing and predicted traffic volumes should be one of the most important criteria in evolving
the type of intersection required and traffic control measure best suited for it. If the predicted traffic
volume ( at least 10 years hence) is not taken into account it may result in an avoidable situation of an
intersection design providing inadequate, and requiring a redesign every now and then.
The most ideal design of an intersection should be as such as would cater for future traffic
conditions with minimum alterations in the control system. At the rotary under study, the present peak
traffic volume is more than what a rotary intersection can handle effectively. Therefore excessive
delays and frequent stoppage of traffic is caused due to high traffic volume and it can be concluded
that the main purpose of rotary is defeated.
GEOMETRIC LAYOUT
In build up areas the geometrical layout of intersection is normally the controlling factor. Very often
the adjacent building lines do not permit the construction of roundabout of large dimensions. The
layout of existing intersection proves that a roundabout requires more land/area than a signalised
intersections. Keeping in view the master plan of chandigarh, the only type of control feasible at this
intersections is traffic signals.

TRAFFIC SIGNAL DESIGN
‘`
DEPARTMENT OF CIVIL ENGG | J.U.I.T
34
ALTERNATIVE – 1 : IMPROVEMENT OF ROUNDABOUT
Keeping in view a 10 year projection of traffic volume based on the existing data for
1999, the following would have to be considered to improve the roundabouts.
1. Enlarging the central island.
2. Providing channelizing islands.
3. Introducing separate left turning roads (slip roads).
4. Incorporation of adequate rotary design elements as per IRC specifications.
The improvement of the roundabout can be achieved mainly by providing separate traffic lanes for
left turning traffic, and by increasing carriageway widths.
The redesign roundabout has to handle a peak traffic volume of more than 2.0 times the present one
in coming years. This is obviously impracticable if not possible as it will require to keep changing the
geometric elements of the rotary to cater for the increase in the traffic volume which will ultimately be
a very expensive option.
ALTERNATE 2 – TRAFFIC SIGNAL INSTALLATION
The present traffic volume warrants the installation of a traffic signal which can easily handle the
present traffic with major alterations in the signal layout.
If the traffic volume during the middle of the day, or for a considerable period between the peak
hours is much lower than the peak hour volume (design volume), the signal controller can be adjusted
to give two cycle length, one for peak hour volume and other for normal volume at other than peak
hour timings.
A future increase in the traffic volumes can easily be catered for by adjusting the signal controller to
give a suitable cycle length, which would obviously be quiet economical to implement. The proposed
traffic signal has a reserve capacity of 21%. This indicates that the signal can handle a future traffic
volume 21% more than present volume.
From the work done in this study, it is justified that the roundabout may be converted into a signal
controlled intersection. In the following section a typical signal with minimum delay and maximum
safety and convenience to traffic is given.

TRAFFIC SIGNAL DESIGN
‘`
DEPARTMENT OF CIVIL ENGG | J.U.I.T
35
Conclusion:
In conclusion, it needs to be emphasized that “efficient intersection means efficient city and efficient
city means efficient economy”. It should be appreciated that only by regulating, managing and
developing efficient intersections can we ensure that urban mobility of “today” does not have to be
rationed “tomorrow” and that it does not turn into immobility “day-after-tomorrow”.
Under mixed traffic conditions, such as the one in Chandigarh, there is no queue or lane
discipline followed by traffic; and the vehicles occupy the available road space on approaches
as densely as possible in a haphazard manner. This condition chokes the roundabout
completely during peak hours. The roundabouts constructed some 20years ago to cater for the
then prevailing traffic volume are now totally inadequate to handle the present day volume.
The unrestricted mixing of various vehicles at the intersections without their physical
segregation creates various complex problems such as, speed reduction and difficult turning
manoeuvres. Hence, a significant amount of vehicular interaction exists at intersections which
results in traffic scrambles and utter chaos.
The speed reduction and manoeuvring, which is a part of an intersection flow, become manifold due
to different vehicle operating conditions. Within a turning manoeure, the problems get multiplied due
to speed differential and different vehicular operational characteristics.
The geometric elements of the existing roundabout do not strictly conform to the I.R.C
standards especially the entry and exit radii, weaving length etc.
‘Before and After’ studies should be undertaken to evaluate the impact of each improvement
in terms of traffic operations.
“Enforcement and Education” as restrictive measures can play their roles effectively only
when Engineering has been exploited to its fullest potentialities for intersection control.

TRAFFIC SIGNAL DESIGN
‘`
DEPARTMENT OF CIVIL ENGG | J.U.I.T
36
RECOMMENDATIONS
The results of this study reveal that provision of slip roads at existing roundabouts is not going
to increase the capacity of the intersection as the left turning traffic is not high. The main
reason of the lock-up is the right turning and straight going traffic which weaves and crosses
through the intersectional area. The increase in the capacity of the roundabout by increasing its
radius will not serve any useful purpose as the delay factor will not be removed due to more
time taken by traffic to go around the rotary than crossing the signalized intersection;
especially the right turning traffic.
To provide highest level of service to the traffic, as it was experiencing on straight road, the
intersection must be designed for the increased traffic. It is therefore, recommended that the
present existing roundabout selected for investigation be replaced by a signal controlled
intersection.
The performance of signalized intersections greatly influences the level of urban road network,
hence traffic control devices and markings should also be installed as per I.R.C guidelines.
Facilities should be provided for pedestrian crossing. Provision shall also be available for
flashing of the red pedestrian crossing signal for a period of six seconds during the clearance
interval.
Facilities shall be provided for flickering of left turn arrows.
The standard controller shall have provision for 3 cycles with different intervals in each cycle
patters to cater to morning, evening and off-peak traffic flow conditions during the day. A
circuit shall also be incorporated which enables different phasing sequence in each cycle if so
required. In addition, one cycle of amber flashing on main roads and red flashing on minor
roads shall also be provided to cater to night traffic conditions. The controller shall be capable
of changing over automatically from one pattern to the next one at present times of the day.
There shall be facility for manual control of the signal indication as optional.
Although the four phases of the selected intersection have been suggested at present to
eliminate certain conflicts, yet “no intersection design can be considered as final because of
the evergrowing but varying traffic requirements”. Also the traffic road network and traffic
control measures on the adjoining roads of the intersection have to be checked and observed,

TRAFFIC SIGNAL DESIGN
‘`
DEPARTMENT OF CIVIL ENGG | J.U.I.T
37
since the installation of the signal may affect the traffic patterns and volumes which have not
been accounted for in the design. Therefore, it is recommended that the traffic data be updated
and re-evaluated regularly and the number and timing of phases may be adjusted accordingly.
The responsibility for its maintenance should be clearly established. The responsible agency
should provide for the maintenance of the signal and all of its appurtenances in a responsible
manner.

TRAFFIC SIGNAL DESIGN
‘`
DEPARTMENT OF CIVIL ENGG | J.U.I.T
38
APPENDIX
TABLE-1
Sr
N
o.
Class of
vehicles
Urb
an
area
Rural
area
Round
about
design
Traffic
Signal
Design
Level
Terrain
Rolling
Terrain
Mountainous
Terrain
1
Cars/
Jeeps/
Van
1.00
1.00
1.00
1.00
1.00
1.00
1.00
2
Motor
Cycle /
Scooters.
Mopeds /
3
Wheelers
0.75
1.00
0.75
0.33
1.00
1.25
3
Medium
to heavy
goods
vehicle /
horse
drawn
vehicles
2.00
3.00
2.80
1.75
2.00
4.00
6.00
4
Buses /
Coaches /
Trams /
Heavy
Trucks
3.00
3.00
2.80
2.25
3.00
6.00
8.00
5
Pedal
cycles /
Cycle
Rickshaw
s
0.33
0.50
0.50
0.20
0.50
0.60

TRAFFIC SIGNAL DESIGN
‘`
DEPARTMENT OF CIVIL ENGG | J.U.I.T
39
TABLE-2
Traffic Volume Study at Roundabout between Sectors 27-28-29-30 for Signal
Design
Weather: Good Date: 17-02-14 & 18-02-14
Road Surface: Good Time: 9:30 am to 10:30am &9:00am to 10:00am
Vehicle
Class
PCU
Traffic Entering the Intersection
Sector-17 End[9:30AM to 10:30AM]
Industrial Area End[9:00AM to 10:00AM]
Left
No. PCU
Straight
No. PCU
Right
No.
PCU
Left
No. PCU
Straight
No. PCU
Right
No. PCU
Car/Jeep
1
135 135
423 423
214 214
89 89
244 244
227 227
Motor
scooter
0.4
82 33
194 78
161 65
63 26
149 60
154 62
Bus/Truck
2.2
1 3
19 42
3 7
0 0
14 31
1 3
3wheeler
0.5
4 2
52 26
23 12
4 2
5 3
6 3
PCU/Hour 173 569 298 117 338
295
G.Total 1040 750
PCU/Hour
% Turning 16.63% 15.6%
Left
% Turning 28.65% 39.33%
Right

TRAFFIC SIGNAL DESIGN
‘`
DEPARTMENT OF CIVIL ENGG | J.U.I.T
40
Figure 1: approaching road from sector 17 direction
Figure 2: approaching road from industrial end direction

TRAFFIC SIGNAL DESIGN
‘`
DEPARTMENT OF CIVIL ENGG | J.U.I.T
41
TABLE-3
Traffic Volume Study at Roundabout between Sectors 27-28-29-30 for Signal
Design
Weather: Good Date: 19-02-14 & 20-02-14
Road Surface: Good Time: 5:00pm to 6:00pm&4:30pm to 5:30pm
Vehicle
Class
PCU
Traffic Entering the Intersection
Sector-17 End[5:00PM to 6:00PM]
Industrial Area End[4:30PM to 5:30PM]
Left
No. PCU
Straight
No. PCU
Right
No. PCU
Left
No. PCU
Straight
No. PCU
Right
No. PCU
Car/Jeep
1
89 89
520 520
379 379
64 64
92 92
89 89
Motor
scooter
0.4
49 20
199 80
334 134
47 19
63 26
61 25
Bus/Truck
2.2
2 5
19 42
2 5
1 3
1 3
2 4
3wheeler
0.5
13 7
30 16
48 24
12 6
9 5
7 4
PCU/Hour 121 658 542 92 126
122
G.Total 1321 340
PCU/Hour
% Turning 9.1% 27.05%
Left
% Turning 41.02% 35.88%
Right

TRAFFIC SIGNAL DESIGN
‘`
DEPARTMENT OF CIVIL ENGG | J.U.I.T
42
Figure 3: approaching road from sector 17 direction
Figure 4: approaching road from industrial end direction

TRAFFIC SIGNAL DESIGN
‘`
DEPARTMENT OF CIVIL ENGG | J.U.I.T
43
TABLE-4
Traffic Volume Study at Roundabout
Between Sectors 27-28-29-30
For
Signal Design
Weather: Good Date: 24-02-14 & 25-02-14
Road Surface: Good Time: 9:00am to 10:00am&8:30am to 9:30am
Vehicle
Class
PCU
Traffic Entering the Intersection [9:00AM to 10:00AM]
Sector-26 End[9:00AM to 10:00AM]
GMCH End[8:30AM to 9:30AM]
Left
No. PCU
Straight
No. PCU
Right
No. PCU
Left
No. PCU
Straight
No. PCU
Right
No. PCU
Car/Jeep
1
97 97
38 38
137 137
69 69
257 257
100 100
Motor
scooter
0.4
96 39
59 24
84 34
61 25
193 78
66 27
Bus/Truc
k
2.2
0 0
0 0
0 0
2 5
1 3
0 0
3wheeler
0.5
5 3
3 2
4 2
2 1
3 2
1 1
PCU/Hour 139 64 173 100 340
128
G.Total 376 568
PCU/Hour
% Turning 36.96% 37.31%
Left
% Turning 46.01% 22.53%
Right

TRAFFIC SIGNAL DESIGN
‘`
DEPARTMENT OF CIVIL ENGG | J.U.I.T
44
Figure 5: approaching road from sector 32 direction
Figure 6: approaching road from sector 26 direction

TRAFFIC SIGNAL DESIGN
‘`
DEPARTMENT OF CIVIL ENGG | J.U.I.T
45
TABLE-5
Traffic Volume Study at Roundabout Between Sectors 27-28-29-30 For
Signal Design
Weather: Good Date: 26-02-14 & 27-02-14
Road Surface: Good Time: 5:30pm to 6:30pm&6:00pm to 7:00pm
Vehicle
Class
PCU
Traffic Entering the Intersection
Sector-26 End[5:30PM to 6:30PM]
GMCH End[6:00PM to 7:00PM]
Left
No. PCU
Straight
No. PCU
Right
No. PCU
Left
No. PCU
Straight
No. PCU
Right
No. PCU
Car/Jeep
1
190 190
306 306
63 63
20 20
48 48
51 51
Motor
scooter
0.4
122 49
217 87
42 17
55 22
40 16
50 20
Bus/Truck
2.2
0 0
1 3
2 5
1 3
2 3
2 4
3wheeler
0.5
6 3
6 3
4 2
14 7
24 12
7 4
PCU/Hour 242 399 87 52 79
79
G.Total 728 210
PCU/Hour
% Turning 33.24% 24.76%
Left
% Turning 11.95% 37.61%
Right

TRAFFIC SIGNAL DESIGN
‘`
DEPARTMENT OF CIVIL ENGG | J.U.I.T
46
Figure 7: approaching road from sector 32 direction
Figure 8: approaching road from sector 26 direction

TRAFFIC SIGNAL DESIGN
‘`
DEPARTMENT OF CIVIL ENGG | J.U.I.T
47
Figure 9: Google earth view of the rotary

TRAFFIC SIGNAL DESIGN
‘`
DEPARTMENT OF CIVIL ENGG | J.U.I.T
48
REFERENCES
1.S.K. Khanna, C.E.G. Justo ,Nem Chand & Bros, 1991
2. Traffic Engineering and Transport Planning L. R. Kadiyali Khanna Publishers, 1983
3. Guidelines for the design of flexible pavement,IRC -37,2001,the Indian road congeess, New delhi
2001.
4. Adaptive Traffic Signals, Comparison and Case Studies Kevin Fehon, P.E., PTOE and Jim Peters,
P.E., PTOE
5. TRAFFIC SIGNAL TIMING MANUAL Publication Number: FHWA-HOP-08-024
6. Justo, C.E.G. and S.B.S. Tuladhar (1984), “Passenger Car Unit Values for Urban Roads.”
Journal of Indian Roads Congress
7. Road Designs for Improving Traffic Flow A Bicycle Master Plan for Delhi Geetam Tiwari
INDIAN INSTITUTE OF TECHNOLOGY DELHI
8. Motor Transport Statistics of India 1997-98, Ministry of Surface Transport, Government of India
9. TRAFFIC CHARACTERISTICS OF INDIA Dr. Santosh A.JALIHAL
